The PCR Cycle Demystified: From Basic Steps to Advanced Applications in Research
This article provides a comprehensive guide to the Polymerase Chain Reaction (PCR) cycle, tailored for researchers, scientists, and drug development professionals.
The PCR Cycle Demystified: From Basic Steps to Advanced Applications in Research
Abstract
This article provides a comprehensive guide to the Polymerase Chain Reaction (PCR) cycle, tailored for researchers, scientists, and drug development professionals. It begins by breaking down the foundational three-step process of denaturation, annealing, and extension, explaining the core principles and key reagents. The scope then expands to cover methodological variations like qPCR, RT-PCR, and dPCR, alongside their specific applications in gene expression analysis, diagnostics, and NGS. A detailed troubleshooting section offers proven strategies to overcome common pitfalls such as nonspecific products and amplification failure. Finally, the article explores validation parameters and compares the strengths of different PCR technologies to guide method selection for precise and reliable results in biomedical research.
PCR Fundamentals: Understanding the Core Three-Step Cycle
What is PCR? A Brief History and Its Impact on Molecular Biology
The Polymerase Chain Reaction (PCR) is a revolutionary laboratory method for amplifying specific DNA sequences, enabling their detailed study. Invented in 1983 by American biochemist Kary Mullis, this technique earned him the Nobel Prize in Chemistry in 1993 [1] [2]. PCR serves as a cornerstone of modern molecular biology, allowing researchers to generate millions to billions of copies of a particular DNA segment from a very small initial sample [3] [4].
This method is fundamental to a vast array of procedures in genetic testing, biomedical research, and forensic science [1]. By amplifying trace amounts of DNA, PCR facilitates the identification of infectious agents, the analysis of ancient DNA samples, and the diagnosis of genetic disorders, making it an indispensable tool in both research and clinical diagnostics [1] [5] [6].
The Historical Development of PCR
The Invention and Key Innovators
The history of PCR began with a moment of inspiration during a country drive in California in 1983 [2]. Kary Mullis, then working at Cetus Corporation, conceptualized the use of a pair of primers to bracket a desired DNA sequence and copy it using a DNA polymerase [1] [2]. He formally presented the technique in 1985, and the first clinical application—an analysis of sickle cell anemia—was published that same year [2].
A critical breakthrough came with the introduction of a heat-stable DNA polymerase. Initially, DNA polymerases had to be manually added after each heating cycle because the high temperatures necessary to denature DNA would inactivate the enzyme [1] [7]. The discovery of Taq polymerase, isolated from the thermophilic bacterium Thermus aquaticus found in Yellowstone's hot springs, solved this problem [7] [2]. This thermostable enzyme could withstand the repeated heating cycles without being denatured, enabling the automation of PCR [1] [7].
Evolution of PCR Technology
The commercialization of Taq polymerase in 1988 and the introduction of programmable thermal cyclers marked a turning point, making PCR a fast, accessible, and powerful technique [7]. In 1993, its significance was globally recognized when Mullis was awarded the Nobel Prize in Chemistry [1] [2].
Since then, PCR technology has continued to evolve. Subsequent developments included the introduction of Pfu polymerase from Pyrococcus furiosus in 1991, which offered proofreading capabilities for higher fidelity DNA copying [7]. The development of Hot-start techniques in the late 1980s helped reduce non-specific amplification by inhibiting polymerase activity until the first high-temperature denaturation step [7]. The early 2000s saw the introduction of next-generation engineered polymerases, such as Phusion DNA Polymerase, which provided even higher fidelity, better performance with challenging templates, and faster amplification [7].
Table 1: Key Milestones in the Evolution of PCR
| Year | Development | Key Figure/Entity | Significance |
|---|---|---|---|
| 1969 | Discovery of Thermus aquaticus | Thomas Brock | Source of heat-stable Taq polymerase [2] |
| 1983 | Invention of PCR | Kary Mullis | Conceptualization of the core method [1] |
| 1985 | First formal presentation and clinical application | Kary Mullis/Cetus Corp | Analysis of sickle cell anemia [2] |
| 1988 | Commercialization of Taq polymerase | Cetus Corporation | Automated thermal cycling became possible [7] |
| 1991 | Introduction of Pfu polymerase | - | Offered proofreading for higher fidelity [7] |
| 1993 | Nobel Prize in Chemistry | Kary Mullis | Recognition of PCR's profound impact [1] |
| 2003 | Introduction of Phusion DNA Polymerase | Thermo Fisher Scientific | Next-generation high-fidelity PCR [7] |
The Fundamental Principles and Procedure of PCR
Core Components of a PCR Reaction
A standard PCR reaction requires several key components and reagents to function effectively [1] [3]:
- DNA Template: The sample DNA that contains the target sequence to be amplified.
- DNA Polymerase: A heat-stable enzyme (e.g., Taq polymerase) that synthesizes new DNA strands. Its thermostability is crucial for withstanding the high denaturation temperatures [1].
- Primers: Short, single-stranded DNA fragments (oligonucleotides) that are complementary to the 3' ends of the DNA target region. Two primers (forward and reverse) are required to flank the target sequence [1] [4].
- Deoxynucleoside Triphosphates (dNTPs): The individual building blocks (adenine, thymine, cytosine, guanine) from which the DNA polymerase constructs new DNA strands [1] [3].
- Buffer Solution: Provides a stable chemical environment (including bivalent cations like Mg²⁺) optimal for the DNA polymerase's activity [1] [3].
The PCR Thermal Cycling Process
PCR amplification is achieved through repeated cycles of temperature-dependent steps in a thermal cycler. The following diagram illustrates this cyclical process:
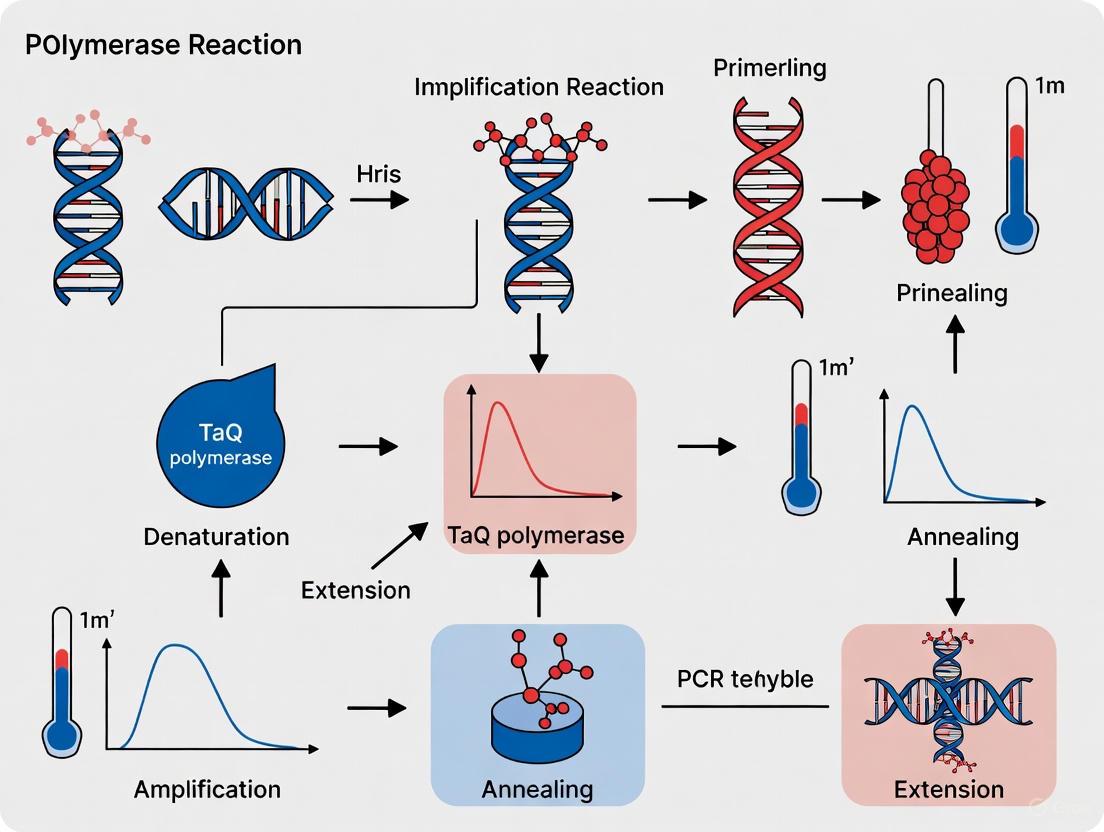
Each cycle consists of three fundamental steps [1] [3] [6]:
- Denaturation: The reaction mixture is heated to 94–98°C for 20–30 seconds. This high temperature breaks the hydrogen bonds between complementary bases, separating the double-stranded DNA into two single strands [1].
- Annealing: The temperature is lowered to 50–65°C for 20–40 seconds. This allows the forward and reverse primers to anneal (hybridize) to their complementary sequences on each of the single-stranded DNA templates. The annealing temperature is critical for specificity and is typically set 3–5°C below the primer's melting temperature (Tm) [1] [3].
- Extension/Elongation: The temperature is raised to 72°C (the optimal temperature for Taq polymerase), at which the DNA polymerase synthesizes a new DNA strand by adding dNTPs to the 3' end of each primer, elongating the strand in the 5'-to-3' direction. The extension time depends on the length of the target DNA [1] [6].
These three steps form one cycle. Since the newly synthesized DNA strands can themselves serve as templates in subsequent cycles, the target DNA is amplified exponentially. The number of DNA copies is theoretically 2^n, where n is the number of cycles. After 30 cycles, this can result in over a billion copies of the original target sequence [1].
Essential PCR Methodologies and Protocols
Standard PCR Protocol
A typical procedural protocol for setting up a PCR reaction is outlined below [8] [3]:
- Reagent Preparation: Assemble reagents on ice. For multiple reactions, prepare a master mix without primers and template to minimize pipetting errors and ensure consistency.
- Reaction Assembly: In a thin-walled PCR tube, combine the following components for a 50 µL reaction:
- 5 µL of 10X Taq buffer with MgCl₂
- 1 µL of dNTP mix (10 mM each)
- 2.5 µL of Forward Primer (10 µM stock)
- 2.5 µL of Reverse Primer (10 µM stock)
- 2 µL of Template DNA (10–500 ng)
- 0.2 µL of Taq DNA Polymerase (5 units/µL)
- 36.8 µL of Sterile dH₂O
- Thermal Cycling: Place the tubes in a thermal cycler and run the program based on the parameters in Section 3.2, typically for 25-35 cycles [8].
- Product Analysis: After amplification, analyze the PCR product (amplicon) by running 2-5 µL on an agarose gel via electrophoresis to verify the size and concentration against a DNA ladder [8] [3].
The Scientist's Toolkit: Key Research Reagent Solutions
The reliability of PCR results depends heavily on the quality and selection of reagents. The following table details essential materials and their functions in a standard PCR setup [1] [8] [3].
Table 2: Essential Reagents for PCR Experiments
| Reagent / Solution | Function / Role in PCR | Example Product Types |
|---|---|---|
| Thermostable DNA Polymerase | Enzyme that synthesizes new DNA strands; thermostability is crucial for cycle repetition. | Taq Polymerase (standard), Pfu Polymerase (high-fidelity), Phusion Plus DNA Polymerase (engineered) [7] [9] |
| PCR Buffer with MgCl₂ | Provides optimal chemical environment and co-factors (Mg²⁺) for polymerase activity. | 10X Concentrate, often supplied with enzyme [8] [3] |
| dNTP Mix | Nucleotide building blocks (dATP, dCTP, dGTP, dTTP) for new DNA strand synthesis. | Aqueous solution, typically 10 mM of each nucleotide [3] |
| Oligonucleotide Primers | Short, single-stranded DNA sequences that define the start and end of the target region to be amplified. | Custom-designed, sequence-specific primers [1] [3] |
| Nucleic Acid Purification Kits | To isolate highly pure DNA/RNA templates free of contaminants that inhibit PCR. | Monarch Nucleic Acid Purification Kits [9] |
| ReadyMix PCR Master Mix | Pre-mixed solution containing buffer, dNTPs, and polymerase for convenience and consistency. | Taq PCR ReadyMix [8] |
The Impact of PCR on Molecular Biology and Medicine
PCR's impact extends across nearly every field of life sciences. Its high sensitivity and specificity have made it a gold standard in clinical diagnostics, biomedical research, and forensic science [6].
Applications in Research and Diagnostics
- Infectious Disease Diagnosis: PCR allows for the rapid and precise detection of viral pathogens (e.g., HIV, SARS-CoV-2, Hepatitis), bacteria, fungi, and parasites. Its use was pivotal globally for diagnosing COVID-19 [6] [9]. Real-time PCR enables clinicians to provide targeted treatments quickly, potentially reducing hospital stays and curbing antibiotic resistance [6].
- Genetic Disorder and Cancer Testing: PCR facilitates the screening and identification of genetic mutations, both in utero and in adults, for conditions like sickle cell anemia [6] [2]. In oncology, it is used for early cancer detection, tumor profiling, and monitoring treatment efficacy [10] [9].
- Forensic Science and DNA Profiling: The ability to amplify minute amounts of DNA from crime scene samples (e.g., hair, skin cells) makes PCR indispensable for DNA fingerprinting and identity testing [1] [6].
- Research Applications: PCR is fundamental to gene cloning, mutagenesis, DNA sequencing, construction of phylogenetic trees, and analysis of gene expression [1] [6].
Advanced PCR Technologies
The core technique has spawned several advanced variants that have expanded its utility:
- Reverse Transcription PCR (RT-PCR): This method combines reverse transcription of RNA into complementary DNA (cDNA), followed by PCR amplification. It is essential for analyzing gene expression and for detecting RNA viruses like SARS-CoV-2 [4] [6].
- Real-Time PCR (qPCR): This technique allows for the quantitative, real-time monitoring of DNA amplification as it happens, using fluorescent dyes or probes. It eliminates the need for post-PCR gel electrophoresis and provides quantitative data on the initial amount of the target sequence [6].
- Digital PCR (dPCR): A more recent refinement, dPCR partitions a sample into thousands of individual reactions. This allows for absolute quantification of nucleic acids and is particularly useful for detecting rare mutations (e.g., in liquid biopsies for cancer) and for analyzing complex samples [9].
- Multiplex PCR: This enables the simultaneous amplification of multiple targets in a single reaction, using multiple primer sets. It is the basis for syndromic testing, which can test for numerous pathogens with similar symptoms in one assay (e.g., a respiratory panel for COVID-19, influenza, and RSV) [10].
PCR technology continues to evolve, with ongoing innovations promising to further transform diagnostic and research practices. Key future trends include [10] [5] [9]:
- Increased Multiplexing and Automation: More sophisticated and efficient multiplex tests will provide comprehensive diagnostic information from a single sample, while automation will lower labor barriers and increase testing capacity.
- Point-of-Care and Miniaturization: The development of portable, lab-on-chip PCR systems is increasing access to advanced diagnostics in remote or resource-limited settings, and may eventually enable home-based testing.
- Liquid Biopsies: The use of ultra-sensitive PCR and dPCR for detecting circulating tumor DNA in blood samples promises to revolutionize non-invasive cancer diagnosis, recurrence monitoring, and treatment guidance [10].
- Integration with Artificial Intelligence (AI): Combining PCR with AI-driven data analysis will enhance the accuracy and speed of result interpretation, enable predictive diagnostics, and improve global disease surveillance.
In conclusion, since its invention four decades ago, PCR has grown from a simple concept to an indispensable tool that underpins modern molecular biology. Its unique combination of simplicity, sensitivity, specificity, and versatility has secured its position as a foundational technology in research labs and clinical settings worldwide. As advancements in polymerase engineering, instrumentation, and data analysis continue, PCR is poised to maintain its critical role in scientific discovery and personalized medicine, ultimately improving patient outcomes and shaping the future of healthcare.
The Polymerase Chain Reaction (PCR) is a foundational technique in molecular biology, enabling the precise, enzymatic amplification of specific DNA sequences from minimal starting material. [6] [11] Since its introduction by Kary Mullis in the 1980s, PCR has become an indispensable tool across diverse fields, from basic genetic research and medical diagnostics to forensic science and drug development. [6] [11] [12] The power of PCR hinges on a thermally driven cyclic process, each iteration of which theoretically doubles the amount of the target DNA sequence. [13] This process consists of three core steps—denaturation, annealing, and extension—that are repeated 25-40 times to achieve exponential amplification. [6] [12] [13] This guide provides an in-depth technical deconstruction of these three steps, framing them within the broader context of PCR cycle research for the scientific professional.
The Biochemical Foundation of PCR
At its core, PCR is a repetitive biochemical reaction that requires a specific set of components to function effectively. The mastery of PCR lies not only in understanding the thermal steps but also in the precise preparation and optimization of the reaction mixture, often called the master mix. [13]
Table 1: Essential Components of a PCR Master Mix
| Component | Function | Typical Final Concentration/Amount |
|---|---|---|
| Template DNA | The DNA molecule containing the target sequence to be amplified. [14] | 10 ng–1 µg (genomic DNA); 1–100 ng (for highly sensitive assays). [6] [15] [14] |
| Forward & Reverse Primers | Short, single-stranded DNA sequences that define the start and end of the target region by binding to its flanks. [6] [13] | 0.1–1 µM each; 20–25 nucleotides in length. [6] [16] [15] |
| DNA Polymerase | Thermostable enzyme that synthesizes new DNA strands by adding nucleotides to the primers. [6] [11] | e.g., 2.5 U in a 50 µL reaction. [15] |
| dNTPs (dATP, dCTP, dGTP, dTTP) | The four nucleotide building blocks used by the DNA polymerase to synthesize new DNA. [13] [14] | 20–200 µM of each dNTP. [15] [14] |
| Reaction Buffer | Provides an optimal chemical environment (pH, salts) for the DNA polymerase. [13] [14] | 1X concentration. [15] |
| Divalent Cations (Mg²⁺) | Essential cofactor for DNA polymerase activity; stabilizes primer-template binding. [17] [15] [14] | 1.5–2.0 mM (requires optimization, typically 0.5-5 mM). [15] [18] [14] |
The selection of a thermostable DNA polymerase was a pivotal advancement for PCR automation. [11] While Taq polymerase from Thermus aquaticus is the most commonly used enzyme due to its thermostability, researchers must choose enzymes based on application needs. [11] [13] For example, high-fidelity polymerases like Pfu (from Pyrococcus furiosus) possess 3'→5' exonuclease (proofreading) activity, which corrects nucleotide misincorporation, resulting in lower error rates essential for cloning and sequencing. [17] [15] [18] In contrast, standard Taq polymerase is faster but lacks proofreading, making it suitable for routine genotyping or diagnostic detection. [18]
A Detailed Technical Analysis of the Three Core Steps
The PCR cycle consists of three fundamental steps governed by precise temperature changes. The following diagram illustrates the workflow and how the DNA strands are transformed at each stage.
Step 1: Denaturation
Purpose: The denaturation step completely separates the double-stranded DNA template into two single strands, providing the necessary single-stranded templates for the primers to bind. [6] [12] [14]
- Temperature: This step is performed at a high temperature, typically between 94°C and 98°C. [16] [12] [14] The exact temperature can be influenced by buffer composition; buffers with high salt concentrations may require temperatures at the higher end of this range. [16]
- Duration: The initial denaturation at the beginning of the PCR program is often longer (1–3 minutes) to ensure complex genomic DNA is fully denatured and any heat-labile contaminants are inactivated. [16] [14] In subsequent cycles, the denaturation step is shorter, typically 10–60 seconds. [16] [13] [14]
- Critical Considerations: Templates with high GC content (>65%) have stronger hydrogen bonding and are more prone to forming stable secondary structures. These templates may require a higher denaturation temperature or a longer incubation time to ensure complete strand separation. [16] [15] Incomplete denaturation is a common source of amplification failure for such templates.
Step 2: Annealing
Purpose: During annealing, the reaction temperature is lowered to allow the forward and reverse primers to bind (anneal) to their complementary sequences on the single-stranded template DNA, flanking the region of interest. [6] [12]
- Temperature: The annealing temperature is the most critical parameter for reaction specificity and must be meticulously optimized. It is primarily determined by the melting temperature (Tm) of the primers, which is the temperature at which 50% of the primer-DNA duplexes are dissociated. [16] [18] A common starting point is 3–5°C below the calculated Tm of the primers. [16] [14]
- Duration: This step is generally short, lasting 20–60 seconds. [12] [13] [14]
- Critical Considerations:
- Tm Calculation: The Tm can be estimated using the simple formula:
Tm = 4(G + C) + 2(A + T), where G, C, A, and T represent the number of each nucleotide in the primer. [16] [14] More accurate methods, such as the Nearest Neighbor algorithm, account for salt concentrations and sequence context. [16] - Specificity vs. Yield: If the annealing temperature is too low, primers may bind non-specifically to partially matched sequences, leading to off-target amplification. If it is too high, primer binding may be too inefficient, resulting in low yield or no product. [18] The use of a thermal cycler with a gradient function is highly recommended for empirical optimization. [16]
- Additives: Reagents like DMSO can lower the effective Tm of the DNA and may require a corresponding decrease in the annealing temperature. [16] [15]
- Tm Calculation: The Tm can be estimated using the simple formula:
Step 3: Extension
Purpose: In the extension step, the DNA polymerase synthesizes a new DNA strand by adding nucleotides to the 3' end of each annealed primer, creating a complementary copy of the DNA template. [6] [12]
- Temperature: The temperature is raised to the optimal working temperature for the DNA polymerase. For Taq polymerase, this is typically 72°C. [11] [12] [13]
- Duration: The extension time is directly proportional to the length of the amplicon and the synthesis rate of the polymerase. A common guideline is 1 minute per 1000 base pairs (1 kb) for Taq polymerase. [16] [13] Slower, high-fidelity enzymes may require 2 minutes per kb. [16] [13]
- Final Extension: After the last cycle, a single, longer final extension (5–15 minutes) is often performed to ensure any remaining single-stranded DNA is fully extended, which can improve yield and the efficiency of downstream applications like cloning. [16] [13]
Two-Step PCR: For some enzyme and primer combinations where the annealing temperature is within 3°C of the extension temperature, the annealing and extension steps can be combined into a single incubation, shortening the total cycle time. [16]
Table 2: Summary of Core PCR Step Parameters
| Step | Purpose | Temperature Range | Duration | Key Influencing Factors |
|---|---|---|---|---|
| Denaturation | Separate double-stranded DNA into single strands. [6] [12] | 94–98°C [16] [12] [14] | Initial: 1–3 min; Cyclic: 20–60 sec [16] [13] [14] | GC content, template complexity, buffer salts. [16] [15] |
| Annealing | Allow primers to bind flanking target sequences. [6] [12] | 45–65°C (Typically 5°C below primer Tm) [16] [12] [18] | 20–60 sec [12] [13] [14] | Primer Tm, specificity, concentration, Mg²⁺ level, additives (DMSO). [16] [17] [18] |
| Extension | Synthesize new DNA strand from primers. [6] [12] | 70–75°C (72°C for Taq) [16] [11] [12] | 1 min/kb (Taq); 2 min/kb (Pfu) [16] [13] | Amplicon length, polymerase type/speed, dNTP concentration. [16] [13] |
Optimization and Troubleshooting for Robust Assays
Achieving high specificity, yield, and fidelity often requires moving beyond standard protocols to optimize reaction conditions. This is particularly crucial for challenging templates (e.g., high GC%, long amplicons) or sensitive downstream applications.
Optimization of Critical Parameters
- Annealing Temperature: As discussed, this is the primary lever for controlling specificity. A gradient thermal cycler should be used to test a range of temperatures (e.g., ±5°C from the calculated Tm) to identify the temperature that produces the highest yield of the specific product with the least background. [16] [18]
- MgCl₂ Concentration: As an essential polymerase cofactor, Mg²⁺ concentration directly affects enzyme activity, fidelity, and primer annealing. [17] [18] [14] Its concentration must be titrated, typically between 1.0 mM and 5.0 mM, as it interacts with dNTPs, primers, and template DNA. [15] [18] [14] Low Mg²⁺ reduces yield, while high Mg²⁺ can promote non-specific amplification and increase error rates. [17] [18]
- Cycle Number: Typically, 25–35 cycles are sufficient for amplification. [16] [12] Too few cycles result in low yield, while too many (>45) can lead to accumulation of non-specific products and reagent depletion, leading to a plateau in amplification. [16] [17]
Addressing Common Challenges
- Non-Specific Bands/Smearing: This is often caused by low annealing temperature or high Mg²⁺ concentration. [17] [18] Remedies: Increase annealing temperature in 2–3°C increments, titrate Mg²⁺ to a lower concentration, reduce primer or enzyme concentration, or use a hot-start polymerase. [16] [15] [18] Hot-start enzymes remain inactive until the first denaturation step, preventing primer-dimer formation and mispriming during reaction setup. [15] [18]
- No/Low Yield: Can result from insufficient template, inefficient denaturation (especially for GC-rich DNA), degraded reagents, or inhibitor presence. [17] Remedies: Ensure template quality and quantity; increase initial denaturation time; add enhancers like DMSO (1-10%), betaine (1-2 M), or BSA (400 ng/µL) for GC-rich templates or samples with inhibitors. [16] [15] [18]
- Primer-Dimers: Short, artifactual products formed by primer self-annealing. Remedies: Improve primer design to avoid 3'-end complementarity, use higher annealing temperatures, try hot-start PCR, or lower primer concentration. [17] [15]
The Researcher's Toolkit: Essential Reagents for PCR Setup
Table 3: Key Research Reagent Solutions for PCR
| Reagent Category | Specific Examples | Function & Application Notes |
|---|---|---|
| Thermostable DNA Polymerases | Taq DNA Polymerase, Pfu Polymerase, Platinum II Taq Hot-Start DNA Polymerase [16] [11] [15] | Taq: Standard workhorse for routine PCR. Pfu: High-fidelity enzyme for cloning. Hot-Start: Reduces non-specific amplification by requiring heat activation. [15] [18] |
| PCR Enhancers/Additives | DMSO, Betaine, BSA, Formamide [16] [15] [18] | DMSO/Betaine: Aid in denaturing GC-rich templates and stabilizing PCR. BSA: Binds inhibitors in complex samples (e.g., blood, feces). [15] [18] |
| Optimization Kits | Mg²⁺ Titration Kits, dNTP Blends, Pre-mixed Buffers with Enhancers [17] | Systematically vary Mg²⁺ concentration or provide optimized buffer formulations for specific templates (e.g., GC-rich, long-range). |
| Specialized dNTPs | CleanAmp dNTPs [14] | Thermolabile dNTPs that function as an alternative to hot-start enzymes, activating only after the initial heating step to improve specificity. [14] |
Advanced PCR Applications in Drug Development and Research
The fundamental three-step cycle serves as the foundation for numerous advanced PCR applications that are critical in modern research and drug development pipelines.
- Quantitative PCR (qPCR) / Real-Time PCR: This method allows for the quantification of target DNA as it is amplified in real-time, rather than at an endpoint. [6] [13] It utilizes fluorescent dyes (e.g., SYBR Green) or sequence-specific probes (e.g., TaqMan) to monitor product accumulation each cycle. [6] [13] The cycle threshold (Cq) value is used for absolute or relative quantification and is instrumental in gene expression analysis, viral load testing, and biomarker validation. [6]
- Reverse Transcription PCR (RT-PCR) and RT-qPCR: This technique combines a reverse transcription step with PCR to amplify RNA targets, such as messenger RNA (mRNA) or viral RNA. [6] [13] It is the cornerstone of gene expression studies and was the gold standard for the detection of SARS-CoV-2 during the COVID-19 pandemic. [6]
- Digital Droplet PCR (ddPCR): A highly precise method for absolute quantification of nucleic acids without the need for a standard curve. [13] The sample is partitioned into thousands of nanoliter-sized droplets, and PCR is performed in each droplet independently. [13] It is exceptionally well-suited for detecting rare mutations, copy number variations, and validating NGS findings, making it powerful for oncology and liquid biopsy applications. [13]
The deconstruction of the PCR cycle into its three core steps—denaturation, annealing, and extension—reveals a process of elegant biochemical precision. Mastery of the temperature parameters, timing, and reagent interactions governing each step is fundamental to experimental success. For the research scientist, this knowledge forms the basis for sophisticated assay development, robust troubleshooting, and the adaptation of this foundational technique to the ever-evolving demands of modern biology and drug development. As PCR continues to be a cornerstone of genetic analysis, a deep understanding of its core mechanics ensures its effective application from the research bench to the clinical diagnostic pipeline.
Polymerase Chain Reaction (PCR) is a foundational technique in molecular biology that allows for the exponential amplification of specific DNA sequences in vitro [1]. Since its invention by Kary Mullis in 1983, PCR has become an indispensable tool across biomedical research, clinical diagnostics, and drug development [6] [11]. The power of PCR lies in its ability to generate millions to billions of copies of a target DNA sequence from a minimal starting amount, enabling detailed analysis of genetic material [1].
The reliability and efficiency of this process are fundamentally dependent on the precise function and optimal interaction of four core reagents: template DNA, primers, DNA polymerase, and deoxynucleoside triphosphates (dNTPs) [19] [20]. These components form the biochemical engine that drives the targeted replication of DNA. This technical guide provides an in-depth examination of these key reagents, detailing their specific roles, optimal characteristics, and the critical protocols for their use within the context of PCR cycle research. A thorough understanding of these elements is crucial for researchers and drug development professionals aiming to design, optimize, and troubleshoot robust PCR assays for applications ranging from genotyping to pathogen detection [6] [20].
The Core Reagents of PCR
The PCR process is catalyzed by a DNA polymerase enzyme and requires a DNA template containing the target sequence, two primers that flank the target, and dNTPs as the building blocks for new DNA strands [1] [20]. The reaction occurs in a buffer that provides a suitable chemical environment, typically including magnesium ions (Mg²⁺) as an essential cofactor for the DNA polymerase [21] [19]. The following sections will explore the first four of these critical components in detail.
Template DNA
Template DNA serves as the blueprint for amplification and can originate from a variety of sources, including genomic DNA (gDNA), complementary DNA (cDNA), plasmid DNA, or previously amplified PCR products [21] [20]. The success of PCR is highly dependent on the quantity, quality, and complexity of the template DNA.
- Source and Complexity: The optimal amount of input DNA varies significantly with its complexity. For instance, while 0.1–1 ng of plasmid DNA is often sufficient, 5–50 ng of the more complex genomic DNA may be required for a standard 50 µL reaction [21] [19]. The required starting amount can also be influenced by the sensitivity of the DNA polymerase used.
- Purity and Integrity: Template DNA must be sufficiently pure to avoid interference from common contaminants such as proteins, RNA, or chemicals. Impurities like ionic detergents, heparin, hemoglobin, phenol, or EDTA can inhibit DNA polymerase activity [6] [19]. Traditional DNA extraction methods often use SDS and protease K to lyse cells and digest proteins, followed by purification via organic extraction (e.g., phenol-chloroform) and ethanol precipitation [19]. For clinical speed, simpler lysis protocols that rapidly release target genes without full nucleic acid extraction are also employed.
- Theoretical vs. Practical Sensitivity: Under ideal conditions, a single copy of DNA is theoretically sufficient for amplification. In practice, however, the efficiency of amplifying low template amounts is highly dependent on reaction optimization and the sensitivity of the DNA polymerase [21].
Table 1: Guidelines for Template DNA Input in a 50 µL PCR Reaction
| Template Type | Recommended Amount | Notes |
|---|---|---|
| Plasmid DNA | 0.1 - 1 ng | Less complex, lower input required. |
| Genomic DNA (gDNA) | 5 - 50 ng | More complex, higher input often needed. |
| cDNA | 1 - 10 ng | Dependent on reverse transcription efficiency. |
| PCR Amplicons | < 1 ng (diluted) | Re-amplification; purified product is preferred. |
Primers
PCR primers are short, single-stranded DNA oligonucleotides, typically 15–30 nucleotides in length, that are designed to be complementary to the sequences flanking the target region [21] [6]. They provide the free 3'-hydroxyl group necessary for DNA polymerase to initiate DNA synthesis [1].
- Design Principles: Careful primer design is paramount for successful and specific amplification. Key design parameters include [21]:
- Melting Temperature (Tm): Ideally between 55–70°C, with the Tm of the forward and reverse primers within 5°C of each other.
- GC Content: Should be 40–60%, with a uniform distribution of G and C bases.
- 3' End Stability: Should end with a C or G base (GC clamp) to promote efficient priming but avoid runs of more than three G or C bases, which can promote nonspecific binding.
- Specificity: Sequences must be unique to the target to avoid binding to unrelated sequences. Direct repeats and self-complementarity that can lead to secondary structures or primer-dimer formation must be avoided.
- Concentration: In the reaction, primers are typically used in the range of 0.1–1 µM [21]. Higher concentrations can increase the risk of mispriming and nonspecific amplification, while lower concentrations may result in reduced yield or amplification failure.
Table 2: Critical Parameters for PCR Primer Design
| Parameter | Recommended Value | Rationale |
|---|---|---|
| Length | 15 - 30 nucleotides | Provides specificity and efficient binding. |
| Melting Temperature (Tm) | 55 - 70°C (within 5°C for a pair) | Ensures both primers anneal efficiently at the same temperature. |
| GC Content | 40 - 60% | Balances stable binding and appropriate Tm. |
| 3' End | One G or C; avoid >3 G/C in a row | Promotes "anchoring" while minimizing nonspecific extension. |
DNA Polymerase
DNA polymerase is the enzyme responsible for synthesizing new DNA strands by adding nucleotides to the 3' end of the annealed primers [11]. The use of a thermostable DNA polymerase was a revolutionary advancement that enabled the automation of PCR.
- Taq DNA Polymerase: Isolated from the thermophilic bacterium Thermus aquaticus, Taq polymerase is the most widely used PCR enzyme [1] [11]. It has a half-life of approximately 40 minutes at 95°C, allowing it to withstand the repeated high-temperature denaturation steps [21]. Its optimal extension temperature is 72–80°C, and it synthesizes DNA at a rate of about 60 bases per second [21] [1]. A key limitation of Taq is its lack of 3'→5' exonuclease (proofreading) activity, resulting in a relatively high error rate (approximately 1.8 x 10⁻⁴ errors per base pair) [20].
- Enzyme Selection and Engineering: For applications requiring high fidelity, such as cloning, proofreading polymerases like Pfu or Q5 are preferred, as they can reduce error rates by 1-2 orders of magnitude [20]. Furthermore, engineered polymerases (e.g., KAPA2G) offer improved characteristics such as faster synthesis rates (up to 150 nucleotides per second) and higher processivity, which is beneficial for amplifying long or complex templates [20].
- Concentration: A typical 50 µL reaction contains 1–2 units of DNA polymerase [21]. While increasing the enzyme amount can sometimes improve yields with difficult templates, it can also lead to the accumulation of nonspecific products.
Table 3: Comparison of Common DNA Polymerases for PCR
| Polymerase | Source | Proofreading? | Error Rate (approx.) | Typical Application |
|---|---|---|---|---|
| Taq | Thermus aquaticus | No | 1.8 x 10⁻⁴ | Routine PCR, genotyping |
| Pfu | Pyrococcus furiosus | Yes (3'→5') | ~1.3 x 10⁻⁶ | High-fidelity cloning |
| Q5 | Engineered | Yes (3'→5') | ~2.8 x 10⁻⁷ | Ultra-high-fidelity applications |
| KAPA2G | Engineered | Varies | Varies | Fast PCR, long amplicons |
Deoxynucleoside Triphosphates (dNTPs)
Deoxynucleoside triphosphates (dNTPs: dATP, dCTP, dGTP, and dTTP) are the essential building blocks from which DNA polymerase synthesizes new strands [1] [20].
- Concentration and Ratio: The four dNTPs are typically added to the PCR reaction in equimolar amounts at a final concentration of 0.2 mM each [21] [19]. This concentration is generally sufficient to synthesize about 2.6 µg of DNA in a 100 µL reaction [19].
- Effects of Imbalance: Lower dNTP concentrations can help reduce nonspecific amplification and may improve fidelity, especially for non-proofreading enzymes, by lowering the rate of misincorporation [21] [19]. Excessively high dNTP concentrations can be inhibitory. Furthermore, dNTPs chelate magnesium ions, so their concentration must be balanced with that of Mg²⁺ in the reaction buffer [21].
- Modified dNTPs: In some applications, standard dNTPs are partially or fully replaced with modified versions. For example, dUTP can substitute for dTTP to facilitate uracil-DNA glycosylase (UDG)-based carryover contamination control [21]. Other modified dNTPs (e.g., biotin-11-dUTP, fluorescein-12-dUTP) are used to incorporate labels for detection or capture [21]. It is critical to ensure that the DNA polymerase used can efficiently incorporate the chosen modified nucleotides.
The PCR Cycle: An Integrated Workflow
The PCR process is a cyclic series of temperature changes designed to repeatedly separate DNA strands and synthesize new copies. The function of the core reagents is integrated into this three-step cycle: denaturation, annealing, and extension [6] [1] [20].
- Denaturation: The reaction mixture is heated to 94–98°C for 20–30 seconds, causing the double-stranded DNA template to separate into single strands by breaking the hydrogen bonds between bases [1] [20].
- Annealing: The temperature is lowered to 50–65°C for 20–40 seconds, allowing the forward and reverse primers to bind (anneal) to their complementary sequences on the single-stranded templates [1]. The optimal temperature is determined by the primers' Tm.
- Extension: The temperature is raised to the optimal temperature for DNA synthesis, typically 72°C for Taq polymerase, for a duration that depends on the length of the amplicon (roughly 1 minute per kilobase). During this step, DNA polymerase binds to the primer-template hybrid and catalyzes the addition of dNTPs to the 3' end of the primer, synthesizing a new DNA strand [1] [20].
These three steps constitute one cycle. In theory, the number of DNA copies doubles with each cycle, leading to exponential amplification. After 25–35 cycles, this can result in over a billion copies of the target sequence [20].
Essential Protocols and Methodologies
Standard PCR Protocol
The following is a detailed methodology for setting up a standard PCR reaction using Taq DNA polymerase, which can serve as a starting point for researchers [22].
Materials:
- Template DNA (see Table 1 for guidelines)
- Forward and reverse primers (resuspended to a stock concentration, e.g., 100 µM)
- Taq DNA polymerase (e.g., 5 units/µL)
- 10x Reaction Buffer (often supplied with the enzyme, typically containing MgCl₂)
- dNTP mix (e.g., 10 mM each)
- Nuclease-free water
- Thermal cycler
Procedure:
- Prepare Reaction Mix: In a sterile PCR tube, assemble the following components on ice in the order listed. For multiple reactions, prepare a master mix to minimize pipetting error and ensure consistency.
Thermal Cycling: Place the tubes in a thermal cycler and run the following program:
- Initial Denaturation: 94–95°C for 2–5 minutes (activates hot-start enzymes, ensures complete denaturation of complex templates).
- Amplification (25–35 cycles):
- Denaturation: 94–95°C for 15–30 seconds.
- Annealing: Primer-specific Tm for 15–30 seconds.
- Extension: 72°C for 1 minute per kilobase of amplicon length.
- Final Extension: 72°C for 5–10 minutes (ensures all amplicons are fully extended).
- Hold: 4–10°C indefinitely.
Product Analysis: Analyze the PCR products by agarose gel electrophoresis. Load 5–10 µL of the reaction alongside a DNA ladder for size verification. Successful amplification should yield a single, discrete band of the expected size upon ethidium bromide or other DNA stain visualization under UV light [22] [1].
Optimization Strategies for Core Reagents
PCR often requires optimization, especially with novel primer sets or challenging templates. A systematic approach to optimizing the core reagents is outlined below.
- Template Quality and Quantity: If amplification fails, verify DNA integrity and purity. Re-purify the template if necessary. Test a range of concentrations (e.g., 10 ng to 200 ng of gDNA) to find the optimal input [21].
- Primer Annealing Temperature: The most common optimization parameter. Perform a temperature gradient PCR across a range (e.g., 50–68°C) to identify the temperature that yields the strongest specific product with the least background [22].
- Mg²⁺ Concentration: As Mg²⁺ is a critical cofactor and its availability is affected by dNTP and EDTA concentrations, titration is often beneficial. Test MgCl₂ concentrations in 0.5 mM to 2.0 mM increments around the standard 1.5 mM [22].
- Cycle Number: For low-abundance targets, increasing the cycle number to 35–40 may be necessary. Be aware that higher cycle numbers can increase background noise.
The Scientist's Toolkit: Research Reagent Solutions
Table 5: Essential Reagents and Materials for PCR Experiments
| Item | Function/Description | Key Considerations |
|---|---|---|
| Thermostable DNA Polymerase | Enzyme that synthesizes new DNA strands. | Choose based on fidelity, speed, and template requirements (e.g., Taq for routine use, Pfu for cloning) [20]. |
| PCR Primers | Custom oligonucleotides that define the target sequence. | Must be designed for specificity and appropriate Tm; HPLC or other purification may be needed for long/modified primers [21]. |
| dNTP Mix | Balanced solution of the four nucleotides (dATP, dCTP, dGTP, dTTP). | Use equimolar, high-quality solutions to prevent misincorporation; aliquot to avoid freeze-thaw cycles [19]. |
| PCR Buffer with MgCl₂ | Provides optimal chemical environment and Mg²⁺ cofactor. | Mg²⁺ concentration is often a key variable for optimization [21] [1]. |
| Nuclease-Free Water | Solvent for the reaction. | Essential to avoid degradation of reagents and templates by environmental nucleases. |
| Thermal Cycler | Instrument that automates the temperature cycling process. | Critical for consistent and reproducible results [11]. |
| Agarose Gel Electrophoresis System | Standard method for post-PCR visualization and quality control. | Used with DNA-binding dyes (e.g., ethidium bromide, SYBR Safe) and a UV transilluminator [22] [1]. |
The exquisite specificity and exponential power of the Polymerase Chain Reaction are wholly dependent on the precise interplay of its core reagents: the template DNA, primers, DNA polymerase, and dNTPs. A deep understanding of the role, optimal characteristics, and potential pitfalls associated with each component is not merely academic—it is a practical necessity for researchers and drug development professionals. This knowledge enables the rational design, efficient optimization, and effective troubleshooting of PCR assays, which are fundamental to advancements in genomics, molecular diagnostics, and therapeutic development. As PCR technologies continue to evolve, with growing integration into automated and point-of-care systems, the foundational principles governing these key reagents remain the bedrock upon which reliable and impactful scientific research is built.
The polymerase chain reaction (PCR) stands as one of the most transformative molecular biology techniques developed in the 20th century, enabling the targeted amplification of specific DNA sequences from minimal starting material. This process, fundamentally reliant on precise temperature cycling, would be impractical without automated instrumentation. Thermal cyclers provide the critical automation platform that has made PCR accessible, reproducible, and efficient across diverse scientific applications from basic research to clinical diagnostics and drug development. By precisely controlling the temperature transitions required for DNA denaturation, primer annealing, and enzymatic extension, these instruments have evolved from simple heating and cooling devices to sophisticated systems integrating advanced temperature control, real-time monitoring, and high-throughput capabilities. This technical guide examines the operational principles, technological evolution, and experimental considerations of thermal cyclers within the broader context of PCR cycle research, providing researchers with comprehensive insights into how instrumentation optimizes and automates this fundamental biological process.
Historical Development of Thermal Cyclers
The evolution of thermal cyclers represents a remarkable journey from manual operation to fully automated precision instrumentation. In the earliest days of PCR during the 1980s, DNA amplification was a labor-intensive process requiring researchers to manually transfer samples between three different water baths set at specific temperatures for denaturation, annealing, and extension [23]. This method was not only time-consuming but also introduced significant variability, as the timing of transfers depended heavily on technician consistency. The process was further complicated by the need to add fresh DNA polymerase after each cycle, as thermally stable enzymes were not yet available [23].
The first major innovation in automation came with the development of the "Mr. Cycle," which utilized a pipetting station and water baths to address the need for automated enzyme addition after each cycle [23]. This was quickly followed in 1987 by the introduction of the first commercially available thermal cycler, the Perkin Elmer Cetus TC1 DNA Thermal Cycler, which featured a metal heating block with programmable heating and cooling capabilities [23]. This revolutionary instrument eliminated the need for manual sample transfer and represented a significant step toward standardization of the PCR process.
A critical breakthrough came in 1988 with the first reported use of a thermostable DNA polymerase (Taq polymerase) in the TC1 thermal cycler [23]. This development eliminated the need to add fresh enzyme after each cycle, truly enabling full automation of the PCR process and setting the stage for widespread adoption of PCR across scientific disciplines. The integration of Peltier technology in subsequent instruments replaced bulky compressor-based cooling systems with solid-state thermoelectric devices that could both heat and cool by reversing electrical current direction, enabling more compact instrument designs and faster temperature transitions [23].
The introduction of the heated lid represented another significant advancement, eliminating the need for mineral oil to prevent sample evaporation and enabling more convenient sample handling and recovery [23]. Modern thermal cyclers have continued this trajectory of innovation, incorporating gradient temperature control for protocol optimization, advanced algorithms for precise temperature control, and connectivity features for remote monitoring and operation [23].
Fundamental PCR Principles and the Role of Thermal Cycling
Core Principles of PCR
Polymerase chain reaction is a laboratory technique used to make multiple copies of a specific DNA segment through in vitro enzymatic amplification. The process applies the DNA replication principle naturally occurring in cells, but achieves exponential amplification through repeated temperature cycles rather than biological replication machinery. Each PCR cycle theoretically doubles the amount of the target DNA sequence, resulting in exponential accumulation of the specific amplicon [24]. The specificity of amplification is determined by synthetic oligonucleotide primers that flank the target region and provide initiation sites for DNA synthesis [25].
The reaction components required for PCR include a DNA template containing the target sequence to be amplified, two types of primers (short single-stranded DNA molecules complementary to the 3' ends of the target sequence), a thermostable DNA polymerase that catalyzes DNA synthesis, deoxynucleoside triphosphates (dNTPs) that serve as the building blocks for new DNA strands, and a buffer system containing magnesium ions which are essential cofactors for polymerase activity [24]. The precise orchestration of temperature transitions to facilitate the distinct steps of the PCR process is where the thermal cycler provides its fundamental value.
The Three Steps of PCR
The PCR process consists of three fundamental steps that are repeated for 20-40 cycles:
Denaturation: The reaction mixture is heated to 93-98°C for 20-30 seconds, causing the double-stranded DNA to separate into single strands by breaking the hydrogen bonds between complementary bases [25] [24]. This provides single-stranded templates for primer binding. An initial prolonged denaturation step of 2-5 minutes is often included before cycling begins to ensure complete separation of complex DNA secondary structures [24].
Annealing: The temperature is lowered to 45-60°C for 20-40 seconds, allowing the primers to bind to their complementary sequences on the single-stranded DNA templates [25] [24]. The optimal annealing temperature depends on the melting temperature (Tm) of the primer-template duplex and is typically set 5°C below the calculated Tm [24]. This step is critical for determining reaction specificity.
Extension: The temperature is raised to 68-72°C for a period dependent on the length of the amplicon (typically 15-60 seconds per kilobase), during which the DNA polymerase synthesizes new DNA strands by adding dNTPs to the 3' end of the primers [25] [24]. Thermostable polymerases from thermophilic bacteria, such as Taq polymerase from Thermus aquaticus, are essential for withstanding the repeated high temperatures, particularly during the denaturation step [25].
Table 1: Standard PCR Cycle Parameters
| Cycle Step | Temperature Range | Time Duration | Primary Function |
|---|---|---|---|
| Initial Denaturation | 93-98°C | 2-5 minutes | Complete separation of double-stranded DNA |
| Denaturation | 93-98°C | 20-30 seconds | Separation of DNA strands after synthesis |
| Annealing | 45-60°C | 20-40 seconds | Primer binding to complementary sequences |
| Extension | 68-72°C | 15-60 sec/kb | DNA synthesis by polymerase enzyme |
| Final Extension | 68-72°C | 5-10 minutes | Complete synthesis of all amplicons |
The following diagram illustrates the iterative nature of the PCR process and how temperature cycling drives the exponential amplification of the target DNA sequence:
Thermal Cycler Technology and Components
Heating and Cooling Systems
Modern thermal cyclers employ sophisticated Peltier-based thermoelectric modules for precise temperature control [23]. These solid-state devices can both heat and cool by reversing the direction of electrical current, eliminating the need for separate heating elements and compressor-based cooling systems [23]. Advanced Peltier systems can achieve rapid heating and cooling rates of up to 6°C per second, significantly reducing overall PCR run times [23]. The transition from water baths to Peltier technology represented a fundamental advancement that enabled the development of compact, reliable thermal cycling instruments.
The sample block containing the reaction tubes is typically constructed from high thermal conductivity materials such as silver or aluminum to ensure uniform temperature distribution across all sample positions [23]. Advanced instruments incorporate multiple temperature sensors throughout the block, with feedback algorithms continuously adjusting power to the Peltier devices to maintain precise temperature control. Some systems additionally include sample temperature monitoring using specialized capillaries or sensors that measure the actual temperature within sample tubes, providing even greater accuracy than block-based control alone [23].
Sample Protection and Evaporation Prevention
A critical component of modern thermal cyclers is the heated lid that maintains temperatures between 100-110°C, effectively preventing condensation and evaporation of reaction mixtures during cycling [23]. Prior to this innovation, researchers had to overlay reaction mixtures with mineral oil to prevent evaporation, which complicated sample handling and recovery while reducing the volume available for downstream applications [23]. The implementation of heated lids has significantly simplified workflow and improved experimental consistency.
Control Systems and User Interface
Modern thermal cyclers feature intuitive programming interfaces with touchscreen displays that simplify method development and protocol storage [23]. Advanced instruments offer connectivity options including Wi-Fi, Ethernet, and cloud integration, enabling remote monitoring and control of instruments from mobile devices or computers [23]. This connectivity facilitates protocol sharing across laboratories and provides researchers with greater flexibility in managing their experiments. Sophisticated control algorithms use complex mathematical models to precisely regulate block temperature, ensuring consistent sample temperature profiles across the entire block and between multiple runs [23].
Advanced Thermal Cycler Functions
Gradient PCR
Gradient temperature capability allows researchers to simultaneously test different annealing temperatures across a single sample block, dramatically accelerating PCR optimization [23]. Traditional gradient systems create a temperature gradient across a single metal block by controlling heating at opposite ends [23]. More advanced "better-than-gradient" technologies utilize adiabatically isolated individual thermal modules that provide even more precise temperature control and faster optimization [26]. This functionality is particularly valuable when working with new primer sets or when amplifying templates with complex secondary structures that require precise temperature optimization.
Rapid Cycling Capabilities
"Fast" or "rapid" PCR protocols can reduce overall amplification time from nearly two hours to less than 40 minutes through a combination of instrument and reagent innovations [23]. Key technological advancements enabling rapid PCR include:
- Enhanced Peltier elements with faster heating and cooling rates
- Advanced control algorithms for more accurate temperature prediction and control
- Reduced reaction volumes that facilitate faster thermal transfer
- Specialized polymerases with faster binding and extension kinetics
These innovations, combined with ultra-thin-walled PCR tubes and plates, allow for significantly reduced dwell times at each temperature step while maintaining high amplification efficiency and specificity [23].
Verifiable Temperature Uniformity
Advanced thermal cyclers incorporate verification systems to ensure temperature uniformity across the entire sample block, a critical factor for reproducible results in high-throughput applications where samples may be distributed across multiple plates. This is particularly important in diagnostic and regulatory applications where documentation of performance specifications is required. Some instruments include built-in temperature verification features or support external calibration tools that map the thermal profile of the block under various cycling conditions.
Table 2: Advanced Thermal Cycler Capabilities and Applications
| Feature | Technology | Primary Benefit | Typical Applications |
|---|---|---|---|
| Gradient PCR | Variable temperature across block | Simultaneous optimization of annealing temperatures | Primer validation, protocol development |
| Rapid Cycling | Enhanced Peltier elements, advanced algorithms | Reduced run times, higher throughput | Clinical diagnostics, high-throughput screening |
| Multi-block Operation | Independent thermal modules | Parallel processing of different protocols | Multiple users, different assay formats |
| Verifiable Temperature Uniformity | Integrated calibration, mapping | Documentation for regulated environments | Clinical diagnostics, GMP/GLP environments |
| Remote Monitoring | Cloud connectivity, mobile apps | Flexible experiment management | Core facilities, multi-instrument labs |
Quantitative PCR and Instrument Detection Systems
Real-time PCR Principles
Real-time PCR or quantitative PCR (qPCR) represents a significant advancement over conventional PCR by enabling monitoring of amplification as it occurs, rather than just endpoint detection [27]. This is achieved through the incorporation of fluorescent reporter systems that track DNA accumulation during each cycle of the PCR process [27]. The key parameter in qPCR analysis is the Ct (threshold cycle) value, which represents the PCR cycle number at which the fluorescence signal exceeds a defined threshold above background [27] [28]. The Ct value is inversely proportional to the starting quantity of the target nucleic acid, with earlier fluorescence detection indicating higher initial target concentrations [27].
Detection Chemistry
Two primary fluorescence detection methods are commonly used in real-time PCR systems:
TaqMan Probes: These hydrolysis probes consist of oligonucleotides dual-labeled with a fluorescent reporter dye at the 5' end and a quencher molecule at the 3' end [27]. When intact, the proximity of the quencher suppresses reporter fluorescence through FRET (Fluorescence Resonance Energy Transfer). During PCR amplification, the 5' nuclease activity of Taq polymerase cleaves the probe when it is bound to its complementary sequence, separating the reporter from the quencher and generating a fluorescent signal that increases with each amplification cycle [27]. TaqMan probes offer high specificity because fluorescence generation requires specific probe hybridization and hydrolysis.
SYBR Green I Dye: This DNA-binding dye fluoresces strongly when intercalated into double-stranded DNA, with signal intensity proportional to the total dsDNA concentration in the reaction [27]. While more economical and flexible than sequence-specific probes, SYBR Green I will detect any double-stranded DNA, including non-specific amplification products and primer-dimers, necessitating careful reaction optimization and subsequent melt curve analysis to verify amplification specificity [27].
The following diagram illustrates the workflow of a real-time PCR experiment, from sample preparation through data analysis:
Quantitative Analysis Methods
qPCR data can be analyzed using either absolute or relative quantification approaches:
Absolute Quantification: Determines the exact copy number or concentration of the target sequence in unknown samples by comparison to a standard curve generated from samples with known concentrations [27] [28]. This method requires precise standards of known concentration and is commonly used in viral load testing and microbiological quantification.
Relative Quantification: Measures changes in target sequence quantity relative to a reference sample, such as comparing gene expression between treated and untreated cells [27] [28]. This approach typically uses endogenous control genes (housekeeping genes) for normalization and can be performed using the comparative Ct (ΔΔCt) method or standard curve method [27].
Experimental Protocols and Methodologies
Standard PCR Protocol
A robust standard PCR protocol includes the following components and steps:
Research Reagent Solutions and Essential Materials:
- Template DNA: 10 ng-1 μg genomic DNA or 1-5 μL cDNA in 20-100 μL reaction [24]
- Primers: 0.1-1.0 μM each, 15-25 nucleotides with 40-60% GC content [24]
- DNA Polymerase: 0.5-2.5 units per reaction, selected based on application requirements [24]
- dNTPs: 200 μM each dATP, dCTP, dGTP, dTTP [24]
- Reaction Buffer: Typically 10-50 mM Tris-HCl, pH 8.3-8.8 [24]
- Magnesium Chloride: 1.5-2.5 mM final concentration (optimization required) [24]
Thermal Cycling Parameters:
- Initial Denaturation: 94-98°C for 2-5 minutes
- 25-35 cycles of:
- Denaturation: 94-98°C for 20-30 seconds
- Annealing: 45-65°C (primer-specific) for 20-40 seconds
- Extension: 68-72°C for 15-60 seconds per kilobase
- Final Extension: 68-72°C for 5-10 minutes
- Hold: 4-10°C indefinitely [25] [24]
Rapid PCR Protocol
For applications requiring faster results, a rapid PCR protocol can be implemented:
Modified Reagent Solutions:
- Specialized Polymerase Blends: Engineered for fast binding and extension
- Enhanced Buffer Systems: Formulated for rapid kinetics
- Reduced Reaction Volumes: 10-20 μL to improve thermal transfer
Thermal Cycling Parameters:
- Initial Denaturation: 98°C for 30 seconds
- 35-40 cycles of:
- Denaturation: 98°C for 5-10 seconds
- Annealing/Extension: 65-72°C for 10-30 seconds total
- Hold: 4-10°C [23]
qPCR Protocol
For quantitative real-time PCR applications:
Research Reagent Solutions:
- Fluorescence Detection System: TaqMan probes or SYBR Green I dye [27]
- Reference Dye: Passive reference such as ROX for signal normalization [27]
- Optimized Master Mix: Contains polymerase, dNTPs, buffer, and magnesium
Thermal Cycling Parameters with Detection:
- Initial Denaturation: 95°C for 2-10 minutes
- 40-50 cycles of:
- Denaturation: 95°C for 10-15 seconds
- Annealing/Extension: 60°C for 30-60 seconds with fluorescence acquisition
- Melt Curve Analysis (for SYBR Green): 65-95°C with continuous fluorescence monitoring [27]
Table 3: Troubleshooting Common PCR Issues
| Problem | Potential Causes | Solutions |
|---|---|---|
| No Amplification | Enzyme inactivation, insufficient magnesium, incorrect annealing temperature | Verify reagent quality, optimize MgCl₂ concentration, use gradient PCR |
| Non-specific Bands | Low annealing temperature, excessive magnesium, enzyme concentration | Increase annealing temperature, reduce MgCl₂, use hot-start polymerase |
| Primer-dimer Formation | Excessive primer concentration, low template concentration | Optimize primer concentration, increase template amount, redesign primers |
| Poor Quantification in qPCR | Inefficient amplification, suboptimal probe design | Check amplification efficiency, validate probe sequences |
Thermal cyclers have transformed PCR from a labor-intensive manual technique to an automated, precise, and reproducible process that serves as the foundation for countless applications in molecular biology, clinical diagnostics, and drug development. The evolution of these instruments—from simple heating blocks to sophisticated systems with precise temperature control, gradient capabilities, and real-time monitoring—has continuously expanded the utility and accessibility of PCR technology. As instrumentation continues to advance with features such as cloud connectivity, nanoliter dispensing, and integrated sample preparation, thermal cyclers will undoubtedly remain essential tools for scientific discovery. Understanding the operational principles, technological capabilities, and methodological considerations of these instruments empowers researchers to fully leverage their potential in advancing genomic research and diagnostic applications.
Within the broader context of polymerase chain reaction (PCR) research, the ability to visualize and interpret results is a critical final step. Endpoint analysis, typically performed using gel electrophoresis, is the primary method for confirming the success and specificity of a PCR amplification after the thermal cycling process is complete [29] [30]. This technique provides a direct, visual answer to key experimental questions: Was the target DNA sequence successfully amplified? Is the amplified product the expected size? And how specific was the amplification reaction?
Unlike quantitative PCR (qPCR), which monitors amplification in real-time, endpoint PCR is a qualitative or semi-quantitative assay that measures the final accumulated product after all PCR cycles are completed [30]. Its enduring popularity in research and diagnostic labs stems from its straightforward nature, relatively low cost, and the rich information it provides. By separating DNA fragments based on size, gel electrophoresis transforms the contents of a PCR tube into a visible pattern of bands, allowing researchers to quickly assess the outcome of their experiment and make informed decisions on subsequent steps, such as cloning, sequencing, or further purification [31] [29].
The Principles of Gel Electrophoresis
Gel electrophoresis is a molecular biology technique that exploits the inherent negative charge of DNA molecules to separate them by size within a porous agarose matrix [32] [33]. When an electric field is applied across the gel, the negatively charged DNA migrates toward the positively charged anode (red terminal). The agarose gel acts as a molecular sieve; smaller DNA fragments move more quickly through the pores of the gel, while larger fragments are impeded and travel more slowly [34] [33]. Over time, this results in the separation of DNA fragments into distinct bands, each composed of molecules of a specific length.
To visualize the DNA post-separation, a fluorescent dye such as ethidium bromide or a safer alternative like GelGreen is used. These dyes intercalate between the DNA base pairs and fluoresce under ultraviolet light, revealing the position of the DNA bands [29] [32]. The distance a DNA fragment travels is inversely proportional to the logarithm of its molecular weight. To determine the size of an unknown PCR product, its migration distance is compared to that of a DNA ladder, a standard mixture of DNA fragments of known sizes that is run alongside the samples on the same gel [34] [29].
Workflow for Gel Electrophoresis Analysis
The following diagram illustrates the standard workflow for analyzing a PCR product via gel electrophoresis, from sample preparation to final interpretation:
Experimental Protocol for Agarose Gel Electrophoresis
Materials and Reagent Setup
The following table details essential reagents and materials required for successful gel electrophoresis analysis:
Table 1: Key Research Reagent Solutions for Gel Electrophoresis
| Reagent/Material | Function | Typical Specification/Concentration |
|---|---|---|
| Agarose | Forms the porous gel matrix that separates DNA fragments by size [33]. | 0.8% - 2.0% (w/v) in buffer; concentration depends on desired resolution for target amplicon size. |
| TBE or TAE Buffer | Provides the ions necessary to carry electrical current and maintains stable pH during the run [34]. | 0.5x to 1x working concentration. |
| DNA Stain (e.g., Ethidium Bromide, GelGreen) | Intercalates into DNA and fluoresces under UV light for visualization [29] [34]. | According to manufacturer's instructions; added to gel or used for post-run staining. |
| DNA Ladder | A set of DNA fragments of known sizes used to estimate the size of unknown PCR amplicons [34]. | A 100 bp ladder is common for PCR; provides fragments from 100 bp to 1000+ bp. |
| Loading Dye | Mixed with sample to add density for well loading and contains a tracking dye to monitor migration progress [32]. | Contains glycerol and dyes (e.g., bromophenol blue). |
Step-by-Step Methodology
- Gel Casting: Prepare an agarose gel by dissolving the appropriate amount of agarose powder in electrophoresis buffer (e.g., TAE or TBE) by heating. Once the solution has cooled sufficiently, add the fluorescent DNA stain if it is an ingredient of the gel, then pour it into a casting tray with a well comb in place. Allow the gel to solidify completely [34] [33].
- Sample Preparation: Mix a small aliquot of your PCR reaction (typically 5-10 µL) with a loading dye containing a dense agent like glycerol and a tracking dye [32].
- Gel Loading: Once solidified, place the gel in an electrophoresis chamber filled with the same buffer used to cast the gel. Carefully remove the comb. Load the prepared DNA ladder into the first well. Load your prepared samples into subsequent wells [34].
- Electrophoresis Run: Connect the chamber to a power supply and run the gel at a constant voltage (e.g., 80-120 V). The run should continue until the tracking dye has migrated a sufficient distance through the gel to achieve good separation [34].
- Visualization and Documentation: After the run, transfer the gel to a gel imaging system or a UV transilluminator. If using a post-staining method, stain the gel first. Illuminate with the appropriate light source (e.g., UV) to excite the fluorescent dye bound to the DNA. Capture a clear digital image of the gel for permanent record-keeping and analysis [34].
Interpreting Electrophoresis Results
Assessing a Successful PCR Amplification
A well-optimized PCR reaction should produce a single, sharp, and clear band on the gel for each specific product [29]. The location of this band should correspond to the expected size of the amplicon, which is determined by comparing its migration distance to the DNA ladder run in an adjacent lane [34]. For example, if the target amplicon is 500 base pairs (bp), the band should appear approximately halfway between the 400 bp and 600 bp bands of a 100 bp ladder.
Troubleshooting Common Artifacts and Issues
Interpreting gel results also involves recognizing common artifacts that indicate problems with the PCR reaction or the gel itself. The table below summarizes these issues and their potential causes:
Table 2: Common Gel Electrophoresis Results and Their Interpretations
| Observation | Interpretation | Potential Causes & Solutions |
|---|---|---|
| Single, sharp band of expected size | Successful and specific amplification of the target DNA [29]. | Ideal result. Proceed to downstream applications. |
| No bands | PCR amplification failed [34]. | Failed reagent(s), incorrect thermal cycling parameters, poor primer design, or insufficient template DNA [35]. |
| Multiple bands or smearing | Non-specific amplification or DNA degradation [34]. | Primers annealing to incorrect sequences, contaminated template, or enzyme error. Increase annealing temperature or optimize buffer conditions [35] [29]. |
| Bands in negative control lane | Contamination [29] [6]. | Reagents or equipment contaminated with template DNA or amplicon from previous runs. |
| "Primer dimer" band at bottom of gel | Amplification of the primers themselves [33]. | Short, blunt-ended products from primer self-annealing. Optimize primer concentration and design [35]. |
| Smearing of DNA ladder or samples | Gel was run too fast, too much DNA was loaded, or the gel melted [34]. | Reduce voltage, load less DNA, use a higher agarose percentage, or ensure adequate buffer volume for cooling. |
| Crooked or wavy bands | Improper gel running conditions [34]. | Gel was not run on a level surface, or the electrodes are not straight. |
Different forms of plasmid DNA, often encountered in cloning workflows, will migrate to distinct positions on a gel. An uncut plasmid may show two bands: the faster-moving supercoiled covalently closed circular (CCC) form and the slower-moving open circular (OC) form. A completely digested (linearized) plasmid will typically run as a single band between these two forms [33].
Gel electrophoresis remains a cornerstone technique for the endpoint analysis of PCR products, providing a direct and interpretable visual readout of experimental success. Within the multi-step workflow of a PCR cycle research project, it serves as the essential gateway to downstream applications. A clear, specific band confirms that the preceding steps—from DNA isolation and primer design through meticulous thermal cycling—were executed effectively, yielding the desired molecular product.
While modern technologies like qPCR and dPCR offer powerful quantitative data, the simplicity, low cost, and visual clarity of agarose gel electrophoresis ensure its continued relevance in research and clinical laboratories [30]. Mastery of interpreting the banding patterns, from a single clean band to complex smears or multiple bands, is an indispensable skill. It allows researchers not only to validate their findings but also to troubleshoot and refine their protocols, thereby driving the iterative process of scientific discovery and ensuring the reliability of results in fields ranging from basic molecular biology to drug development.
Beyond the Basics: PCR Methodologies and Their Research Applications
Quantitative PCR (qPCR), also known as real-time PCR, represents a significant evolution from conventional polymerase chain reaction (PCR) technology. While traditional PCR enables the amplification of specific DNA sequences, qPCR allows researchers to monitor the amplification of DNA in real-time as the reaction progresses, rather than just at the end point [36]. This fundamental advancement transforms PCR from a qualitative tool into a precise quantitative method that combines amplification with detection in a single closed-tube system, significantly reducing hands-on time and contamination risk [37] [6].
The technique has revolutionized molecular diagnostics and biological research by enabling the sensitive, specific, and reproducible quantitation of nucleic acids [37]. Since its introduction, real-time quantitative PCR has expanded into a rapidly growing number of applications, including gene expression analysis, pathogen detection, genotyping, and biomarker discovery [38] [36]. This technology has facilitated the shift of molecular diagnostics toward high-throughput, automated systems with lower turnaround times, making it an indispensable tool in both research and clinical settings [37].
Fundamental Principles of qPCR
Core Technological Concept
The fundamental principle distinguishing qPCR from conventional PCR is its capacity for real-time monitoring of DNA amplification. This is achieved through the incorporation of fluorescent reporter molecules that emit signals proportional to the amount of PCR product accumulated in each cycle [36]. As the quantity of target amplicon increases, so does the amount of fluorescence emitted from the fluorophore, allowing the instrument to detect and quantify this accumulation throughout the reaction rather than just at the conclusion [38] [36].
In traditional PCR, results are collected after the reaction is complete (end-point detection), making it impossible to accurately determine the starting concentration of nucleic acid [36]. In contrast, qPCR focuses on the exponential phase of amplification, where reaction efficiency is highest and most consistent, providing the most precise and accurate data for quantitation [36]. During this exponential phase, the exact doubling of product occurs at every cycle (assuming 100% reaction efficiency) because all reagents are fresh and available, and the reaction kinetics favor amplicon doubling [36].
The Critical Ct Value
Quantitative evaluation in qPCR is fundamentally predicated on the threshold cycle (Ct) value, also known as quantification cycle (Cq) [38] [6]. The Ct value represents the PCR cycle number at which the fluorescence signal from amplification exceeds a predefined threshold above background levels [36]. This value is inversely proportional to the starting quantity of the target nucleic acid—samples with higher initial concentrations of the target sequence will produce detectable fluorescence earlier in the amplification process, resulting in lower Ct values [38].
The accurate determination of Ct values depends on proper baseline correction and threshold setting [39]. The baseline represents background fluorescence, typically determined from early cycles (e.g., cycles 5-15) before significant amplification occurs [39]. The threshold should be set sufficiently above background fluorescence but within the exponential phase of amplification where all amplification curves are parallel [39]. Proper setting of these parameters is crucial for reliable quantification, as incorrect baseline adjustment can significantly alter Ct values and lead to inaccurate results [39].
Amplification Curve Analysis
The qPCR amplification curve provides invaluable insights into the dynamics of PCR amplification, characterized by distinct phases: linear phase, exponential phase, and plateau phase [38] [36]. During the exponential phase, the fluorescence signal undergoes exponential augmentation with each successive PCR cycle, indicative of vigorous amplification of target nucleic acids [36]. The linear correlation between fluorescence intensity and PCR cycle number during this phase provides the foundation for precise quantification based on Ct values [38].
As the reaction progresses into the linear phase, some reagents become consumed, causing the reaction to slow and the PCR product to no longer double at each cycle [36]. Eventually, the reaction reaches the plateau phase where it has stopped entirely, no more products are being made, and if left long enough, the PCR products begin to degrade [36]. Each reaction plateaus at a different point due to varying reaction kinetics for each sample [36].
Detection Chemistries in qPCR
DNA-Binding Dyes
The simplest and most cost-effective detection method utilizes DNA-binding fluorescent dyes such as SYBR Green I [37]. These dyes intercalate nonspecifically into double-stranded DNA and undergo a dramatic fluorescence enhancement upon binding [36]. The main advantage of this approach is its simplicity and low cost, as it does not require the design and synthesis of target-specific probes [36]. However, the lack of specificity can be a significant drawback, as the dye will bind to any double-stranded DNA in the reaction, including nonspecific amplification products and primer-dimers, potentially leading to overestimation of target concentration [36].
Sequence-Specific Probes
Table 1: Comparison of Major qPCR Detection Chemistries
| Chemistry Type | Mechanism of Action | Advantages | Limitations | Common Applications |
|---|---|---|---|---|
| SYBR Green | Fluorescent dye that intercalates into dsDNA | • Cost-effective• Simple experimental design• No probe required | • Non-specific detection• Requires melt curve analysis• Sensitive to primer-dimers | • Gene expression screening• Melt curve analysis• Method development |
| TaqMan Probes | Hydrolysis probes cleaved by 5' nuclease activity of polymerase | • High specificity• Multiplexing capability• Reduced background signal | • Higher cost• Probe design required• Verification of cleavage efficiency needed | • Diagnostic assays• Pathogen detection• Gene expression analysis |
| Molecular Beacons | Stem-loop structure with reporter/quencher; fluoresces upon hybridization | • Excellent specificity for SNP discrimination• Low background signal• Stable stem-loop structure | • Complex probe design• Optimization challenging• Higher cost than SYBR Green | • SNP genotyping• Viral detection• Mutation identification |
| Scorpion Probes | Intramolecular primer-probe combination | • Faster reaction kinetics• Enhanced signal intensity• Uni-molecular probing | • Complex synthesis• Higher cost• Design expertise required | • High-throughput screening• Clinical diagnostics• Rapid detection assays |
TaqMan probes (hydrolysis probes) represent a cornerstone of qPCR assays, esteemed for their exceptional specificity and sensitivity in target detection [37] [38]. These probes consist of an oligonucleotide with a fluorescent reporter dye at the 5' terminus and a quencher dye at the 3' terminus [38]. When intact, the proximity of the quencher suppresses reporter fluorescence through fluorescence resonance energy transfer (FRET) [38]. During PCR amplification, the 5' exonuclease activity of Taq polymerase cleaves the TaqMan probe upon its annealing to the complementary target sequence, separating the reporter from the quencher and generating a detectable fluorescence signal [38].
Molecular beacons employ a different mechanism, utilizing stem-loop structures that remain closed in the absence of the target sequence, keeping the fluorophore and quencher in close proximity [38]. When the probe encounters its target DNA, it undergoes a conformational change that opens the hairpin, separates the fluorophore from the quencher, and permits fluorescence emission [38]. This dynamic hybridization process provides exceptional capacity to distinguish single-base mismatches, making molecular beacons particularly valuable for single-nucleotide polymorphism (SNP) genotyping and viral detection applications where high precision in target discrimination is critical [38].
Scorpion probes present an intramolecular strategy that integrates the priming and detection functions into a single molecule [37] [38]. These probes feature a target-specific sequence flanked by stem regions, with a fluorophore reporter dye appended to the 5' terminus and a quencher dye affixed to the 3' terminus [38]. The mechanism involves a unimolecular rearrangement that occurs after replication of the initial target, bringing the probe element into contact with the newly synthesized complementary sequence, resulting in fluorescence emission [38]. This intramolecular interaction enhances amplification efficiency and sensitivity compared to bimolecular probe systems [38].
Quantification Methods in qPCR
Absolute Quantification
Absolute quantification determines the exact copy number or concentration of a target nucleic acid in a sample [38]. This method requires the construction of a standard curve using known concentrations of reference standards, typically derived from serially diluted nucleic acid templates with predetermined concentrations [38]. The Ct values of these standards are plotted against the logarithm of their initial concentrations to generate a standard curve with a characteristic linear relationship [38].
Unknown samples are quantified by comparing their Ct values to this standard curve, allowing calculation of the absolute target concentration in the original specimen [38]. Standard curve analysis enhances the precision and reliability of qPCR quantification, facilitating quantitative comparisons across diverse samples and experimental conditions [38]. The standards used must be carefully characterized, with common options including purified PCR products, in vitro transcribed RNA, or plasmid DNA containing the target sequence [38].
Table 2: Comparison of qPCR Quantification Methods
| Parameter | Absolute Quantification | Relative Quantification |
|---|---|---|
| Primary Objective | Determine exact target copy number or concentration | Measure fold-change differences between samples |
| Standard Requirement | Requires external standard curve with known concentrations | No standard curve needed (ΔΔCt method) |
| Data Output | Absolute copy numbers or concentrations | Fold-change relative to calibrator sample |
| Key Assumptions | • Standard and target amplify with equal efficiency• Standard accurately represents unknown | • Target and reference genes amplify with equal efficiency• Reference gene expression is constant |
| Normalization Approach | Normalization to standard curve | Normalization to reference gene(s) |
| Experimental Applications | • Viral load quantification• Pathogen enumeration• Copy number variation | • Gene expression studies• Drug treatment effects• Time-course experiments |
Relative Quantification
Relative quantification determines the fold-change differences in target abundance between experimental samples rather than absolute copy numbers [38] [36]. The most common approach is the comparative Ct (ΔΔCt) method, which normalizes the Ct values of the target gene to an internal reference gene (often a housekeeping gene) and compares this normalized value to a control sample [40] [36].
The calculation proceeds through several steps. First, ΔCt is calculated as the difference between the Ct values of the target gene and reference gene for each sample [40]. Next, ΔΔCt is determined as the difference between the ΔCt of the experimental sample and the ΔCt of the calibrator control sample [40]. Finally, the fold-change is calculated using the formula 2^(-ΔΔCt) [40]. This method assumes that the amplification efficiencies of both the target and reference genes are approximately equal and close to 100% [40]. When amplification efficiencies differ significantly, alternative calculation methods that incorporate actual efficiency values must be employed [39].
Efficiency Considerations
PCR efficiency represents the percentage of template that is duplicated in each cycle, with 100% efficiency corresponding to exact doubling of product every cycle [6]. Efficiency values between 90-110% are generally considered acceptable, with ideal assays falling in the 95-105% range [36]. Low PCR efficiency requires additional cycles to reach the quantification threshold, resulting in higher Ct values and potentially inaccurate quantification [6].
Efficiency is typically assessed using standard curve slopes, with the relationship between slope and efficiency described by the formula: Efficiency = 10^(-1/slope) - 1 [39]. A slope of -3.32 corresponds to 100% efficiency, while steeper slopes indicate reduced efficiency [39]. Factors affecting PCR efficiency include template quality, primer design, reagent concentrations, and the presence of inhibitors in the reaction [41] [42].
The Scientist's Toolkit: Essential Reagents and Materials
Table 3: Essential Research Reagents for qPCR Experiments
| Reagent/Material | Function/Purpose | Optimal Concentration Ranges | Critical Considerations |
|---|---|---|---|
| DNA Polymerase | Enzyme that synthesizes new DNA strands; thermostable versions (e.g., Taq) enable automation | 0.5-2.5 units per 50 μL reaction | • Thermostability profile• Proofreading activity requirements• Processivity for long targets |
| Primers | Short oligonucleotides that define target sequence and provide initiation point for synthesis | 20-50 pmol per reaction (0.1-1 μM final) | • Tm 52-65°C• GC content 40-60%• Avoid secondary structures and dimerization |
| dNTPs | Nucleotide building blocks (dATP, dCTP, dGTP, dTTP) for DNA synthesis | 200 μM of each dNTP (50 μM each) | • Quality and purity• Proper pH balance• Avoid multiple freeze-thaw cycles |
| Magnesium Chloride | Essential cofactor for DNA polymerase activity | 0.5-5.0 mM (typically 1.5-4 mM) | • Critical optimization parameter• Affects enzyme activity and fidelity• Concentration depends on buffer composition |
| Fluorescent Reporter | SYBR Green dye or sequence-specific probes for real-time detection | Varies by chemistry (follow manufacturer guidelines) | • Spectral compatibility with instrument• Photostability• Background fluorescence levels |
| Buffer Components | Maintain optimal pH and ionic strength for enzymatic activity | Typically 1X concentration | • Tris-HCl or similar buffering agent• Potassium chloride (50 mM)• Stabilizing additives |
Specialized Additives and Enhancers
Certain challenging templates require specialized additives to improve amplification efficiency and specificity. For GC-rich templates (>65% GC content), which tend to form stable secondary structures that hinder amplification, additives such as DMSO (2.5-5%) can be added to improve results by reducing melting temperatures and preventing secondary structure formation [41]. For AT-rich templates, lower extension temperatures (60-65°C) may improve amplification reliability [41]. Other common enhancers include betaine (0.5-2.5 M), formamide (1.25-10%), and BSA (10-100 μg/mL), which help overcome various amplification obstacles by stabilizing enzymes, reducing secondary structure, or binding inhibitors [42].
Template Quality and Quantity Considerations
The optimal amount of template required depends on the complexity of the template and the copy number of the target sequence [41]. Approximately 10^4 copies of the target DNA sequence are required to detect the amplification product in 25-30 PCR cycles [41]. For human genomic DNA, 30-100 ng is typically sufficient, while for high-copy targets such as housekeeping genes, only 10 ng of template may be adequate [41]. Lower complexity templates such as plasmid DNA or bacterial genomic DNA require significantly less input material, typically in the range of 100 pg to 1 ng [41]. DNA integrity is particularly critical for amplification of long targets, as DNA damage such as breakage during isolation or depurination at elevated temperatures results in partial products and decreased overall yield [41].
Experimental Design and Optimization
Controls and Replicates
Proper experimental design in qPCR requires the implementation of appropriate controls and replicates to ensure data validity and reliability [40]. Essential controls include no template controls (NTC) to detect reagent contamination, no reverse transcription controls (NRT) for RT-qPCR to assess genomic DNA contamination, and positive controls to verify reaction efficiency [40]. Both technical replicates (multiple reactions from the same sample) and biological replicates (independent biological samples) are necessary to account for both experimental variability and true biological variation [40]. Technical replicates typically consist of at least 2-3 PCR wells per sample, while biological replicates should include at least 3-6 independent biological specimens per experimental condition to enable proper statistical analysis [40].
Reference Gene Selection
For relative quantification, the selection of appropriate reference genes (often called housekeeping genes or endogenous controls) is critical for accurate data normalization [36]. Ideal reference genes should exhibit stable expression across all experimental conditions, tissues, or treatments being studied [36]. The expression level should be relatively high but comparable to the target genes of interest, and the amplification efficiency should be similar to the target genes [36]. Commonly used reference genes include GAPDH, β-actin, ribosomal RNAs, and various transcription factors, but their stability must be validated for each specific experimental system as there is no universal reference gene that works optimally in all situations [36].
Thermal Cycling Parameters
Optimal thermal cycling conditions are essential for efficient and specific amplification. The denaturation step typically occurs at 94-95°C for 30 seconds or 98°C for 10 seconds, with excessive heat treatment potentially leading to enzyme inactivation [41]. The annealing temperature depends directly on the Tm of the primers and should be optimized for each primer set, typically ranging from 55-72°C [41] [42]. Using annealing temperatures that are too low may result in mispriming and nonspecific amplification, while temperatures that are too high can reduce yield [41]. The extension step is generally performed at 68-72°C, with duration based on amplicon length (typically 15-60 seconds per kilobase) [41]. For high-fidelity polymerases or long amplicons, lower extension temperatures (68°C) may be preferred to reduce depurination rates [41].
Quantitative PCR has fundamentally transformed molecular biology research and diagnostic applications by providing a sensitive, specific, and reproducible method for nucleic acid quantification [37]. The core principles of real-time monitoring, Ct value determination, and appropriate quantification strategies form the foundation of this powerful technology [38] [36]. As the technique continues to evolve, advancements in detection chemistries, instrumentation, and data analysis methods further expand its applications and improve its accessibility [37] [11].
Successful implementation of qPCR requires careful attention to experimental design, optimization, and validation [42] [36]. Proper primer and probe design, template quality assessment, control implementation, and data normalization are all critical components of reliable qPCR experiments [42] [40] [36]. By understanding and applying the fundamental principles outlined in this guide, researchers can leverage the full potential of qPCR technology to advance their scientific investigations across diverse fields including gene expression analysis, pathogen detection, biomarker discovery, and diagnostic applications [37] [6] [36].
Reverse Transcription PCR (RT-PCR) is a powerful molecular biology technique that allows for the amplification and detection of RNA molecules by first converting them into complementary DNA (cDNA). This method combines the reverse transcription of RNA into cDNA with the polymerase chain reaction (PCR) to enable the study of gene expression and RNA viruses. Since its development, RT-PCR has displaced older techniques like Northern blotting as the method of choice for RNA detection and quantification due to its superior sensitivity, specificity, and ability to work with limited starting material [43].
The technique has revolutionized the field of molecular biology by making it theoretically possible to detect the transcripts of practically any gene, enabling sample amplification without the need for abundant starting material, and providing tolerance for RNA degradation as long as the RNA spanning the primer region remains intact [43]. RT-PCR has become particularly valuable in both research and clinical settings, with applications ranging from basic gene expression studies to diagnostic testing for infectious agents like SARS-CoV-2 [44] [43].
Fundamental Principles of RT-PCR
Core Principles and Mechanism
RT-PCR operates on the principle of first converting RNA into complementary DNA (cDNA) using a reverse transcriptase enzyme, followed by exponential amplification of the resulting cDNA using traditional PCR. The process begins with RNA extraction from cells or tissues, which is then reverse transcribed into cDNA using reverse transcriptase along with primers (oligo(dT), random, or gene-specific) and nucleotides [45]. This cDNA serves as a stable DNA representation of the original RNA population and becomes the template for subsequent PCR amplification [44] [43].
During the PCR phase, the cDNA undergoes thermal cycling involving denaturation (separation of DNA strands), annealing of specific primers to complementary sequences, and extension of new DNA strands by a thermostable DNA polymerase [45]. This cyclic process results in exponential amplification of the target sequences, generating millions to billions of copies that can be detected and analyzed. The entire process can be performed as either a one-step or two-step procedure, depending on whether the reverse transcription and amplification steps occur in a single reaction tube or two separate tubes [46] [43].
Comparison of RT-PCR Methodologies
RT-PCR can be performed using different methodological approaches, primarily classified as one-step or two-step protocols, each with distinct advantages and applications.
Table 1: Comparison of One-Step vs. Two-Step RT-PCR
| Feature | One-Step RT-PCR | Two-Step RT-PCR |
|---|---|---|
| Reaction Setup | Reverse transcription and PCR occur in a single tube [46] | Separate optimized reactions for reverse transcription and PCR [46] |
| Primer Options | Gene-specific primers only [46] [47] | Oligo(dT), random hexamers, or gene-specific primers [46] [47] |
| Ideal Applications | Analysis of one or two genes; high-throughput platforms [46] | Analysis of multiple genes from the same sample [46] |
| Advantages | Faster, high-throughput, fewer pipetting steps, convenient, reduced contamination risk [46] [44] | Flexible, allows cDNA storage for multiple assays, optimized conditions for each step [46] [44] |
| Disadvantages | Less sensitive, cannot optimize reactions separately [44] [47] | More pipetting steps, increased contamination risk, time-consuming [44] [47] |
| Sensitivity | Lower detection efficiency due to compromised reaction conditions [47] | Higher sensitivity and cDNA yield [44] [45] |
The one-step approach offers a simpler, more streamlined workflow that minimizes handling steps and reduces the risk of contamination, making it suitable for high-throughput applications and clinical diagnostics [46]. In contrast, the two-step method provides greater flexibility, allowing the same cDNA sample to be used for multiple PCR reactions targeting different genes, and enables optimized conditions for each enzymatic reaction [46] [47].
RT-PCR Workflow and Experimental Design
Complete RT-PCR Workflow
The following diagram illustrates the comprehensive workflow for RT-PCR, encompassing both one-step and two-step methodologies:
Sample Preparation and RNA Isolation
The initial and most critical step in RT-PCR is the isolation of high-quality RNA from biological samples. Maintaining RNA integrity is paramount, as RNA is highly susceptible to degradation by ubiquitous RNases. Optimal purification methods must effectively remove endogenous compounds such as complex polysaccharides from plant tissues or humic acid that can interfere with enzyme activity, along with common inhibitors of reverse transcriptases including salts, metal ions, ethanol, and phenol [46]. Total RNA is routinely used in one-step RT-PCR, though mRNA can also be employed, with each having specific advantages [47].
Proper handling during extraction, processing, storage, and experimental use is essential for preserving RNA integrity. Once purified, RNA should be stored at -80°C with minimal freeze-thaw cycles to prevent degradation [46]. For RNAs with polyadenylated tails, enrichment can be performed using mRNA purification kits, though total RNA is often preferred because it requires fewer purification steps and ensures more quantitative recovery, avoiding potential skewed results from differential mRNA recovery yields [48] [47]. The quality and quantity of isolated RNA should be verified using spectrophotometric methods and integrity confirmed through gel electrophoresis or specialized instruments like Bioanalyzers [48].
Genomic DNA Removal
Since small amounts of genomic DNA can occasionally contaminate purified RNA samples, implementing strategies to minimize its impact is crucial for accurate gene expression analysis. There are three common approaches to address genomic DNA contamination:
Primer Design Across Exon-Exon Junctions: Designing primers to span exon-exon boundaries prevents amplification of genomic DNA, as the intron-containing genomic sequence would not be amplified [46] [47].
Minus Reverse Transcriptase Controls: Including control reactions without reverse transcriptase enables monitoring of genomic DNA contamination [47].
DNase Treatment: Enzymatic removal of contaminating DNA using DNases such as ezDNase Enzyme provides efficient genomic DNA elimination without compromising RNA quality or subsequent cDNA synthesis [46].
The ezDNase Enzyme represents a significant advancement as it is a recombinant double-strand-specific DNase that efficiently removes genomic DNA while having no impact on RNA, cDNA, or primers in RT reactions. Its heat-labile nature allows easy inactivation at moderate temperatures (55°C), streamlining the workflow compared to conventional DNase I treatments [46].
Primer Design and Reaction Optimization
Primer Design Strategies
Effective primer design is fundamental to successful RT-PCR experiments, with different primer types offering distinct advantages for various applications:
Table 2: Primer Options for Reverse Transcription
| Primer Type | Structure and Function | Advantages | Disadvantages |
|---|---|---|---|
| Oligo(dT) Primers | Stretch of thymine residues that anneal to poly(A) tail of mRNA [47] [45] | Generation of full-length cDNA from poly(A)-tailed mRNA; efficient when limited starting material available [47] | Only amplifies genes with poly(A) tails; bias toward 3' end of transcripts [47] |
| Random Primers | Short oligonucleotides (6-9 bases) that anneal at multiple points along RNA transcripts [47] [45] | Anneals to all RNA types (rRNA, tRNA, mRNA); effective for transcripts with secondary structure; high cDNA yield [47] | cDNA made from all RNAs which can dilute mRNA signal; produces truncated cDNA fragments [47] |
| Sequence-Specific Primers | Custom primers targeting specific mRNA sequences [47] [45] | Specific cDNA pool; increased sensitivity; uses reverse qPCR primer [47] | Synthesis limited to one gene of interest [47] |
For one-step RT-PCR, gene-specific primers (GSPs) are strongly recommended, as oligo(dT) or random primers can generate non-specific products that reduce the yield of target RT-PCR products [46]. Well-designed GSPs should not be self-complementary or complementary to each other at the 3' end, and a final concentration of 0.5 μM for each primer is typically recommended, though further optimization may be necessary [46].
To differentiate between amplified cDNA and potential contaminating genomic DNA, primers should ideally be designed to anneal to mRNA sequences in exons on both sides of an intron or exon/exon boundary [46] [47]. When this approach is not feasible, genomic DNA removal with enzymes like ezDNase is recommended [46]. Systems like the Invitrogen SuperScript IV UniPrime One-Step RT-PCR System offer a universal primer annealing temperature of 60°C, eliminating the need to calculate the melting temperature (Tm) of each primer set and simplifying PCR optimization [46].
Reaction Components and Optimization
A typical RT-PCR assay requires several essential components: nucleic acid sample (RNA), reverse transcriptase enzyme, DNA polymerase, primers, deoxynucleotide triphosphates (dNTPs), PCR buffers, and appropriate cations [45]. The reverse transcriptase enzyme is particularly critical, as it catalyzes the formation of cDNA from the RNA template [45]. Commonly used reverse transcriptases include Moloney murine leukemia virus reverse transcriptase (M-MLV) and Avian myeloblastosis virus reverse transcriptase (AMV) [47].
For the PCR amplification phase, thermostable DNA polymerases like Taq DNA polymerase are essential due to their ability to withstand repeated heating and cooling cycles [45]. The selection of appropriate reverse transcriptases with optimal RNase H activity is also important, as this activity degrades RNA from RNA-DNA duplexes. While minimal RNase H activity is beneficial for producing long transcripts, reverse transcriptases with intrinsic RNase H activity are often preferred in qPCR applications because they enhance the melting of RNA-DNA duplexes during initial PCR cycles [47].
Reaction optimization should address several factors including template quality and quantity, primer concentrations, magnesium ion concentration, cycling parameters, and the potential impact of inhibitors. Modern engineered reverse transcriptases demonstrate improved robustness against common inhibitors such as co-purified compounds from biological samples or reagents used for RNA purification, making reverse transcription less dependent on RNA sample purity to achieve reliable results [46].
Detection Methods and Analysis
Quantitative Approaches in RT-PCR
RT-PCR product quantification can be broadly divided into two categories: end-point and real-time detection [43]. End-point RT-PCR involves measuring gene expression levels after the amplification is complete, using methods such as fluorescent dyes like ethidium bromide, P32 labeling of PCR products with phosphorimager detection, or scintillation counting [43]. This approach is preferred for measuring gene expression changes in a small number of samples and can be performed using relative, competitive, or comparative methods [43].
Real-time RT-PCR (also known as quantitative RT-PCR or RT-qPCR) has emerged as the gold standard method for validating quantitative results obtained from array analyses or global gene expression changes [43]. This technique enables reliable detection and measurement of products generated during each PCR cycle by monitoring the amplification reaction using fluorescence [49]. The key principle involves tracking the increase in fluorescence as PCR products accumulate, with the cycle threshold (Ct) value representing the fractional PCR cycle number at which the reporter fluorescence exceeds a set threshold [49].
Detection Chemistry
Currently, four main fluorescent detection systems are available for real-time RT-PCR product detection:
SYBR Green: This DNA-binding dye emits fluorescence when bound to double-stranded DNA, with signal intensity increasing as PCR products accumulate. SYBR Green is economical and easy to use since it doesn't require specialized probes, but it lacks specificity as it binds to any double-stranded DNA, including primer-dimers, potentially leading to overestimation of target concentration [43].
TaqMan Probes: These oligonucleotide probes have a fluorescent reporter attached to the 5' end and a quencher at the 3' end. During PCR amplification, the 5' nuclease activity of Taq polymerase cleaves the probe, separating the fluorophore from the quencher and generating a fluorescent signal. TaqMan probes offer high specificity but are more expensive and require separate probe design for each target [49] [43].
Molecular Beacons: Similar to TaqMan probes, molecular beacons employ FRET technology with fluorescent dyes and quenchers, but they remain intact during amplification and rebind to new targets each cycle. They form stem-loop structures that separate upon hybridization to the target, emitting fluorescence [43].
Scorpion Probes: These all-in-one primer-probe molecules contain a PCR primer covalently linked to a probe element, which also carries a fluorophore and quencher. The mechanism of signal generation is similar to molecular beacons but offers improved kinetics as the probing event is intramolecular [43].
Applications and Technical Considerations
Research and Clinical Applications
RT-PCR has diverse applications across multiple fields:
Gene Expression Analysis: RT-PCR enables sensitive detection and quantification of mRNA levels, facilitating the study of gene expression patterns under different physiological conditions, in response to treatments, or in various disease states [46] [45]. It has largely replaced Northern blot analysis due to its superior sensitivity and ability to work with limited starting material [43].
Infectious Disease Diagnosis: The technique is widely used to detect and quantify viral pathogens such as HIV, SARS-CoV-2, influenza, and hepatitis C virus [44] [45]. During the COVID-19 pandemic, RT-PCR became the benchmark technology for mass diagnosis of coronavirus infections [44].
Cancer Research: RT-PCR can detect tissue-specific mutant alleles and unique mRNAs produced by cancer cells, enabling cancer diagnosis, monitoring of minimal residual disease, and studying tumor heterogeneity [45].
Genetic Engineering and Gene Therapy: The technique is used to prepare cDNA from eukaryotic mRNA that lacks introns for insertion into prokaryotes, and to monitor the outcomes of gene insertion and gene therapy approaches [45].
Mutation Detection and Genetic Testing: RT-PCR facilitates the detection of genetic variations, including single nucleotide polymorphisms (SNPs), and is employed in prenatal diagnosis and carrier testing for genetic disorders [49] [45].
Performance Characteristics and Troubleshooting
Modern RT-PCR systems offer exceptional performance characteristics, including high sensitivity with detection down to 0.01 pg of RNA, the ability to amplify targets up to 13.8 kb in length, and high analytical specificity with reduced procedural times compared to earlier systems [46]. The sensitivity of RT-PCR makes it suitable for analyzing RNA from single cells, enabling studies of cellular heterogeneity and rare cell populations [48].
Common technical considerations and troubleshooting approaches include:
Inhibition Management: Engineered reverse transcriptases demonstrate improved resistance to common inhibitors such as xylan, humic acid, SDS, Trizol, or LiCl, reducing dependency on RNA sample purity [46].
Control Reactions: Including appropriate controls is essential for data interpretation. Minus reverse transcriptase controls ("no RT" controls) help identify contamination from genomic DNA or previous PCR products [47].
RNA Quality Assessment: Ensuring RNA integrity through proper extraction, handling, and storage practices is critical for reproducible results. Assessment methods include spectrophotometric ratios (A260/A280 and A260/A230) and microfluidic analysis [46] [48].
Quantification Methods: For real-time RT-PCR, absolute quantification uses standard curves of known concentrations, while relative quantification (such as the ΔΔCt method) compares expression levels between samples using reference genes for normalization [48].
Essential Research Reagents and Equipment
Table 3: Research Reagent Solutions for RT-PCR
| Reagent Category | Specific Examples | Function and Application |
|---|---|---|
| Reverse Transcriptase Enzymes | SuperScript IV Reverse Transcriptase, M-MLV RT, AMV RT | Catalyzes synthesis of cDNA from RNA templates; engineered versions offer higher thermal stability and robustness [46] [47] |
| DNA Polymerases | Taq DNA Polymerase, Platinum Taq High Fidelity DNA Polymerase | Amplifies cDNA templates during PCR; thermostable enzymes withstand repeated heating cycles [46] [45] |
| Primers | Oligo(dT) primers, random hexamers, gene-specific primers | Provides starting points for DNA synthesis; choice depends on application and RNA targets [47] [45] |
| dNTPs | dATP, dGTP, dCTP, dTTP | Building blocks for cDNA synthesis and DNA amplification [45] |
| RNA Extraction Kits | Trizol-based methods, commercial purification kits | Isolates high-quality RNA from various sample types; maintains RNA integrity [46] [48] |
| gDNA Removal Reagents | ezDNase Enzyme, DNase I | Removes contaminating genomic DNA from RNA preparations; improves specificity [46] |
| Detection Chemistries | SYBR Green, TaqMan Probes, Molecular Beacons | Enables real-time monitoring of amplification; varies in specificity and cost [49] [43] |
| Buffers and Reaction Mixes | One-step RT-PCR master mixes, reverse transcription buffers | Provides optimal chemical environment for enzymatic reactions; simplifies reaction setup [46] [47] |
Successful RT-PCR experiments require specialized equipment including thermal cyclers capable of precise temperature control for the denaturation, annealing, and extension steps [45]. For real-time RT-PCR, instruments equipped with optical detection systems for monitoring fluorescence during amplification are essential [49]. More recently, digital PCR systems have emerged as a third generation of PCR technology, providing absolute quantification without standard curves by partitioning samples into thousands of individual reactions [50].
Digital PCR (dPCR) represents a transformative approach in molecular biology, enabling absolute quantification of nucleic acids without the need for standard curves. This whitepaper provides a comprehensive technical overview of dPCR methodology, focusing on its core principle of sample partitioning and Poisson statistics-based quantification. Designed for researchers, scientists, and drug development professionals, this guide explores the technological foundations, workflow protocols, and advanced applications of dPCR within the broader context of PCR cycle research, highlighting its superior precision for detecting rare genetic events and its growing importance in clinical diagnostics and biomedical research.
Digital PCR (dPCR) is an advanced molecular technique for absolute quantification of nucleic acid concentrations through the combination of limiting dilution, end-point PCR, and Poisson statistics [51]. Unlike conventional PCR methods that rely on exponential amplification observed in real-time, dPCR takes a fundamentally different approach by partitioning a sample into thousands of individual reactions, each serving as a separate PCR microreactor [52]. This partitioning converts the continuous, analog measurement of nucleic acid concentration into a series of digital, binary readings (positive/negative), thus giving the technique its name [51].
The conceptual foundation for dPCR was first described in 1988, with the method further developed in 1999 when the term "digital PCR" was formally introduced in scientific literature [51]. The technology has evolved significantly through key commercial milestones: the first dPCR system based on microfluidic chips emerged in 2006/2007, followed by instruments using spinning microfluidic discs in 2010, droplet-based systems in 2011, microplate-based systems in 2013, and most recently, nanoplate-based systems in 2020 [51]. This technological evolution has enhanced the accessibility, reliability, and throughput of dPCR, establishing it as a powerful tool for applications requiring exceptional sensitivity and precision.
Core Principles and Comparison with Other PCR Methods
Fundamental Differences Between PCR Methodologies
The polymerase chain reaction (PCR) is a fundamental technique in molecular biology that amplifies specific DNA sequences through repeated temperature cycles of denaturation, annealing, and extension [6] [11]. While conventional PCR provides qualitative detection of amplified DNA through end-point analysis, and quantitative real-time PCR (qPCR) enables quantification by measuring amplification during the exponential phase, dPCR employs a fundamentally different quantification strategy based on sample partitioning and binary endpoint detection [51] [52].
In conventional PCR, amplification is detected after the reaction is complete (end-point measurement), typically using gel electrophoresis, which provides qualitative rather than quantitative data [6] [52]. Quantitative PCR (qPCR), also known as real-time PCR, monitors the accumulation of PCR products in real-time using fluorescent reporters, allowing quantification based on the cycle threshold (Ct) value - the number of cycles required for the fluorescent signal to cross a detection threshold [53] [54]. However, qPCR relies on standard curves from samples of known concentration for quantification, which introduces potential variables and limitations [52].
Table 1: Core Differences Between Major PCR Technologies
| Parameter | Conventional PCR | Quantitative PCR (qPCR) | Digital PCR (dPCR) |
|---|---|---|---|
| Quantification | Qualitative | Relative quantification | Absolute quantification |
| Detection Method | End-point gel electrophoresis | Real-time fluorescence | End-point fluorescence |
| Standard Curve | Not applicable | Required | Not required |
| Statistical Basis | None | Ct value comparison | Poisson statistics |
| Sensitivity | Low | High | Very high |
| Precision | Low | Moderate | High |
| Tolerance to Inhibitors | Low | Moderate | High |
The Partitioning Principle in dPCR
The fundamental innovation of dPCR lies in its partitioning strategy. Before amplification, the PCR reaction mixture—containing template nucleic acids, primers, probes, nucleotides, enzymes, and buffers—is divided into thousands to millions of separate partitions [51]. These partitions can be physical chambers in microfluidic chips, nanoliter-scale wells in plates, or droplets in water-oil emulsions [51] [52]. Each partition effectively contains zero, one, or several target nucleic acid molecules, with the distribution following statistical principles [51].
After partitioning, PCR amplification occurs within each individual partition. Partitions containing at least one target molecule generate a fluorescent signal (positive), while those without target remain dark (negative) [51]. This binary readout is conceptually similar to the digital binary system of computers, where information is encoded as ones (positive) and zeros (negative) [51]. The ratio of positive to total partitions, combined with known partition volumes, enables precise calculation of the original target concentration using Poisson statistics [51] [52].
Diagram 1: Digital PCR Workflow. The process begins with sample preparation, followed by partitioning into thousands of individual reactions, PCR amplification, fluorescence imaging, and data analysis using Poisson statistics.
The dPCR Workflow: From Sample to Result
Partitioning Strategies and Platforms
dPCR platforms employ different physical principles for sample partitioning, each with distinct advantages and limitations. Chip-based dPCR systems use microfluidic circuits to divide samples into arrays of nanoliter-scale chambers [51]. Droplet digital PCR (ddPCR) creates water-in-oil emulsion droplets, typically generating thousands to millions of partitions [51]. Nanoplate-based dPCR utilizes specially engineered plates with predefined wells for partitioning [51]. The choice of platform depends on the specific application requirements, including desired throughput, sensitivity, and multiplexing capabilities.
The number of partitions significantly impacts quantification accuracy. Systems generating higher partition counts provide greater statistical power and wider dynamic range [52]. For example, early chip-based systems created hundreds to thousands of partitions, while modern droplet-based systems can generate up to millions of partitions [51] [52]. The optimal partition count depends on the application, with rare allele detection typically requiring higher partition numbers than high-abundance target quantification.
Practical Protocol: Nanoplate dPCR Workflow
The dPCR workflow consists of three main phases: preparation and loading, amplification, and analysis [51]:
Phase 1: Prepare and Load
- Measure DNA amount and purity using standard spectrophotometric methods
- Set up dPCR parameters using instrument software, including priming, cycling, imaging profiles, reaction mixes, samples, controls, and plate layout
- Prepare reaction mix in a pre-plate according to manufacturer's recommendations
- Pipette prepared reaction mix into nanoplate wells
- Seal plate with specialized foil using manual rolling apparatus
- Carefully handle plate by side edges to prevent fluid displacement
- Load plate into instrument and initiate run protocol
Phase 2: Run and Amplify
- The instrument automatically processes the plate in the priming/rolling module, partitioning each well reaction into thousands of individual nanoreactions
- PCR thermocycling is performed with standard denaturation, annealing, and extension steps
- Template presence in individual partitions leads to fluorescence signal accumulation
- Fluorescence is detected during automated imaging cycles
- Images are processed using the instrument's software suite
Phase 3: Analyze Results
- Select appropriate application view (heatmap, histogram, 1D scatterplot, 2D scatterplot)
- Implement threshold settings to distinguish positive from negative partitions
- Recalculate results based on adjusted threshold settings as needed
- Export quantitative data for further statistical analysis
Table 2: Key Reagent Solutions for dPCR Experiments
| Reagent Category | Specific Examples | Function in dPCR |
|---|---|---|
| Polymerase Enzymes | Taq DNA polymerase, Hot-start variants | DNA strand elongation using 5'→3' polymerase activity |
| Fluorescent Probes | Hydrolysis probes (TaqMan), Intercalating dyes (SYBR Green) | Sequence-specific detection and quantification |
| Partitioning Reagents | Oil-surfactant mixtures (ddPCR), Surface treatments | Creation of stable, discrete reaction chambers |
| Master Mix Components | dNTPs, MgCl₂, Buffers, Stabilizers | Optimal reaction conditions for amplification |
| Nucleic Acid Templates | DNA, cDNA, RNA | Target molecules for quantification |
Absolute Quantification Through Poisson Statistics
Statistical Foundation of dPCR Quantification
The absolute quantification capability of dPCR stems from its foundation in Poisson statistics [51] [52]. The random distribution of target molecules across many partitions follows a Poisson distribution, which describes the probability of a given number of events occurring in a fixed interval of time or space when these events occur with a known constant mean rate and independently of the time since the last event [52].
The Poisson model determines the probability of a partition receiving zero, one, two, or more copies of the target molecule based on the formula:
[ P(k) = \frac{e^{-\lambda} \lambda^k}{k!} ]
Where:
- ( P(k) ) = probability of a partition containing k target molecules
- ( \lambda ) = average number of target molecules per partition
- ( e ) = base of the natural logarithm (~2.71828)
For dPCR quantification, the critical insight is that the proportion of negative partitions (k=0) follows:
[ P(0) = e^{-\lambda} ]
Therefore, if we know the proportion of negative partitions (P(0)), we can calculate λ as:
[ \lambda = -\ln(1 - \frac{k}{n}) ]
Where:
Practical Calculation Example
Consider a dPCR experiment with a total reaction volume of 12 μL, created by mixing 5 μL DNA sample with 3 μL mastermix and 4 μL primers [51]. After running the dPCR system, results show 4,000 positive partitions out of 8,000 valid partitions total.
The copies per partition (λ) is calculated as: [ \lambda = -\ln(1 - 4000/8000) = -\ln(0.5) ≈ 0.693 ]
The total number of target molecules in all partitions is: [ 0.693 × 8000 = 5544 \text{ copies} ]
With a partition volume (assuming equal partitioning of 12 μL into 8000 partitions): [ \text{Partition volume} = 12 \mu L / 8000 = 0.0015 \mu L ]
The concentration is: [ 0.693 / 0.0015 \mu L = 462 \text{ copies/μL} ]
The original sample concentration (considering 5 μL was used in 12 μL reaction): [ 462 \text{ copies/μL} × (12 \mu L / 5 \mu L) = 1108.8 \text{ copies/μL in original sample} ] [51]
Diagram 2: Poisson Distribution Impact. The Poisson parameter λ (average copies per partition) affects partition occupancy patterns, with optimal quantification occurring at intermediate λ values (~0.1-5).
Precision and Confidence Intervals
The precision of dPCR quantification depends directly on the number of partitions analyzed [52]. Intuitively, confidence in concentration estimation is highest when the pattern of positive and negative partitions is most informative—typically when 20-80% of partitions are positive [52]. In extreme cases where most partitions are either empty or positive, confidence decreases because the binary pattern provides less statistical information [52].
The confidence interval for the target concentration can be estimated using statistical methods such as the Wilson method or Clopper-Pearson method [52]. For 10,000 or more partitions, optimal precision is achieved at a λ value of approximately 1.6, which corresponds to about 20% empty partitions [52]. The precision at this optimal λ scales with the inverse square root of the number of partitions, meaning that increasing partition count directly improves quantification accuracy [52].
Table 3: Impact of Partition Number on Quantification Precision
| Total Partitions | Optimal Precision (at λ=1.6) | Relative Improvement |
|---|---|---|
| 1,000 | ± 6.5% | Baseline |
| 5,000 | ± 2.9% | 2.2x |
| 10,000 | ± 2.1% | 3.1x |
| 20,000 | ± 1.5% | 4.3x |
| 50,000 | ± 0.9% | 7.2x |
Advanced Applications and Experimental Considerations
Research and Clinical Applications
dPCR's unique capabilities make it particularly valuable for applications requiring exceptional sensitivity, specificity, and precision [51]:
Rare Sequence Detection: dPCR excels at detecting low-abundance targets in complex backgrounds, such as rare mutations in oncology or minimal residual disease monitoring [51]. The partitioning effect concentrates rare targets and separates them from abundant wild-type sequences, significantly improving detection sensitivity compared to qPCR.
Copy Number Variation (CNV) Analysis: The absolute quantification nature of dPCR enables precise determination of gene copy numbers without reference standards, making it valuable for genetic disorder diagnosis and cancer genomics [51].
Liquid Biopsy Applications: dPCR can detect and quantify circulating tumor DNA (ctDNA) in blood samples, enabling non-invasive cancer detection, therapy monitoring, and recurrence surveillance [51].
Viral Load Monitoring: dPCR provides absolute quantification of viral nucleic acids without standard curves, improving accuracy in chronic infection monitoring and vaccine efficacy studies [51]. During the COVID-19 pandemic, dPCR was employed for precise SARS-CoV-2 quantification in wastewater and clinical samples [51].
Gene Expression Analysis: While reverse transcription qPCR (RT-qPCR) is more common for gene expression studies, dPCR offers advantages for detecting low-abundance transcripts or when highest precision is required [51] [53].
Single-Cell Analysis: The sensitivity of dPCR enables genetic analysis from single cells, supporting research in cellular heterogeneity, stem cell biology, and early development [51].
NGS Library Quantification: dPCR provides highly accurate quantification of next-generation sequencing libraries, improving sequencing efficiency and reducing costs by ensuring optimal template loading [51].
Advantages and Limitations
Key Advantages of dPCR:
- Absolute quantification without standard curves or extrapolations [51]
- High tolerance to PCR inhibitors due to partitioning and endpoint measurement [51] [52]
- Superior precision from thousands of individual data points per sample [51]
- Improved sensitivity for rare allele detection and low-abundance targets [51]
- High reproducibility across laboratories with reduced amplification efficiency bias [51]
- Cost-efficiency through minimal reagent usage and potential for multiplexing [51]
Important Limitations:
- Limited dynamic range compared to qPCR, constrained by partition count [51]
- Unsuitability for large amplicons due to partitioning constraints [51]
- Potential quantification biases from template linkage, partition volume variance, or molecular dropout [51]
- Higher instrumentation costs compared to standard qPCR systems [51]
- Throughput limitations for some applications compared to high-throughput qPCR [51]
Data Analysis and Partition Classification
Accurate classification of partitions based on end-point fluorescence intensities is crucial for reliable dPCR quantification [55]. As dPCR technology advances, particularly with multiplexing capabilities using multiple fluorescent colors, sophisticated clustering algorithms have been developed to classify partitions automatically [55].
Various clustering methods have been applied to dPCR data analysis, including:
- Partitioning-based methods: k-means, c-means
- Density-based methods: DBSCAN
- Model-based methods: flowClust, flowMerge
- Hierarchical methods: flowSOM
- Graph-based methods: samSPECTRAL
- Ensemble methods: ddPCRclust [55]
The performance of these clustering methods depends on specific data characteristics, including cluster resolution, amount of "rain" (partitions with intermediate fluorescence between clear clusters), target concentration, and partition count [55]. Method selection should be guided by these data characteristics to ensure accurate quantification, particularly in multiplex experiments where multiple targets are quantified simultaneously [55].
Digital PCR represents a significant advancement in nucleic acid quantification technology, offering absolute quantification without calibration curves through its unique combination of sample partitioning, end-point PCR, and Poisson statistics. As a powerful tool within the broader PCR methodology landscape, dPCR enables researchers and clinicians to address challenging applications requiring exceptional sensitivity and precision, particularly for rare mutation detection, copy number variation analysis, and precise viral load monitoring.
While dPCR shares the fundamental temperature cycling process with conventional PCR and qPCR, its partitioning approach and statistical foundation distinguish it as a complementary technology with unique strengths. Ongoing advancements in partitioning technologies, multiplexing capabilities, and data analysis algorithms continue to expand dPCR's applications across biomedical research, clinical diagnostics, and drug development. As the technology evolves toward higher throughput, improved automation, and reduced costs, dPCR is poised to become an increasingly essential tool in the molecular biology laboratory, particularly for applications where the highest level of quantification accuracy and sensitivity is required.
Multiplex Polymerase Chain Reaction (PCR) is an advanced molecular technique that enables the simultaneous amplification of multiple target DNA sequences in a single reaction tube. This is achieved by incorporating more than one pair of primers into the PCR reaction system, with each pair designed to target a distinct sequence [56] [57]. Since its development in 1988, multiplex PCR has revolutionized diagnostic capabilities by allowing for rapid, cost-effective, and comprehensive analysis of multiple genetic targets, saving valuable time, reagents, and samples compared to running multiple individual (uniplex) PCR reactions [56] [57].
The core principle of multiplex PCR is an extension of conventional PCR, relying on cycles of denaturation, annealing, and extension. However, the key difference lies in the careful optimization required to ensure that all primer sets work efficiently together without interference [57]. The technique has found widespread application across diverse fields including infectious disease diagnosis, genetic disorder screening, oncology, forensic science, and food safety testing, establishing itself as a cornerstone of modern molecular biology and diagnostic laboratories [56] [58] [59].
Core Principles and Design Challenges
The fundamental principle of multiplex PCR involves adding multiple primer pairs to a single PCR reaction system to amplify multiple target sequences from the same or different DNA templates [57]. The amplification products are designed to be of different lengths or have distinct characteristics, allowing them to be effectively distinguished during subsequent analysis, typically by agarose gel electrophoresis or melting curve analysis [60] [57].
Despite its conceptual simplicity, designing a robust multiplex PCR assay presents several technical challenges that must be systematically addressed:
- Primer Dimer Formation: The presence of multiple primers in a single reaction increases the probability of spurious amplification products due to interactions between primers themselves. These primer-dimers can consume reaction components and be amplified more efficiently than the desired targets, severely compromising assay sensitivity and specificity [56].
- Preferential Amplification: A common phenomenon in multiplex PCR is the biased amplification of one target sequence over others. This can occur due to stochastic fluctuations in early PCR cycles (PCR drift) or inherent properties of the targets and primers that favor the amplification of certain templates (PCR selection) [56]. Factors influencing this bias include inter-region differences in GC content, secondary structures in the target DNA, primer binding efficiency, and gene copy number [56].
- Competition for Resources: All targets in a multiplex reaction compete for the same pool of reagents—polymerase, nucleotides, and cofactors. Without careful optimization, this can lead to pronounced differences in amplification efficiency among targets, potentially causing some targets to fail amplification entirely [56].
The following diagram illustrates the core workflow and major design challenges in a multiplex PCR assay:
Critical Optimization Parameters
Primer Design
Primer design is the most critical factor determining the success of a multiplex PCR assay. Ideal primers should meet several stringent criteria to ensure uniform amplification efficiency and minimize nonspecific interactions [56] [57].
- Specificity: Each primer pair must be highly specific to its intended target sequence to avoid cross-hybridization. Primers should not display significant homology to non-target sequences or to one another [56].
- Length and Tm: Primers are typically 18-30 bases in length with a GC content of 35-60%. All primers in the reaction should have similar optimum annealing temperatures (generally within 2°C of each other) to ensure efficient simultaneous annealing [56] [57].
- Secondary Structures: Primers should be designed to avoid internal secondary structures, hairpin formations, and self-complementarity, particularly at the 3' ends, as these can dramatically reduce amplification efficiency [57].
- Amplicon Length: Amplification products should be of different sizes to allow for clear resolution during electrophoresis or distinct melting temperatures (differing by at least 1°C) for melt curve analysis [60] [57].
- Computer-Aided Design: The use of specialized software (e.g., Primer3, Oligo) is highly recommended for multiplex primer design. These tools systematically analyze primer properties including Tm, GC content, and potential secondary structures [57].
Reaction Components and Conditions
Optimizing the concentrations of reaction components is essential for balanced amplification of all targets in a multiplex PCR [56].
- Primer Concentration: While standard uniplex PCR often uses primer concentrations of approximately 0.2 μM, multiplex PCR requires fine-tuning of individual primer concentrations (typically ranging from 0.05-0.4 μM). Weaker primers may need higher concentrations while overly efficient primers may require dilution to prevent them from dominating the reaction [57].
- Magnesium Concentration: Magnesium chloride (MgCl₂) is a critical cofactor for DNA polymerase. Its concentration often needs optimization in multiplex PCR, sometimes requiring increases compared to standard uniplex protocols to accommodate multiple amplification events [56].
- Enzyme Concentration: In some cases, particularly for highly multiplexed reactions (e.g., amplifying 9 targets), Taq DNA polymerase concentrations four to five times greater than standard uniplex PCR may be necessary, with corresponding adjustments to MgCl₂ [56].
- PCR Additives: Additives such as dimethyl sulfoxide (DMSO), glycerol, bovine serum albumin (BSA), or betaine can improve multiplex PCR performance by preventing polymerase stalling, reducing secondary structure formation, or acting as destabilizing agents for GC-rich templates [56].
- Annealing Temperature: A critical optimization step involves determining the optimal annealing temperature. A common strategy is to determine the highest possible annealing temperature for each primer pair individually, then use the lowest of these temperatures for the multiplex reaction to ensure all primers can anneal efficiently [57].
Table 1: Key Optimization Parameters for Multiplex PCR Components
| Component | Standard Uniplex PCR | Multiplex PCR Considerations | Optimization Goal |
|---|---|---|---|
| Primers | Single pair at ~0.2 μM | Multiple pairs (0.05-0.4 μM each), balanced concentrations | Balanced amplification efficiency for all targets |
| MgCl₂ | Typically 1.5-2.0 mM | Often increased (2.0-4.0 mM) | Adequate cofactor for multiple polymerase events |
| Taq Polymerase | Standard unit concentration | May require 4-5x increase for highly multiplexed reactions | Sufficient enzyme for multiple simultaneous extensions |
| dNTPs | Standard concentration (200 μM each) | Similar to uniplex, but ensure not limiting | Balanced nucleotide availability for all targets |
| Additives | Often not required | DMSO, glycerol, BSA, or betaine may be beneficial | Reduce secondary structures, stabilize enzymes |
Enhanced Methodologies for Sensitivity and Specificity
Several methodological enhancements have been developed to address common challenges in multiplex PCR:
- Hot Start PCR: This technique prevents polymerase activity until high temperatures are reached, thereby eliminating nonspecific amplification and primer-dimer formation that can occur during reaction setup at lower temperatures [56]. Modern implementations use antibody-based or chemically modified thermostable polymerases that activate only after initial high-temperature incubation.
- Nested PCR: This approach increases sensitivity and specificity by using two sets of primers in sequential reactions. The first set amplifies the target, then a second set binds internal to the first amplicon for further amplification. While highly sensitive, this method requires additional steps and increases contamination risk [56].
- Real-Time Quantitative Multiplex PCR: This methodology allows for simultaneous amplification and detection using fluorescent dyes (e.g., SYBR Green, EvaGreen) or target-specific probes (e.g., TaqMan). EvaGreen dye, a third-generation saturating fluorescent dye, is particularly advantageous for multiplexing as it can be used at higher concentrations without inhibiting PCR and shows equal binding affinity for both GC-rich and AT-rich regions [60]. Melting curve analysis following amplification can distinguish products based on their distinct melting temperatures [60].
Advanced Multiplex PCR Methodologies
Real-Time Quantitative Multiplex PCR
Real-time quantitative PCR (qPCR) adapted for multiplexing represents a significant technological advancement. Unlike conventional multiplex PCR that relies on end-point analysis by electrophoresis, real-time multiplex PCR monitors amplification as it occurs, enabling simultaneous detection and quantification of multiple targets [60]. A 2024 study demonstrated the development of an EvaGreen-based multiplex real-time PCR with melting curve analysis (EG-mPCR) for detecting six bacterial pathogens and fourteen antimicrobial resistance (AMR) genes directly from respiratory specimens [60]. This approach showed 100% sensitivity for K. pneumoniae, A. baumannii, P. aeruginosa, and E. coli, with specificity ranging from 87.5% to 97.6% compared to conventional culture [60].
Specialized Multiplex Formats
- Snapshot Multiplex PCR: This technique utilizes dideoxyribonucleoside triphosphates (ddNTPs) as chain terminators to add a single fluorescently-labeled nucleotide at specific positions, enabling precise sequence identification. It is particularly valuable in forensic science and genetic research where simultaneous analysis of multiple single nucleotide polymorphisms (SNPs) is required—capable of detecting up to 50 different SNP sites in a single reaction [57].
- Anchored Multiplex PCR (AMP-PCR): This method employs a unique primer design with "anchoring" primers that bind to a fixed portion of the target sequence and amplify it with multiple "probe" primers. This significantly improves sensitivity and specificity, with one study reporting 98% sensitivity and 99% specificity for detecting 40 different pathogens [57].
The following diagram illustrates the logical decision process for selecting appropriate multiplex PCR methodologies based on experimental goals:
Research Reagent Solutions
A successful multiplex PCR assay relies on carefully selected and optimized reagents. The following table outlines essential components and their specific functions in the context of multiplex PCR.
Table 2: Essential Research Reagents for Multiplex PCR
| Reagent Category | Specific Examples | Function in Multiplex PCR | Special Considerations |
|---|---|---|---|
| Polymerase | Hot Start Taq DNA polymerase | Catalyzes DNA synthesis; Hot Start prevents nonspecific amplification | May require 4-5x concentration increases for highly multiplexed reactions [56] |
| Primers | Multiple specific oligonucleotide pairs | Target-specific amplification | Length: 18-30 bp; GC: 35-60%; Similar Tm; Balanced concentrations (0.05-0.4 μM each) [56] [57] |
| dNTPs | dATP, dCTP, dGTP, dTTP | Building blocks for DNA synthesis | Ensure sufficient concentration not to become limiting for multiple targets [56] |
| Magnesium | MgCl₂ | Cofactor for DNA polymerase | Critical optimization parameter; often requires increased concentration (2-4 mM) [56] |
| Buffer System | Tris-based buffer with additives | Maintains optimal pH and ionic strength | May require supplementation with additives like DMSO, glycerol, or BSA [56] |
| Fluorescent Detection | EvaGreen, SYBR Green, TaqMan probes | Real-time monitoring and quantification | EvaGreen preferred for multiplexing due to higher saturation without inhibition [60] |
Applications in Research and Diagnostics
Multiplex PCR has become an indispensable tool across various scientific disciplines, with its applications continuously expanding:
- Infectious Disease Diagnostics: Multiplex PCR allows simultaneous detection of multiple pathogens in a single reaction, dramatically reducing diagnostic time. During the COVID-19 pandemic, it was used to detect SARS-CoV-2 alongside influenza A, B, and RSV with a sensitivity of 96.8% and specificity of 97.5% [57]. It has also been successfully applied for detecting central nervous system infections (HSV-1, HSV-2, VZV, CMV), genital infections (N. gonorrhoeae, C. trachomatis), and respiratory pathogens [56] [60].
- Antimicrobial Resistance Detection: A 2024 study developed a multiplex real-time PCR assay to detect fourteen AMR genes alongside pathogen identification, enabling rapid guidance for targeted antibiotic therapy [60].
- Genetic Disorder Diagnosis: Multiplex PCR is used for detecting deletions in large genes, such as in Duchenne muscular dystrophy, where 18 primer pairs target different exons of the dystrophin gene simultaneously [56] [57].
- Food Safety and Environmental Testing: The technology enables rapid screening for multiple foodborne pathogens. For example, a qPCR method was developed for species verification and serogroup determination of Listeria monocytogenes, achieving >98% accuracy in species identification and 96.6% accuracy in molecular serogrouping [59].
- Biotechnology and Fermentation Monitoring: A 2023 study developed a triplex qPCR method using TaqMan probes to simultaneously quantify Clostridium acetobutylicum, Clostridium carboxidivorans, and Clostridium cellulovorans in co-cultures for biofuel production, demonstrating excellent reaction efficiencies (95.1-103.8%) across 6 log units [61].
Multiplex PCR represents a sophisticated evolution of conventional PCR that enables simultaneous detection of multiple nucleic acid targets in a single reaction. While the development of robust multiplex assays requires careful attention to primer design, reaction optimization, and potential amplification biases, the benefits of increased throughput, reduced costs, and conserved sample material make it an invaluable technique in modern molecular biology [56] [57]. Continued methodological advancements in real-time detection, probe chemistry, and automated analysis platforms are further expanding the capabilities and applications of multiplex PCR [60] [61] [58]. As molecular diagnostics continues to advance, multiplex PCR remains a cornerstone technology for comprehensive pathogen detection, genetic screening, and research applications where multiple target analysis is essential for a complete understanding of complex biological systems.
The polymerase chain reaction (PCR) is a foundational technique in molecular biology that enables the enzymatic amplification of specific DNA sequences in vitro. Since its introduction by Kary Mullis in 1985, for which he later received the Nobel Prize in Chemistry, PCR has evolved into one of the most powerful and ubiquitous tools in biological research and clinical diagnostics [6] [11]. This method allows researchers to generate millions to billions of copies of a particular DNA segment from a minimal starting amount, facilitating detection, analysis, and manipulation of genetic material that would otherwise be undetectable [11]. The core principle of PCR relies on thermal cycling, which involves repeated heating and cooling cycles to facilitate three essential steps: DNA denaturation, primer annealing, and enzymatic extension by a DNA polymerase [6].
The revolutionary impact of PCR stems from its incredible sensitivity, specificity, and rapid processing time. Modern PCR can amplify a specific DNA sequence over a million-fold in just a few hours, making it an indispensable technique across diverse fields including clinical diagnostics, forensic analysis, biomedical research, and biotechnology [6] [62]. The subsequent development of reverse transcription PCR (RT-PCR) further expanded its utility to include RNA targets by first converting RNA to complementary DNA (cDNA) using reverse transcriptase, enabling gene expression analysis and detection of RNA viruses [6] [63]. The introduction of thermostable DNA polymerases, particularly Taq DNA polymerase isolated from Thermus aquaticus, proved to be a critical advancement that enabled automation of the thermal cycling process without the need to add fresh enzyme after each denaturation step [11].
Core PCR Methodology
The PCR Cycle: Step-by-Step Mechanism
The standard PCR process consists of three fundamental steps that are repeated for 25-40 cycles in a thermal cycler, an instrument that precisely controls temperature and timing [6] [11]:
Denaturation: The reaction mixture is heated to 94-95°C for 20-30 seconds, causing the double-stranded DNA template to separate into single strands by breaking the hydrogen bonds between complementary bases [6] [64].
Annealing: The temperature is lowered to 55-72°C for 20-40 seconds, allowing short, synthetic oligonucleotide primers (typically 20-25 nucleotides long) to bind specifically to their complementary sequences on the single-stranded DNA templates. The optimal annealing temperature depends on the melting temperature of the primer-template duplex [6].
Extension: The temperature is raised to 72°C, the optimal temperature for thermostable DNA polymerase activity. The polymerase enzyme synthesizes new DNA strands by adding nucleotides to the 3' ends of the annealed primers, using the original DNA strands as templates. The extension time varies from 15 seconds to several minutes depending on the length of the target amplicon [6] [11].
These three steps constitute one PCR cycle, with each cycle theoretically doubling the amount of target DNA. This exponential amplification enables the generation of billions of copies from a single DNA molecule after 30-40 cycles [6]. The process can be visualized through the following workflow:
Essential PCR Components and Reagents
A standard PCR reaction requires several key components, each playing a critical role in the amplification process [6] [64]:
Table 1: Essential Components of a Standard PCR Reaction
| Component | Function | Typical Concentration |
|---|---|---|
| Template DNA | The target DNA sequence to be amplified | 1-100 ng (or 102-105 copies) |
| DNA Polymerase | Thermally stable enzyme that synthesizes new DNA strands | 0.5-2.5 units per 50 μL reaction |
| Primers | Short oligonucleotides that define the start and end points of amplification | 0.1-1.0 μM each primer |
| dNTPs | Deoxynucleotide triphosphates (dATP, dCTP, dGTP, dTTP); building blocks for new DNA strands | 20-200 μM each dNTP |
| Reaction Buffer | Provides optimal ionic environment and pH for polymerase activity | 1X concentration (often with MgCl₂) |
| Magnesium Ions (Mg²⁺) | Essential cofactor for DNA polymerase activity | 1.5-2.5 mM (often optimized) |
DNA polymerases for PCR have evolved significantly since the early use of the Klenow fragment from E. coli, which was heat-sensitive and required replenishment after each denaturation cycle [11]. The discovery of thermostable DNA polymerases, particularly Taq DNA polymerase, revolutionized PCR by enabling automated thermal cycling without manual enzyme addition [11]. While Taq polymerase remains widely used, it lacks 3'→5' proofreading exonuclease activity, resulting in relatively high error rates (approximately 1x10⁻⁴ errors per base pair) [11]. For applications requiring higher fidelity, such as cloning and next-generation sequencing library preparation, proofreading polymerases (e.g., Pfu, Q5) with error rates as low as 1x10⁻⁶ errors per base pair are preferred [65].
Advanced PCR Variations and Their Applications
Real-Time PCR (qPCR) and Reverse Transcription PCR (RT-PCR)
Real-time PCR, also known as quantitative PCR (qPCR), represents a significant advancement over conventional PCR by enabling monitoring of amplification progress as it occurs, rather than just at the endpoint [6] [63]. This technique incorporates fluorescent detection systems that measure DNA accumulation at each cycle during the exponential phase of amplification, when reaction components are not yet limiting [63]. The key quantitative parameter in qPCR is the quantification cycle (Cq), defined as the fractional PCR cycle number at which the reporter fluorescence exceeds a predetermined threshold [6] [63]. Samples with higher starting template concentrations will display lower Cq values, enabling precise quantification through comparison with standard curves [63].
Two main fluorescent detection chemistries are employed in qPCR [6] [63]:
- DNA-binding dyes (e.g., SYBR Green I): These dyes intercalate non-specifically into double-stranded DNA and are simple and cost-effective but may detect non-specific amplification products.
- Sequence-specific probes (e.g., TaqMan probes, molecular beacons): These fluorescently-labeled oligonucleotides provide enhanced specificity through hybridization to internal target sequences and employ fluorescence resonance energy transfer (FRET) mechanisms.
Reverse Transcription PCR (RT-PCR) enables the amplification of RNA targets by first converting RNA to complementary DNA (cDNA) using reverse transcriptase [6] [63]. This can be performed as either a one-step or two-step procedure. In one-step RT-PCR, both reverse transcription and PCR amplification occur sequentially in the same tube, offering simplicity and reduced contamination risk. In two-step RT-PCR, the reactions are performed separately, allowing multiple PCR reactions from a single cDNA synthesis [63]. The combination of reverse transcription with real-time PCR (RT-qPCR) has been particularly valuable for gene expression analysis and viral load detection, as demonstrated during the COVID-19 pandemic where it served as the gold standard for SARS-CoV-2 detection [6] [63].
Digital PCR (dPCR) and Immuno-PCR
Digital PCR (dPCR) represents a further refinement of PCR technology that provides absolute quantification of nucleic acids without requiring standard curves [66]. In dPCR, the reaction mixture is partitioned into thousands of individual reactions, with each partition containing either zero or one (or few) target molecules. After endpoint PCR amplification, the fraction of positive partitions is counted, allowing absolute quantification of the initial target concentration using Poisson statistics [66]. Digital droplet PCR (ddPCR) is a common implementation that uses water-oil emulsion droplets to create these partitions [67].
Immuno-PCR (I-PCR) is a hybrid technique that combines the specificity of immunoassays with the exponential amplification power of PCR [67]. This method uses antibody-DNA conjugates to detect protein antigens, where the DNA segment serves as a reporter molecule that can be amplified by PCR after antigen-antibody binding. I-PCR achieves remarkable sensitivity, with detection limits reaching femtogram levels—up to 105-fold more sensitive than traditional enzyme-linked immunosorbent assays (ELISA) [67]. Despite its exceptional sensitivity, I-PCR faces challenges for clinical implementation due to procedural complexity, potential background signal amplification, and reliance on specialized equipment [67].
PCR in Disease Diagnostics
PCR has revolutionized clinical diagnostics by enabling rapid, sensitive, and specific detection of pathogens that are difficult or impossible to culture using conventional methods [6] [62]. The technique has become the gold standard for diagnosing numerous bacterial, viral, fungal, and parasitic infections, significantly reducing turnaround times from days or weeks to mere hours [6] [62].
Infectious Disease Detection
In clinical microbiology, PCR-based methods allow direct detection of microbial nucleic acids in patient specimens without the need for culture, facilitating early diagnosis and intervention [6] [62]. This is particularly valuable for fastidious pathogens like Mycobacterium tuberculosis, Treponema pallidum (syphilis), and Borrelia burgdorferi (Lyme disease), which are difficult to culture or cannot be cultured routinely [62] [67]. PCR also enables detection in patients who have received antibiotics, which would typically inhibit culture-based methods [62].
During the COVID-19 pandemic, RT-PCR served as the primary diagnostic method for detecting SARS-CoV-2 RNA in upper respiratory tract specimens collected via nasopharyngeal swabs, oropharyngeal swabs, nostrils, oral cavity samples, or bronchoalveolar lavage [6]. The quantification cycle (Cq) values obtained not only provide qualitative detection but can also help assess viral load, which correlates with disease severity and transmission risk [6]. Serial PCR testing allows clinicians to monitor disease progression and evaluate recovery by tracking changes in Cq values over time [6].
Table 2: Applications of PCR in Infectious Disease Diagnostics
| Pathogen Category | Representative Pathogens | Clinical Significance |
|---|---|---|
| Viruses | HIV, HSV, SARS-CoV-2, HPV, Hepatitis B/C, CMV, VZV | Gold standard for diagnosis, viral load monitoring, treatment response assessment |
| Bacteria | Mycobacterium tuberculosis, Chlamydia trachomatis, Neisseria meningitidis, Listeria monocytogenes | Rapid detection of fastidious organisms, antibiotic resistance profiling |
| Fungi | Aspergillus fumigatus, Aspergillus flavus | Early invasive fungal infection detection in immunocompromised patients |
| Parasites | Toxoplasma gondii, Cryptosporidium parvum | Sensitive detection in immunocompromised hosts, congenital infection diagnosis |
Genetic Disease and Cancer Diagnostics
Beyond infectious diseases, PCR plays a crucial role in diagnosing genetic disorders and cancer. Applications include [6] [68]:
- Genetic screening for inherited disorders like cystic fibrosis, Huntington's disease, and fragile X syndrome through detection of disease-associated mutations
- Prenatal genetic testing for carrier status and in utero detection of genetic abnormalities
- Cancer diagnostics including detection of lymphoma, identification of oncogenic mutations (e.g., BRCA1/2), and monitoring of minimal residual disease
- Pharmacogenetic testing to predict therapeutic response and adverse events to guide personalized treatment decisions
The exquisite sensitivity of PCR (capable of detecting 1-100 ng of DNA or RNA) enables detection of minimal residual disease in cancer patients and identification of low-frequency mutations in heterogeneous tumor samples [6]. In oncology, PCR-based tests can identify specific genetic alterations in tumors that predict response to targeted therapies, supporting precision medicine approaches [66] [68].
PCR in Pharmaceutical Development
The pharmaceutical industry extensively utilizes PCR technologies throughout the drug development pipeline, from target identification and validation to preclinical testing and clinical trial monitoring [66].
Supporting Gene and Cell Therapies
PCR has become indispensable for the development and quality control of advanced therapeutic modalities, particularly adeno-associated virus (AAV)-based gene therapies [66]. Applications in this domain include:
- Biodistribution studies: PCR helps track AAV vector distribution in tissues following administration in preclinical models [66].
- Response monitoring: PCR assays quantitatively measure vector-derived RNA levels in patients receiving gene therapies [66].
- Quality control: PCR ensures the integrity and correct construction of viral vectors and genetically modified cells [66].
Supporting Small Molecule Drug Development
For traditional small molecule pharmaceuticals, PCR provides critical insights into mechanisms of action, efficacy, and toxicity [66]:
- Mechanism of action studies: qPCR and RT-qPCR measure gene expression changes in response to drug treatment, helping elucidate pharmacological mechanisms [66].
- Biomarker identification: PCR facilitates discovery of molecular biomarkers linked to drug efficacy or toxicity [66].
- Pathway analysis: PCR enables tracking of downstream effects of small molecule inhibitors on signal transduction pathways and gene regulatory networks [66].
Immuno-PCR for Therapeutic Monitoring
The exceptional sensitivity of Immuno-PCR makes it valuable for pharmacokinetic studies during drug development, particularly for monitoring low-abundance protein biomarkers and therapeutic proteins [67]. I-PCR can detect analytes at concentrations 10- to 10,000-fold lower than conventional ELISA, enabling more precise assessment of drug exposure and pharmacodynamic effects [67].
PCR in Next-Generation Sequencing (NGS) Library Preparation
PCR plays a critical role in next-generation sequencing workflows, particularly during library preparation where it amplifies adapter-ligated DNA fragments to generate sufficient material for sequencing [65]. The choice of DNA polymerase in this step significantly impacts sequencing data quality, as PCR artifacts and biases can introduce errors and uneven coverage [65].
Key Considerations for NGS Library Amplification
Two primary factors must be considered when selecting a DNA polymerase for NGS library preparation [65]:
Fidelity: The accuracy of DNA synthesis is paramount for NGS applications, especially when detecting low-frequency mutations in cancer genomics or microbial populations. High-fidelity polymerases with proofreading capability (3'→5' exonuclease activity) minimize errors during amplification, resulting in more accurate sequencing data and reducing the sequence coverage required for confident variant calling [65].
GC Bias: Some DNA polymerases exhibit sequence-dependent amplification efficiency, particularly struggling with GC-rich regions. This GC bias leads to uneven representation of sequences in the final library, potentially resulting in missing regions from assembled sequences, inaccurate sequence due to low coverage in certain areas, and problems with sequence assembly due to uneven representation [65]. GC bias particularly affects coverage of 5' untranslated regions (5' UTRs) and CpG islands, which are biologically significant genomic elements [65].
Impact of Polymerase Selection on NGS Data Quality
The selection of appropriate PCR enzymes for NGS library preparation directly influences data quality and experimental outcomes. Polymerases optimized for NGS applications minimize both amplification errors and GC bias, ensuring more comprehensive and accurate sequence representation [65]. Dedicated NGS polymerases have been developed specifically to address these challenges, providing balanced amplification across diverse GC content and maintaining high fidelity through proofreading activity [65].
Automated PCR systems have been developed to streamline NGS library preparation, integrating thermal cyclers with liquid handlers, sealers, and centrifuges in work cell configurations to improve reproducibility and throughput while reducing manual labor [69]. These automated workflows ensure consistent PCR conditions critical for maintaining library quality and diversity in NGS applications [69].
Technical Protocols and Methodologies
Standard PCR Protocol
A basic PCR protocol using Taq DNA polymerase typically includes the following steps [64]:
- Reaction Setup: Combine template DNA (1-100 ng), primers (0.1-1.0 μM each), dNTPs (20-200 μM each), reaction buffer (1X), magnesium chloride (1.5-2.5 mM), and Taq DNA polymerase (0.5-2.5 units) in a total reaction volume of 20-50 μL.
- Thermal Cycling:
- Initial denaturation: 94-95°C for 2-5 minutes
- 25-40 cycles of:
- Denaturation: 94-95°C for 20-60 seconds
- Annealing: 55-72°C for 20-60 seconds
- Extension: 72°C for 15-60 seconds per kb of amplicon
- Final extension: 72°C for 5-10 minutes
- Hold: 4°C indefinitely
- Product Analysis: Analyze amplified DNA by agarose gel electrophoresis with ethidium bromide staining and visualize under UV light [64].
Real-Time PCR Protocol
A typical SYBR Green-based qPCR protocol includes [6] [63]:
- Reaction Setup: Prepare reactions containing template DNA, primers, dNTPs, reaction buffer, magnesium chloride, DNA polymerase, and SYBR Green I dye.
- Thermal Cycling and Detection:
- Initial denaturation: 95°C for 2-10 minutes
- 40-50 cycles of:
- Denaturation: 95°C for 15-30 seconds
- Annealing/Extension: 60-72°C for 30-60 seconds with fluorescence acquisition
- Melt curve analysis: 65-95°C with continuous fluorescence monitoring
- Data Analysis: Determine Cq values using instrument software and quantify targets using standard curves or comparative Cq methods [6] [63].
Critical Optimization Parameters
Several parameters often require optimization for specific PCR applications [64]:
- Magnesium concentration: Titrate MgCl₂ between 1.0-4.0 mM as it significantly affects primer annealing, enzyme activity, and specificity
- Annealing temperature: Optimize based on primer melting temperatures, typically testing 3-5°C below calculated Tm
- Primer design: Ensure primers are 18-25 nucleotides long with balanced GC content (40-60%) and minimal self-complementarity or dimerization potential
- Template quality: Use high-quality, intact DNA/RNA free of inhibitors such as phenol, EDTA, heparin, hemoglobin, or ionic detergents [6]
Essential Research Reagent Solutions
Successful PCR experimentation requires carefully selected reagents and components. The following table outlines key solutions and their specific functions in PCR workflows:
Table 3: Essential Research Reagent Solutions for PCR Applications
| Reagent Category | Specific Examples | Function and Application Notes |
|---|---|---|
| Thermostable DNA Polymerases | Taq polymerase, Pfu, Q5 | DNA synthesis with varying fidelity and thermal stability profiles; selection depends on application requirements |
| Specialized PCR Buffers | GC-rich buffers, additive cocktails | Optimize amplification efficiency for challenging templates like high-GC content regions |
| dNTP Mixes | PCR-grade dNTP sets | Provide nucleotide building blocks with high purity and accurate concentration |
| PCR Primers | Target-specific oligonucleotides | Define amplification targets; require careful design to ensure specificity and appropriate melting temperature |
| Reverse Transcriptases | MMLV-RT, SuperScript series | Convert RNA to cDNA for RT-PCR and qRT-PCR applications |
| Fluorescent Detection Reagents | SYBR Green, TaqMan probes, molecular beacons | Enable real-time monitoring and quantification in qPCR applications |
| NGS Library Preparation Kits | NEBNext, Illumina DNA Prep | Integrated solutions incorporating high-fidelity polymerases optimized for NGS |
| PCR Cleanup & Purification Kits | Silica membrane columns, magnetic beads | Remove enzymes, primers, and contaminants post-amplification |
PCR technology has evolved tremendously from its initial conception as a simple DNA amplification method to become an indispensable tool across diverse scientific disciplines. In disease diagnostics, PCR provides rapid, sensitive detection of pathogens and genetic abnormalities, enabling timely clinical interventions. In pharmaceutical development, PCR supports target validation, mechanism of action studies, and therapeutic monitoring for both traditional small molecules and advanced biologics. In genomics research, PCR facilitates NGS library preparation with fidelity and representation critical for generating high-quality sequencing data.
Ongoing advancements in PCR methodologies, including digital PCR, immuno-PCR, and isothermal amplification, continue to expand its applications and accessibility. The development of automated PCR work cells further enhances reproducibility and throughput for high-demand applications like NGS library preparation [69]. As molecular diagnostics and personalized medicine continue to advance, PCR will undoubtedly remain a cornerstone technology, with its basic principles of specific nucleic acid amplification continuing to drive innovations in research and clinical practice.
PCR Troubleshooting and Optimization: A Scientist's Practical Guide
Within the framework of researching the fundamental steps of a PCR cycle—denaturation, annealing, and extension—scientists often encounter procedural hurdles that can confound experimental results. The polymerase chain reaction (PCR), while a cornerstone technique in molecular biology, is susceptible to specific issues that directly impact its efficiency and reliability. This guide provides an in-depth examination of three common PCR challenges—failure to produce a product, the appearance of non-specific bands, and the formation of primer-dimers—by anchoring them to the specific stages of the PCR cycle where they originate. Understanding these problems within the context of the PCR cycle is critical for researchers and drug development professionals to achieve specific, high-yield amplification for downstream applications.
The polymerase chain reaction is a biochemical process that amplifies a single DNA molecule into millions of copies through repeated thermal cycling. Each cycle consists of three core steps, and the precise execution of each is critical for successful amplification [11].
- Denaturation: The double-stranded DNA template is heated to a high temperature (typically 94–98°C) to separate it into single strands, making them accessible for primer binding [16].
- Annealing: The reaction temperature is lowered (typically 45–65°C) to allow short DNA primers to bind (anneal) to their complementary sequences on the single-stranded template DNA, flanking the target region [42] [16].
- Extension: The temperature is raised to the optimal temperature for the DNA polymerase (usually 70–75°C). The enzyme extends the 3' end of each primer, synthesizing a new complementary DNA strand using dNTPs [16] [11].
These steps are repeated for 25-40 cycles, leading to the exponential amplification of the target DNA sequence [70] [16]. The following diagram illustrates this cyclical process and its exponential output.
Problem 1: No Amplification Product
The complete absence of a desired PCR product after gel electrophoresis is a frequent issue, often stemming from problems in one or more steps of the PCR cycle.
Root Causes and Diagnostic Strategies
A systematic approach to troubleshooting should begin with verifying the integrity and concentration of the DNA template. Common causes include:
- Template DNA Issues: Degraded DNA, insufficient quantity, or the presence of inhibitors (e.g., residual phenol, EDTA, or salts) can prevent amplification [71]. Assess DNA integrity by gel electrophoresis and ensure purity via spectrophotometry.
- Primer Design and Quality: Primers with poor specificity, secondary structures (e.g., hairpins), or low melting temperatures (Tm) can fail to anneal correctly [42]. Verify primer sequences using design tools and ensure they are resuspended and stored correctly to prevent degradation [71].
- Reaction Components: Inactive or insufficient DNA polymerase, inaccurate Mg²⁺ concentration, or unbalanced dNTPs can halt the extension step [71]. Always include a positive control to isolate the problem to the reaction setup.
Experimental Optimization Protocol
To resolve "no product" results, follow this targeted optimization workflow, focusing on the annealing and extension steps of the PCR cycle.
Detailed Methodologies:
- Annealing Temperature Optimization: The annealing temperature is critical for specific primer binding. Calculate the Tm of each primer. A simple formula is Tm = 4(G + C) + 2(A + T) °C [16]. Using a gradient thermal cycler, test a range of annealing temperatures from 3–5°C below the lowest Tm to up to the extension temperature. Incremental adjustments of 2–3°C can significantly improve yield [71] [16].
- Mg²⁺ Concentration Titration: Mg²⁺ is a cofactor for DNA polymerase and its concentration directly affects enzyme activity and fidelity. Prepare a series of reactions with Mg²⁺ concentrations varying from 0.5 mM to 5.0 mM in 0.5 mM increments [42]. The optimal concentration is often between 1.5 and 2.5 mM, but this must be determined empirically for each primer-template system.
- Polymerase and Additives for Difficult Templates: For GC-rich templates or those with secondary structures, use DNA polymerases with high processivity and supplement the reaction with additives. DMSO (1-10%), formamide (1.25-10%), or betaine (0.5 M to 2.5 M) can help denature stable secondary structures [71] [42]. For long targets (>5 kb), use polymerases specifically designed for long-range PCR and extend the extension time according to the amplicon length [71].
Problem 2: Non-Specific Amplification
Non-specific amplification results in multiple bands or a smear on an agarose gel, indicating that primers have bound to incorrect sequences and amplified non-target regions.
Root Causes and Diagnostic Strategies
This problem is primarily linked to suboptimal conditions during the annealing step.
- Low Annealing Temperature: An annealing temperature that is too low permits primers to bind to sequences with partial complementarity [16].
- Excessive Reaction Components: Too much DNA template, primers, or DNA polymerase can promote off-target binding and extension [71].
- Primer Design Flaws: Primers with low specificity or homologous regions to other sequences in the template genome are a common source [71].
Experimental Optimization Protocol
The primary strategy for eliminating non-specific products is to increase the stringency of the PCR reaction.
- Increase Annealing Temperature: Raise the annealing temperature in increments of 2–3°C. The optimal temperature is usually no less than 3–5°C below the lowest primer Tm [71]. Employ a gradient thermal cycler for efficient optimization.
- Touchdown PCR: This technique uses an initial annealing temperature higher than the calculated Tm, then gradually decreases it in subsequent cycles. This ensures that only the most specific primer-template hybrids are amplified during the early cycles, enriching the desired product [71].
- Optimize Primer and Template Concentration: Reduce primer concentrations to within the optimal range of 0.1–1 μM [71]. Similarly, ensure the template DNA input is within the recommended range (e.g., 1-1000 ng for genomic DNA) to prevent off-target binding [42].
- Use Hot-Start DNA Polymerase: Hot-start polymerases remain inactive until a high-temperature activation step, preventing non-specific priming and primer-dimer formation that can occur during reaction setup at lower temperatures [71] [72].
Table 1: Troubleshooting Non-Specific Bands and Primer-Dimers
| Problem | Primary Cause | Optimization Strategy | Key Experimental Parameter to Adjust |
|---|---|---|---|
| Non-Specific Bands | Low annealing temperature [16] | Increase annealing temperature; Use touchdown PCR [71] | Increase by 2–3°C increments; Start 5-10°C above Tm |
| Excessive Mg²⁺ [71] | Titrate Mg²⁺ concentration | Decrease Mg²⁺ in 0.5 mM increments | |
| High primer concentration [71] | Optimize primer concentration | Reduce to 0.1–0.5 μM | |
| Primer-Dimers | Complementary 3' ends in primers [72] [42] | Redesign primers with software tools | Ensure no 3' complementarity; Use online design tools [42] |
| Low annealing temperature [72] | Increase annealing temperature | Increase by 2–3°C increments | |
| Slow reaction setup [72] | Use hot-start DNA polymerase | Choose a validated hot-start enzyme |
Problem 3: Primer-Dimer Formation
Primer-dimers are short, unintended DNA fragments that form when primers anneal to each other via complementary sequences, particularly at their 3' ends, rather than to the template DNA. They are a major consumptive artifact that can deplete reaction reagents [72] [73].
Root Causes and Diagnostic Strategies
Primer-dimer formation is often a consequence of primer design and reaction setup conditions.
- Primer Design: The most common cause is self-complementarity or cross-complementarity between the forward and reverse primers, especially at the 3' ends [42] [74].
- Low Annealing Temperature: Similar to non-specific amplification, low temperatures facilitate primer-primer annealing [72].
- Activity at Low Temperature: Standard DNA polymerases can exhibit activity during reaction setup at room temperature, extending any primed hybrids, including primer-dimers [72].
A critical diagnostic tool is the No-Template Control (NTC), where water is used in place of DNA template. Amplification in the NTC indicates primer-dimer formation [72]. On a gel, primer-dimers appear as a fuzzy smear or a single sharp band below 100 bp [72].
Experimental Optimization Protocol
- Primer Redesign: This is the most effective long-term solution. Use primer design software (e.g., NCBI Primer-BLAST) to ensure primers have no self-complementarity or 3' end complementarity with their partner. Key design characteristics include:
- Lower Primer Concentration: Reducing primer concentration lowers the probability of primer-primer interactions. Test concentrations between 0.1 and 0.5 μM [71] [72].
- Use Hot-Start DNA Polymerase: Hot-start enzymes are essential for preventing primer-dimer formation during reaction setup. They are inactive until a high-temperature activation step (e.g., 95°C) is applied at the start of cycling [71] [72].
- Advanced Techniques: For highly challenging applications like multiplex PCR or SNP detection, Self-Avoiding Molecular Recognition Systems (SAMRS) can be employed. SAMRS are modified nucleobases that pair with natural bases but not with other SAMRS, effectively preventing primer-primer interactions [73].
Advanced Strategies and the Scientist's Toolkit
For persistent problems, integrated strategies and specialized reagents are required.
The Scientist's Toolkit: Essential Reagent Solutions
Table 2: Key Research Reagent Solutions for PCR Optimization
| Reagent / Solution | Function in PCR Optimization | Example Use Cases |
|---|---|---|
| Hot-Start DNA Polymerase | Prevents enzymatic activity during reaction setup, reducing primer-dimer and non-specific amplification [71] [72]. | Essential for all PCR assays; critical for high-sensitivity and multiplex applications. |
| PCR Additives/Co-solvents (e.g., DMSO, Betaine) | Disrupts DNA secondary structures, lowers melting temperature of duplexes [71] [42]. | Amplification of GC-rich templates (>65%) or templates with strong secondary structures. |
| High-Fidelity DNA Polymerase | Possesses 3'→5' proofreading (exonuclease) activity, reducing error rates during amplification [71]. | PCR products for cloning, sequencing, and site-directed mutagenesis. |
| PCR Optimization Kits | Pre-formulated kits with buffers of varying pH, Mg²⁺, and stabilizers for systematic optimization. | First-line troubleshooting when the source of PCR failure is unknown. |
| SAMRS-modified Primers | Modified nucleotides that bind to natural DNA but not to each other, preventing primer-dimer formation [73]. | Demanding applications such as highly multiplexed PCR and sensitive SNP detection. |
Comprehensive Workflow for PCR Optimization
The following diagram integrates the strategies for all three common problems into a single, systematic troubleshooting workflow.
Successful PCR amplification is a cornerstone of modern biological research and diagnostic development. The common problems of no product, non-specific bands, and primer-dimers are not independent failures but rather direct consequences of suboptimal conditions within the denaturation, annealing, and extension steps of the PCR cycle. By systematically addressing these issues through rigorous primer design, precise optimization of thermal cycling parameters, and the strategic use of specialized enzymes and reagents, researchers can transform a failed reaction into a robust and reliable assay. This systematic, cycle-focused approach to troubleshooting ensures that PCR remains a powerful and precise tool for scientific discovery and innovation.
Within the broader context of polymerase chain reaction (PCR) cycle research, the design of oligonucleotide primers is a critical foundational step that dictates the success and efficiency of the entire amplification process [75]. PCR, a technique developed by Kary Mullis in the 1980s, relies on repeated temperature cycles to exponentially amplify specific DNA sequences [11] [6]. At the heart of this method are primers—short, single-stranded DNA fragments that define the start and end points of the amplification target [76]. Proper primer design ensures optimal specificity, yield, and accuracy, which is particularly crucial for sensitive applications in diagnostic, research, and drug development settings [6] [77]. This technical guide provides an in-depth examination of the core principles for designing high-quality PCR primers, focusing on the critical parameters of melting temperature (Tm), GC content, and specificity.
Core Principles of Primer Design
Well-designed primers are fundamental to PCR success. Several interconnected physical and chemical parameters must be balanced to ensure primers bind efficiently and specifically to the target sequence.
Primer Length
The length of a primer directly influences its specificity and hybridization efficiency [78].
- Optimal Range: Primers should generally be 18 to 30 nucleotides long [75] [78]. Within this range, shorter primers (18-24 bases) are often preferred as they anneal more efficiently to the target sequence [78].
- Specificity vs. Efficiency: While longer primers can offer higher specificity, they hybridize more slowly and may reduce amplicon yield. Excessively short primers risk binding to non-target sites, leading to nonspecific amplification [78].
Melting Temperature (Tm)
The melting temperature (Tm) is the temperature at which 50% of the primer-DNA duplex dissociates into single strands. It is a key determinant for selecting the appropriate annealing temperature (Ta) for the PCR protocol [78].
- Optimal T
m: Aim for a primer Tmof 54°C to 65°C or higher [75] [78]. - Primer Pair Matching: The forward and reverse primers should have T
mvalues within ≤5°C of each other to ensure synchronized binding during the annealing step [75] [16]. - Calculating T
m:- Basic Rule:
Tm = 4(G + C) + 2(A + T)[79] [16]. This simple formula counts the number of each nucleotide. - Advanced Calculation: For greater accuracy, the nearest-neighbor method is used, which accounts for the sequence context and buffer conditions:
Tm = 81.5 + 16.6(log[Na+]) + 0.41(%GC) – 675/primer length[78] [16].
- Basic Rule:
GC Content
GC content refers to the percentage of guanine (G) and cytosine (C) bases in the primer. These bases form three hydrogen bonds, creating a stronger hold than the two bonds formed by adenine (A) and thymine (T) [78].
- Optimal Range: Maintain a GC content between 40% and 60% [75] [78].
- GC Clamp: Include a G or C base at the 3' end of the primer. This "GC clamp" strengthens binding at the critical point where DNA synthesis begins. However, avoid more than 3 G or C bases in the last five 3' nucleotides, as this can promote non-specific binding [75] [78].
Specificity and Secondary Structures
To ensure primers amplify only the intended target, avoid sequences that promote secondary structures or non-specific interactions.
- Hairpins: Caused by intramolecular complementarity within the primer itself. Keep the "self 3′-complementarity" parameter low [78].
- Self-Dimers: Form when two copies of the same primer hybridize together [78].
- Cross-Dimers: Occur when the forward and reverse primers bind to each other. Minimize "self-complementarity" and "inter-primer homology" to prevent this [75].
- Repetitive Sequences: Avoid runs of 4 or more identical bases (e.g., AAAA) or dinucleotide repeats (e.g., ATATAT), as they can misprime and cause synthesis issues [75].
Table 1: Summary of Key Primer Design Parameters
| Parameter | Optimal Guideline | Rationale & Impact |
|---|---|---|
| Length | 18–30 nucleotides [75] [78] | Balances hybridization efficiency with sufficient specificity. |
Melting Temperature (Tm) |
54°C–65°C; paired primers within ≤5°C [75] [78] [16] | Ensures both primers anneal to the template efficiently at the same temperature. |
| GC Content | 40%–60% [75] [78] | Provides stable primer-template binding without excessively high Tm. |
| GC Clamp | G or C at the 3' end; avoid >3 in last 5 bases [75] [78] | Stabilizes the binding of the critical 3' end where polymerase initiates synthesis. |
| Secondary Structures | Avoid hairpins, self-dimers, and cross-dimers [75] [78] | Prevents primers from self-annealing or annealing to each other instead of the template. |
The following diagram illustrates how these core design principles are integrated into the broader PCR experimental workflow to ensure successful amplification.
Experimental Protocols for Validation
After in silico design, primers must be validated and optimized experimentally. Key methodologies include optimizing the annealing temperature and reaction components.
Annealing Temperature Optimization
The calculated Tm provides a starting point, but the optimal annealing temperature (Ta) must be determined empirically [16].
- Initial T
aSelection: Begin with a Tathat is 3–5°C below the lowest Tmof the primer pair [16]. - Gradient PCR: Use a thermal cycler with a gradient function to test a range of annealing temperatures (e.g., 50–65°C) in a single run. The ideal T
aproduces a strong, specific band with no non-specific products [16]. - Touchdown PCR: This technique starts with an annealing temperature 1–2°C above the estimated T
mand decreases it by 1–2°C every cycle or every few cycles for the first 10-15 cycles. This approach enriches for the specific target early in the reaction, which then out-competes non-specific products in later cycles [79].
Reaction Component Titration
The concentrations of various PCR components significantly impact specificity and yield [79].
- Magnesium Concentration: Mg²⁺ is a cofactor for DNA polymerase. The optimal concentration for Taq polymerase is typically 1.5–2.0 mM. If specificity is poor, try adjusting in 0.5 mM increments [79].
- Primer Concentration: A final concentration of 0.1–0.5 µM for each primer is standard. High concentrations can increase non-specific binding and primer-dimer formation [79].
- dNTP Concentration: Use 50–200 µM of each dNTP. Higher concentrations can reduce fidelity, while lower concentrations may decrease yield [79].
Table 2: Essential Research Reagent Solutions for PCR Optimization
| Reagent / Material | Function / Role in PCR | Considerations for Optimization |
|---|---|---|
| Thermostable DNA Polymerase | Enzyme that synthesizes new DNA strands by adding dNTPs to the primer's 3' end [11]. | Choice affects fidelity and processivity. Taq is common; Pfu offers higher proofreading [79]. |
| dNTP Mix | The building blocks (dATP, dCTP, dGTP, dTTP) for synthesizing new DNA [76]. | Concentration balance is critical; typically 50-200 µM each. Avoid excess to maintain fidelity [79]. |
| PCR Buffer with MgCl₂ | Provides the optimal chemical environment (pH, salts) for polymerase activity. Mg²⁺ is an essential cofactor [16]. | Mg²⁺ concentration is a key variable; it often requires titration (e.g., 1.5-2.5 mM) [79]. |
| Template DNA | The sample containing the target sequence to be amplified [76]. | Purity and quantity are critical. Use 1 ng (plasmid) to 1 µg (genomic DNA). Inhibitors affect efficiency [79]. |
| Oligonucleotide Primers | Short sequences that define the start and end of the DNA segment to be amplified [76]. | This guide's focus; purity, concentration, and design are paramount for success [75] [79]. |
Advanced Tools and Considerations
Modern molecular biology leverages sophisticated software and deep learning to overcome complex challenges in primer design, especially for advanced applications.
Primer Design and Specificity Tools
- NCBI Primer-BLAST: A gold-standard public tool that combines primer design with specificity checking. It screens candidate primers against a selected database to ensure they will only amplify the intended target, avoiding off-target amplification [80].
- Commercial Tools: Many oligonucleotide suppliers and software companies offer reliable design tools that calculate T
musing the nearest-neighbor method and check for secondary structures [78].
Addressing Amplification Bias in Complex Assays
In multi-template PCR, used in applications like metabarcoding and next-generation sequencing library preparation, even small differences in sequence-specific amplification efficiencies can drastically skew results [77]. Recent research uses deep learning models, such as one-dimensional convolutional neural networks (1D-CNNs), to predict a sequence's amplification efficiency based solely on its composition. These models can identify motifs near priming sites that lead to poor amplification, enabling the design of amplicon libraries with more uniform coverage [77].
The meticulous optimization of primer design parameters—melting temperature, GC content, and specificity—is a critical determinant of success in PCR-based research. Adherence to established guidelines for length, Tm matching, and avoidance of secondary structures provides a robust foundation. However, this in silico design is only the first step; it must be coupled with rigorous experimental validation through temperature gradients and reaction component titration. As PCR technologies evolve to encompass more complex applications like multi-template amplification and quantitative analysis, the principles of good primer design remain paramount. For researchers in drug development and scientific discovery, mastering these guidelines ensures the generation of reliable, specific, and efficient amplification data, thereby supporting the integrity and advancement of their work.
Within the broader framework of polymerase chain reaction (PCR) research, the refinement of reaction conditions represents a pivotal step in achieving reliable and reproducible results. The PCR cycle, comprising denaturation, annealing, and extension, is deceptively simple in concept yet complex in its practical optimization [6]. Among the numerous factors influencing the outcome, the concentration of magnesium ions (Mg²⁺) and the annealing temperature (Ta) stand out as two of the most critical parameters dictating the specificity, efficiency, and yield of the amplification reaction [17]. Incorrect optimization of these factors can lead to a complete absence of product, the formation of non-specific bands, or the creation of primer-dimers, thereby compromising the integrity of the experiment [17]. This guide provides an in-depth technical examination of Mg²⁺ concentration and annealing temperature, offering researchers and drug development professionals detailed methodologies and evidence-based protocols for fine-tuning these essential parameters.
The Fundamental Role of Mg2+ in PCR
Magnesium chloride (MgCl₂) serves as an indispensable cofactor for thermostable DNA polymerases. Its role extends beyond enzyme activation to influencing the overall thermodynamics of the PCR reaction [81]. Mg²⁺ ions stabilize the double-stranded DNA structure by neutralizing the negative charges on the phosphate backbone, thereby affecting the melting temperature (Tm) of the template and the primers. Consequently, the Mg²⁺ concentration directly impacts the stringency of primer annealing and the fidelity of the amplification process.
Quantitative Effects and Optimal Concentration Ranges
A recent comprehensive meta-analysis of 61 peer-reviewed studies provides quantitative insights into the effects of MgCl₂ [81]. The analysis established a clear logarithmic relationship between MgCl₂ concentration and DNA melting temperature. The research identified an optimal concentration range between 1.5 and 3.0 mM for most standard PCR applications [81]. Within this range, every 0.5 mM increase in MgCl₂ was associated with an average increase of 1.2 °C in the melting temperature of the DNA duplex.
The complexity of the template DNA significantly influences the optimal Mg²⁺ requirement. The same meta-analysis found that genomic DNA templates necessitate higher Mg²⁺ concentrations than simpler templates, such as plasmids or PCR products [81]. This is attributed to the greater structural complexity and size of genomic DNA, requiring more ions to stabilize the duplex and facilitate efficient polymerase binding and processivity.
Table 1: Effects of MgCl2 Concentration on PCR Performance
| MgCl2 Concentration | Impact on PCR Efficiency | Impact on Specificity | Recommended Use Case |
|---|---|---|---|
| < 1.5 mM | Drastically reduced; may result in no amplification | High, but yield is too low | Not generally recommended; may occur in specialized low-salt buffers |
| 1.5 - 3.0 mM | Optimal for most applications [81] | High, with proper optimization | Standard PCR, routine amplification of various templates |
| > 3.0 mM | May increase yield but promotes error-prone synthesis | Decreased; leads to non-specific bands and primer-dimers [17] | Can be tested for difficult templates (e.g., high GC-content) |
Experimental Protocol for Mg2+ Titration
A systematic titration is the most reliable method for determining the optimal Mg²⁺ concentration for a specific primer-template system.
Materials:
- 10X PCR Buffer (without MgCl₂)
- MgCl₂ Stock Solution (e.g., 25 mM or 50 mM)
- Template DNA (good quality, 1–100 ng for genomic DNA) [17]
- Primers (0.2–1 µM each) [17]
- DNA Polymerase
- dNTP Mix
- Nuclease-free Water
Method:
- Prepare a master mix containing all PCR components except the MgCl₂ and template DNA.
- Aliquot the master mix into multiple PCR tubes.
- Add MgCl₂ from the stock solution to each tube to create a concentration gradient. A recommended series is 1.0, 1.5, 2.0, 2.5, 3.0, 3.5, and 4.0 mM [17] [81].
- Add the template DNA to each tube.
- Run the PCR using a standardized thermal cycling protocol with a pre-optimized or gradient annealing temperature.
- Analyze the PCR products using agarose gel electrophoresis.
Interpretation: Identify the Mg²⁺ concentration that produces the highest yield of the desired specific product with the least or no non-specific amplification. Higher concentrations often increase yield but at the cost of specificity, while lower concentrations enhance specificity but may reduce yield [17].
The Criticality of Annealing Temperature
The annealing temperature (Ta) is the temperature at which primers bind to their complementary sequences on the single-stranded DNA template. This parameter is arguably the most important determinant of PCR specificity. A Ta that is too low permits primers to bind to non-target sequences with partial complementarity, leading to spurious amplification. Conversely, a Ta that is too high reduces priming efficiency, as the primer-template duplex becomes less stable, resulting in low or no yield [16] [82].
Calculating and Optimizing Annealing Temperature
The annealing temperature is intrinsically linked to the melting temperature (Tm) of the primers, defined as the temperature at which 50% of the primer-duplex dissociates [16]. Several formulas exist for calculating Tm.
- Basic Calculation:
Tm = 4(G + C) + 2(A + T)[16]. This simple method provides a rough estimate but does not account for salt concentrations. - Salt-Adjusted Calculation:
Tm = 81.5 + 16.6(log[Na+]) + 0.41(%GC) – 675/primer length[16]. This offers greater accuracy by incorporating monovalent ion concentration. - Nearest-Neighbor Method: This is the most accurate method as it considers the thermodynamic stability of every adjacent dinucleotide pair in the oligo, along with salt and primer concentrations [16]. This method is used by modern online design tools like the IDT OligoAnalyzer [82].
As a general rule, the initial annealing temperature should be set 3–5°C below the calculated Tm of the lower-Tm primer [16]. IDT recommends designing primers with a Tm of 60–64°C and using an annealing temperature no more than 5°C below the primer Tm [82].
Table 2: Guide to Annealing Temperature Optimization
| Annealing Temperature Scenario | Expected Outcome | Corrective Action |
|---|---|---|
| Too Low (e.g., >5°C below Tm) | Non-specific amplification, smeared bands, primer-dimer formation [17] | Increase Ta in increments of 2–3°C [16] |
| Optimal (Tm - 3 to -5°C) | Strong yield of specific product, clean background | None required; protocol is optimized |
| Too High (Approaching or above Tm) | Low or no product yield due to inefficient primer binding [82] | Decrease Ta in increments of 2–3°C |
Experimental Protocol for Ta Optimization
Using a thermal cycler with a gradient function is the most efficient way to optimize annealing temperature.
Materials:
- Optimized PCR reagents, including a pre-determined Mg²⁺ concentration.
- Primers with known Tm values.
Method:
- Prepare a single master mix containing all components, including template and primers.
- Aliquot the mix into multiple PCR tubes.
- Place the tubes in the thermal cycler and set the annealing temperature gradient. The range should span at least 5–10°C, centered on the calculated Tm - 5°C. For example, for a primer Tm of 60°C, a gradient from 55°C to 65°C is appropriate.
- Run the PCR protocol.
- Analyze the results via agarose gel electrophoresis.
Interpretation: The optimal Ta is the highest temperature that produces a strong, specific amplicon. Selecting the highest effective temperature maximizes specificity [16].
Advanced Considerations and Integrated Optimization
The Interplay Between Mg2+ and Annealing Temperature
Mg²⁺ concentration and annealing temperature are not independent variables; they exhibit a strong interplay. Mg²⁺ stabilizes nucleic acid duplexes, meaning that an increase in Mg²⁺ concentration effectively lowers the Tm of the primer-template complex [17] [81]. Consequently, if the Mg²⁺ concentration is significantly altered during optimization, the annealing temperature may need re-adjustment. The optimization process should therefore be iterative. A best practice is to first optimize the Mg²⁺ concentration at a conservative (slightly low) annealing temperature, then fine-tune the annealing temperature using the optimized Mg²⁺ concentration.
The Scientist's Toolkit: Essential Reagents for Optimization
Table 3: Key Research Reagent Solutions for PCR Optimization
| Reagent / Material | Critical Function in Optimization |
|---|---|
| MgCl₂ Stock Solution | The variable cofactor for polymerase activity and duplex stability; used in titration experiments [17] [81]. |
| Hot-Start DNA Polymerase | Reduces non-specific amplification and primer-dimer formation by remaining inactive until the initial high-temperature denaturation step [17] [16]. |
| PCR Buffer (without MgCl₂) | Provides the core ionic environment (e.g., K+, Tris-HCl); using a Mg-free buffer is essential for performing a clean Mg²⁺ titration. |
| dNTP Mix | The building blocks of DNA synthesis; note that dNTPs can chelate Mg²⁺, so their concentration must be kept consistent [17]. |
| Gradient Thermal Cycler | Instrumental for efficient annealing temperature optimization by allowing different reactions to run at different temperatures simultaneously [16]. |
| Additives (e.g., DMSO, Betaine) | Can enhance specificity and yield for difficult templates (e.g., GC-rich) by destabilizing secondary structures; note they often lower effective Tm [16]. |
The meticulous optimization of Mg²⁺ concentration and annealing temperature is a non-negotiable prerequisite for robust and reliable PCR. Evidence-based protocols, including Mg²⁺ titration and annealing temperature gradients, provide a systematic pathway to success. The quantitative guidelines established by recent research, such as the 1.5–3.0 mM optimal range for Mg²⁺ and its logarithmic relationship with Tm, offer a solid foundation for experimental design [81]. By understanding the critical roles these parameters play and applying the detailed methodologies outlined in this guide, researchers and drug development professionals can significantly enhance the precision of their molecular analyses, thereby contributing to the advancement of diagnostic and therapeutic technologies.
Within the critical framework of polymerase chain reaction (PCR) research, successful amplification hinges on the precise execution of a series of temperature-dependent steps: denaturation, annealing, and extension [15]. However, standard protocols often fail when faced with challenging DNA templates, such as those with high guanine-cytosine (GC) content or those isolated from complex biological samples. These templates can form stable secondary structures or contain inherent inhibitors that impede the DNA polymerase, leading to poor amplification yield and specificity [83] [84]. This is where PCR additives, such as dimethyl sulfoxide (DMSO) and bovine serum albumin (BSA), become indispensable tools. These compounds enhance the robustness of the PCR cycle by modulating the reaction environment, stabilizing enzymes, and neutralizing inhibitors, thereby ensuring the fidelity and efficiency of the amplification process [15] [83] [85]. This guide provides an in-depth technical examination of how DMSO and BSA function, their optimized use, and detailed protocols for their application in advanced laboratory settings.
Mechanisms of Action: How DMSO and BSA Enhance PCR
Dimethyl Sulfoxide (DMSO)
DMSO is an organic solvent primarily used to facilitate the amplification of GC-rich DNA templates. Its mechanism is twofold. First, DMSO interferes with the formation of hydrogen bonds between DNA strands by interacting with water molecules in the solution [84]. This reduces the melting temperature (Tm) of the DNA, making it easier to denature stable secondary structures that are common in GC-rich regions [15] [84]. Second, by promoting a more uniform denaturation, it facilitates primer binding to the template, thereby enhancing the specificity and yield of the reaction [15] [85]. It is crucial to note that DMSO also reduces the activity of Taq polymerase [84]. Therefore, a balance must be struck between the benefits of template denaturation and the potential inhibition of the enzyme, making concentration optimization critical.
Bovine Serum Albumin (BSA)
BSA, a protein derived from cow's blood plasma, acts through multiple stabilizing and protective mechanisms. Its primary role is to function as a molecular "sponge" that binds to and neutralizes PCR inhibitors commonly found in biological samples, such as phenolic compounds, humic acids, or salts [86] [84]. This prevents these inhibitors from interacting with and deactivating the DNA polymerase [87]. Furthermore, BSA acts as a stabilizing agent for the DNA polymerase enzyme itself, helping to maintain its structural integrity and activity throughout the high-temperature cycles of the PCR process [86]. Research has shown that BSA can act as a powerful co-enhancer when used with organic solvents like DMSO or formamide, significantly increasing the yield of GC-rich DNA amplification, especially in the initial PCR cycles [83].
The following diagram illustrates the mechanistic workflow of how these additives intervene in the PCR cycle to overcome common challenges.
Optimizing Additive Concentrations: A Quantitative Guide
The effectiveness of DMSO and BSA is highly concentration-dependent. Using these additives outside their optimal ranges can lead to inhibited reactions or increased non-specific amplification. The tables below summarize the standard concentration ranges and their specific effects to guide experimental optimization.
Table 1: Optimization Guide for DMSO and BSA
| Additive | Recommended Concentration | Primary Effect | Template/Scenario | Key Considerations |
|---|---|---|---|---|
| DMSO | 1–10% [85];2–10% [84] | Reduces DNA melting temperature (Tm); disrupts secondary structures [15] [84]. | GC-rich templates (>60% GC) [15] [83]. | Reduces Taq polymerase activity; higher concentrations can be inhibitory [84]. |
| BSA | 0.1–0.8 mg/mL [86];~0.8 mg/mL [84];10 µg/µL (for large fragments) [83] | Binds inhibitors; stabilizes DNA polymerase [86]. | Inhibitor-prone samples (e.g., buccal swabs, stool, soil) [87] [83]; GC-rich templates (as co-additive) [83]. | Enhances effects of organic solvents like DMSO; no detrimental effect on specificity at high concentrations [83]. |
Table 2: Synergistic Additive Combinations for Challenging Templates
| Challenge | Recommended Additive Combination | Mechanism | Reference |
|---|---|---|---|
| High GC Content | DMSO (5%) + BSA (0.8 mg/mL) | DMSO denatures stable structures; BSA further boosts yield as a co-enhancer. | [83] |
| Sporadic Inhibition | BSA (0.8 mg/mL) | BSA neutralizes inhibitors from complex samples (e.g., buccal swabs), lowering PCR failure rates. | [87] |
| Extremely GC-Rich DNA | Betaine (1-1.7 M) ± DMSO | Betaine equalizes base-pair stability, while DMSO aids denaturation. | [84] [85] |
Experimental Protocols: Methodology for Additive Optimization
Protocol 1: Amplifying GC-Rich Templates with DMSO and BSA
This protocol is adapted from research demonstrating the synergistic effect of BSA and organic solvents in amplifying GC-rich DNA targets ranging from 0.4 kb to 7.1 kb [83].
PCR Reaction Setup (50 µL volume):
- Assemble the following components on ice:
- 1X PCR buffer
- 200 µM of each dNTP
- 1.5-2.0 mM MgCl₂ (titration may be required) [88]
- 0.1-0.5 µM of each forward and reverse primer
- 10-100 ng of genomic DNA template
- 1.25 units of Taq DNA polymerase
- DMSO: Test a range from 2.5% to 7.5% (v/v) final concentration.
- BSA: Add at 0.1-0.8 mg/mL final concentration. For fragments larger than 2.5 kb, consider adding BSA up to 10 µg/µL [83].
- Nuclease-free water to 50 µL.
- Assemble the following components on ice:
Thermal Cycling Conditions:
- Initial Denaturation: 94-98°C for 1-2 minutes [15] [88].
- Amplification (25-35 cycles):
- Denaturation: 94-98°C for 10-60 seconds.
- Annealing: 52-65°C for 30 seconds (optimize based on primer Tm).
- Extension: 70-80°C for 1 minute per 1 kb of product.
- Final Extension: 70-80°C for 5 minutes [15].
- Hold: 4°C.
Analysis and Optimization:
- Analyze 5-10 µL of the PCR product by agarose gel electrophoresis.
- If yield remains low, consider a "pause-and-add" approach where the thermal cycler pauses after the first 10 cycles to allow for the addition of a fresh BSA solution, which can counteract heat denaturation of the protein over many cycles [83].
Protocol 2: Overcoming PCR Inhibition in Buccal Swab Samples
This protocol is based on a high-throughput study that successfully used BSA to overcome sporadic inhibition in buccal swab-derived DNA, reducing failure rates to 0.1% [87].
DNA Extraction:
- Purify genomic DNA from buccal swabs using a commercial kit that includes an inhibitor removal step.
PCR Master Mix with BSA:
- Prepare a master mix containing:
- 1X PCR buffer
- dNTPs, MgCl₂, primers, and DNA polymerase at standard concentrations.
- BSA: Incorporate at a final concentration of 0.8 mg/mL.
- Aliquot the master mix, then add the purified buccal swab DNA template.
- Prepare a master mix containing:
Thermal Cycling and Analysis:
- Use standard thermal cycling conditions appropriate for the specific assay (e.g., HLA genotyping) [87].
- The inclusion of BSA enhances robustness without detrimental effects on PCR performance, though minor foaming may occur during automated liquid handling.
The Scientist's Toolkit: Essential Research Reagent Solutions
The following table details key reagents and their functions for implementing the optimization strategies discussed in this guide.
Table 3: Essential Reagents for PCR Optimization with Additives
| Reagent | Function/Description | Application Note |
|---|---|---|
| DMSO (Molecular Biology Grade) | High-purity solvent to reduce DNA secondary structures. | Critical for GC-rich templates; always use molecular biology grade to avoid contaminants. |
| PCR-Grade BSA | Stabilizing protein that binds inhibitors and protects polymerase. | Superior to general-lab grade BSA; ensures no nuclease contamination. |
| Hot-Start DNA Polymerase | Enzyme chemically modified or antibody-bound to prevent activity until initial denaturation. | Reduces non-specific amplification and primer-dimer formation prior to cycling [15]. |
| dNTP Mix | Equimolar solution of deoxyribonucleotide triphosphates (dATP, dCTP, dGTP, dTTP). | Standard final concentration is 200 µM of each dNTP; higher concentrations can reduce fidelity [88]. |
| Magnesium Chloride (MgCl₂) | Essential cofactor for DNA polymerase activity. | Concentration is critical; optimize between 1.0-4.0 mM in 0.5 mM increments [88]. |
| Betaine | Osmoprotectant that homogenizes the stability of GC and AT base pairs. | Alternative/additive for extremely GC-rich templates; use at 1-1.7 M concentration [84]. |
The strategic use of additives like DMSO and BSA is a powerful method for overcoming the most persistent challenges in PCR amplification. By understanding their distinct and synergistic mechanisms—DMSO as a denaturant for GC-rich secondary structures and BSA as a stabilizer and inhibitor scavenger—researchers can systematically troubleshoot and optimize their assays. Integrating these additives into a robust experimental workflow, as outlined in the provided protocols and tables, enables the reliable amplification of difficult templates, thereby ensuring the success of downstream applications in cloning, sequencing, and diagnostic assay development.
Within the broader context of Polymerase Chain Reaction (PCR) cycle research, the selection of an appropriate DNA polymerase is a fundamental step that profoundly impacts the success and reliability of the amplification process. PCR, a cornerstone technique in molecular biology, relies on the enzymatic activity of DNA polymerases to synthesize new DNA strands. The core steps of a standard PCR cycle—denaturation, annealing, and extension—are critically dependent on the properties of this enzyme [89]. Since the early use of Taq DNA polymerase, significant advancements have been engineered to enhance key enzyme characteristics, primarily to address the competing demands of amplification efficiency and synthetic accuracy [89]. Two major classes of enzymes, high-fidelity and hot-start DNA polymerases, have been developed to meet these distinct needs, and understanding their differences is essential for experimental design. This guide provides an in-depth technical comparison of these polymerases, framing their utility within the PCR workflow to aid researchers, scientists, and drug development professionals in making an informed selection.
Key Characteristics of DNA Polymerases in PCR
The performance of a DNA polymerase in PCR is governed by several interdependent biochemical properties. These properties not only determine the yield of the amplification but also its suitability for specific downstream applications.
- Specificity: This refers to the enzyme's ability to amplify only the intended target sequence. Nonspecific amplification, such as primer-dimer formation or the extension of misprimed sequences, can drastically reduce yield and sensitivity [89] [90]. Hot-start technology is a direct innovation to enhance specificity.
- Fidelity: Fidelity is the accuracy with which a DNA polymerase replicates the template sequence. It is a critical parameter for applications where the correct DNA sequence is essential, such as cloning, sequencing, and site-directed mutagenesis [89] [91]. Fidelity is often expressed as the inverse of the error rate (e.g., errors per base per doubling) [91].
- Thermostability: This is the enzyme's ability to withstand the high temperatures (≥90°C) of the denaturation step over multiple cycles. Enzymes from hyperthermophilic organisms, such as Pyrococcus furiosus, exhibit superior thermostability compared to Taq, which is beneficial for amplifying templates with high secondary structure [89].
- Processivity: Defined as the number of nucleotides incorporated per enzyme-binding event, processivity influences the synthesis rate and the ability to amplify long templates or sequences with high GC content. Higher processivity also helps overcome PCR inhibitors found in complex samples like blood or plant tissues [89].
High-Fidelity DNA Polymerases
Mechanism of Action: The Proofreading Function
High-fidelity DNA polymerases are characterized by their strong proofreading activity, which is mediated by a dedicated 3′→5′ exonuclease domain [89] [91]. This domain is distinct from the polymerase's active site responsible for DNA synthesis. The mechanism of proofreading involves a multi-step process:
- Misincorporation Detection: After a mismatched (incorrect) nucleotide is incorporated into the growing DNA strand, the geometry of the DNA duplex becomes distorted, causing DNA synthesis to stall [91].
- Translocation to Exonuclease Site: This stalling prompts the polymerase to translocate the 3' end of the DNA strand from the polymerase active site to the exonuclease active site [89].
- Excision: The 3′→5′ exonuclease activity hydrolytically removes the misincorporated nucleotide.
- Resumption of Synthesis: The DNA strand is translocated back to the polymerase active site, where synthesis resumes with the correct nucleotide [91].
This corrective mechanism significantly increases the accuracy of DNA replication. The fidelity of a proofreading polymerase can be 50–300 times higher than that of non-proofreading enzymes like standard Taq [89].
The following diagram illustrates the proofreading mechanism of a high-fidelity DNA polymerase.
Quantitative Fidelity Comparison of Common Polymerases
The fidelity of DNA polymerases is quantitatively measured using various sequencing methods, and it is commonly expressed relative to Taq DNA polymerase. Next-generation sequencing (NGS) and Single-Molecule Real-Time (SMRT) sequencing provide highly accurate fidelity measurements by generating vast datasets that allow for statistically robust error rate calculations [91]. The table below summarizes the fidelity of several commercially available high-fidelity DNA polymerases, as determined by PacBio SMRT sequencing.
Table 1: Fidelity Measurements of Common High-Fidelity DNA Polymerases
| DNA Polymerase | Substitution Rate (per base per doubling) | Accuracy (1 / substitution rate) | Fidelity Relative to Taq |
|---|---|---|---|
| Q5 High-Fidelity | 5.3 × 10⁻⁷ | 1,870,763 | 280x [91] |
| Phusion | 3.9 × 10⁻⁶ | 255,118 | 39x [91] |
| Deep Vent | 4.0 × 10⁻⁶ | 251,129 | 44x [91] |
| Pfu | 5.1 × 10⁻⁶ | 195,275 | 30x [91] |
| PrimeSTAR GXL | 8.4 × 10⁻⁶ | 118,467 | 18x [91] |
| KOD | 1.2 × 10⁻⁵ | 82,303 | 12x [91] |
| Taq (Reference) | 1.5 × 10⁻⁴ | 6,456 | 1x [91] |
Note: Accuracy is calculated as the number of bases over which one substitution error is expected. Data sourced from PacBio SMRT sequencing studies [91].
Experimental Protocol: Gene Synthesis Using High-Fidelity Polymerases
A key application for high-fidelity polymerases is de novo gene synthesis from overlapping oligonucleotides. The following protocol is adapted from a study that successfully synthesized the 581 bp Fel d 4 gene [92].
- Objective: Assemble a full-length gene from a set of overlapping, PAGE-purified oligonucleotides.
- Principle: Overlapping regions in the oligonucleotides serve as primers and templates for the polymerase in a series of hybridization and extension steps, eventually assembling the full-length product [92].
- Materials:
- Oligonucleotides: A mix of ~62-mer oligonucleotides, each with 18-24 bp overlaps, designed with appropriate software (e.g., DNAWorks) and PAGE-purified [92].
- Polymerase: Phusion High-Fidelity DNA Polymerase (or equivalent high-fidelity enzyme) [92].
- Buffer: Appropriate GC buffer provided with the enzyme.
- dNTPs: 200 µM of each dNTP.
- Outer Primers: 30 pmol of each forward and reverse primer flanking the full gene sequence.
- Reaction Setup:
- Combine in a 25 µL reaction: 1x Reaction Buffer, 200 µM dNTPs, 1.5 pmol of each internal oligonucleotide, 30 pmol of outer primers, and 1 unit of high-fidelity DNA polymerase [92].
- Thermal Cycling Conditions:
- Initial Denaturation: 94°C for 1 minute.
- 25 Cycles:
- Denaturation: 94°C for 30 seconds.
- Annealing: 61°C for 40 seconds.
- Extension: 72°C for 50 seconds.
- Final Extension: 72°C for 10 minutes [92].
- Downstream Processing:
- Analyze PCR product by agarose gel electrophoresis.
- Gel-purify the correct-sized band.
- For cloning into T-vectors, perform 'A-tailing' if the polymerase produces blunt ends (as Phusion does).
- Clone into a suitable vector (e.g., pGEM-T Easy) and sequence multiple clones to verify sequence integrity [92].
Hot-Start DNA Polymerases
Mechanism of Action: Suppressing Pre-Mature Activity
The primary goal of hot-start technology is to prevent nonspecific amplification and primer-dimer formation that occur when the polymerase becomes active during reaction setup at room temperature [89] [90]. Hot-start DNA polymerases are engineered to remain inactive until the first high-temperature denaturation step of the PCR cycle is reached. This is achieved through various inhibition mechanisms.
Table 2: Comparison of Common Hot-Start Technologies
| Hot-Start Technology | Mechanism | Benefits | Considerations |
|---|---|---|---|
| Antibody-Based | A specific antibody binds the polymerase's active site, blocking activity until it is denatured at high temperatures (e.g., >90°C) [89] [90]. | Short activation time; full enzyme activity restored; features similar to the native enzyme [90]. | Presence of animal-origin antibodies and exogenous proteins [90]. |
| Chemical Modification | The enzyme is covalently modified with thermolabile chemical groups that block activity, requiring prolonged heating for activation [90]. | Stringent inhibition; free of animal-origin components [90]. | Longer activation time; may not achieve full activity; can affect long amplicon yield [90]. |
| Aptamer-Based | An oligonucleotide aptamer binds reversibly to the enzyme, inhibiting it at low temperatures and dissociating at higher temperatures [93]. | Does not require a separate high-temperature activation step; convenient for room-temperature setup [93]. | May be less stringent than other methods [90]. |
| Affibody-Based | A small, engineered protein domain (Affibody) binds and inhibits the enzyme, dissociating at high temperatures [90]. | Short activation time; less exogenous protein than antibody-based methods [90]. | May be less stringent than antibody-based method [90]. |
| Primer-Based | The primers themselves are modified with thermolabile groups (e.g., 4-oxo-1-pentyl PTE) at the 3'-end, preventing extension until the groups are cleaved by heat [94]. | High specificity; flexibility as it is primer-specific rather than enzyme-specific [94]. | Requires synthesis of modified primers; may not be as universally applicable [94]. |
The activation process for an antibody-based hot-start polymerase, one of the most common types, is shown in the following diagram.
Experimental Protocol: Evaluating Hot-Start Specificity
A standard method to demonstrate the efficacy of hot-start polymerases is to compare the specificity and yield of amplification against a non-hot-start enzyme.
- Objective: Amplify a specific target from genomic DNA and assess the reduction in nonspecific amplification products and primer-dimers using a hot-start polymerase.
- Principle: By inhibiting polymerase activity during reaction setup, hot-start enzymes prevent the extension of primers bound to non-specific sequences or to each other, leading to a cleaner and more specific amplification [89].
- Materials:
- DNA Template: Human genomic DNA.
- Primers: Designed to amplify a target fragment (e.g., 2 kb).
- Polymerases: Hot-start DNA polymerase (e.g., Platinum II Taq) and its non-hot-start counterpart.
- Reaction Buffer and dNTPs: As recommended by the manufacturer.
- Reaction Setup:
- Prepare two separate PCR master mixes. One contains the hot-start enzyme, and the other the non-hot-start enzyme.
- To test robustness for high-throughput applications, the hot-start reactions can be prepared and left at room temperature for various durations (0, 24, and 72 hours) before being placed in the thermal cycler [89].
- The non-hot-start reactions should be set up on ice and transferred immediately to the thermal cycler.
- Thermal Cycling Conditions:
- Use standard cycling conditions suitable for the chosen target and polymerase.
- Initial Denaturation: A step at >90°C for 2 minutes is critical to activate the hot-start enzyme [89].
- Analysis:
- Run the PCR products on an agarose gel and visualize with ethidium bromide or SYBR Safe.
- Expected Result: The reaction with the hot-start polymerase should show a single, strong band of the expected size, even after room-temperature incubation. The non-hot-start reaction will typically show multiple nonspecific bands and/or primer-dimer smears [89].
Direct Comparison and Selection Guidelines
Side-by-Side Comparison Table
Choosing between a high-fidelity and a hot-start polymerase depends on the primary goal of the experiment. The following table outlines their core differences.
Table 3: High-Fidelity vs. Hot-Start DNA Polymerases: A Direct Comparison
| Characteristic | High-Fidelity DNA Polymerase | Hot-Start DNA Polymerase |
|---|---|---|
| Primary Function | Accurate DNA replication; low error rate [89] [91] | Specific amplification; suppression of off-target products [89] [90] |
| Core Mechanism | 3′→5′ exonuclease (proofreading) activity [89] | Temporary inhibition of enzyme at low temperatures [89] |
| Key Applications | Cloning, sequencing, site-directed mutagenesis, gene synthesis [91] [92] | Diagnostic PCR, multiplex PCR, high-throughput screening, amplification from complex templates [89] [90] |
| Impact on PCR | Higher accuracy but potentially slower extension rate and lower processivity for some native enzymes [89] | Cleaner amplification profiles, higher target yield, reduced primer-dimer [89] |
| Typical Error Rate | ~10⁻⁶ to 10⁻⁷ (e.g., Q5: 5.3×10⁻⁷) [91] | Similar to its base polymerase (e.g., Hot Start Taq error rate ~1.5×10⁻⁴) [91] |
| Resulting DNA Ends | Often blunt-ended (e.g., Q5, Phusion) [95] | Often 3'-A-overhang if based on Taq (e.g., Hot Start Taq) [95] |
Integrated Selection Strategy for PCR Research
The choice of polymerase is not always mutually exclusive. Many modern research applications benefit from enzymes that combine both high-fidelity and hot-start properties. The following workflow integrates polymerase selection into the broader context of PCR experimental design.
Guided Selection Workflow:
Assess Downstream Application:
- Cloning, Sequencing, Mutagenesis: If the integrity of the DNA sequence is paramount, begin with a high-fidelity polymerase. For the highest accuracy, select an enzyme with a proven >100x fidelity over Taq, such as Q5 [91] [92].
- Genotyping, Presence/Absence Tests, Quantitative PCR: If the primary concern is specific amplification of a target, especially from a complex template, a hot-start polymerase is the primary choice to maximize specificity and yield [89] [90].
Evaluate Template and Target Amplicon:
- Challenging Templates: For long templates (>5 kb), GC-rich sequences, or templates with significant secondary structure, prioritize enzymes with high processivity and thermostability. Many engineered high-fidelity polymerases now incorporate DNA-binding domains to enhance these characteristics [89].
- Routine Templates: For standard, short amplicons from a pure DNA template, a standard Taq polymerase may be sufficient, but a hot-start version is still recommended to improve robustness [95].
Consider Combinatorial Solutions:
- For most demanding applications (e.g., cloning a difficult amplicon for functional study), the optimal choice is often a single enzyme that combines high-fidelity and hot-start properties, such as Q5 Hot Start High-Fidelity DNA Polymerase [95]. This combination provides the highest level of both specificity and accuracy.
The Scientist's Toolkit: Essential Research Reagent Solutions
The following table catalogs key reagents and their functions as discussed in the experimental protocols and technical guides, providing a quick reference for researchers.
Table 4: Essential Reagents for PCR Experiments with High-Fidelity and Hot-Start Polymerases
| Reagent | Function in PCR | Application Notes |
|---|---|---|
| Q5 Hot Start High-Fidelity DNA Polymerase | Combines antibody-mediated hot-start with high proofreading fidelity for specific and accurate amplification [95]. | Ideal for cloning, sequencing, and NGS library prep where both high yield and low error rate are required [95]. |
| Platinum II Taq Hot-Start DNA Polymerase | Antibody-based hot-start enzyme with high processivity for amplifying long or complex templates [89]. | Enables room-temperature setup and efficient amplification of GC-rich targets and sequences from inhibitory samples [89]. |
| Phusion High-Fidelity DNA Polymerase | A high-fidelity polymerase often used for gene synthesis and cloning, available with hot-start options [95] [92]. | Produces blunt-ended fragments; fidelity is ~50x that of Taq [92]. Ensure compatibility with downstream cloning strategies. |
| dNTP Solution Set | Provides the essential nucleotides (dATP, dCTP, dGTP, dTTP) for DNA synthesis by the polymerase [92]. | Use high-quality, nuclease-free dNTPs. Concentration must be optimized to balance yield and fidelity. |
| 10X Standard Taq Reaction Buffer | A common buffer supplied with Taq polymerase, containing KCl, Tris-HCl, and MgCl₂, providing optimal ionic and pH conditions [93]. | Mg²⁺ concentration is a critical variable that often requires optimization for specific primer-template pairs. |
| pGEM-T Easy Vector | A T-vector for easy cloning of PCR products that have 3'-A overhangs, a feature of Taq polymerase amplification [92]. | Not suitable for blunt-ended PCR products generated by many high-fidelity polymerases without an additional 'A-tailing' step [92]. |
| PAGE-Purified Oligonucleotides | High-purity primers for PCR, especially critical for complex applications like gene assembly from overlapping oligos [92]. | Reduces the number of truncated oligonucleotides, which minimizes errors and increases the yield of the correct full-length product [92]. |
Within the meticulously controlled steps of the PCR cycle, the selection of an appropriate DNA polymerase remains a critical determinant of experimental success. High-fidelity and hot-start DNA polymerases, though often developed for distinct purposes, are not mutually exclusive categories in modern molecular biology. The former serves the imperative of sequence integrity, while the latter guarantees amplification specificity. As evidenced by the quantitative fidelity data and experimental protocols, the choice between them—or the selection of a hybrid enzyme—must be a deliberate decision aligned with the research objective. Whether the goal is the flawless synthesis of a gene for functional expression or the sensitive detection of a pathogen in a clinical sample, a thorough understanding of polymerase characteristics enables researchers to leverage the full power of PCR. The ongoing engineering of enzymes that combine high fidelity, hot-start stringency, and enhanced processivity continues to push the boundaries of PCR, making it an even more robust and indispensable tool in scientific research and drug development.
PCR Validation and Technology Comparison: Ensuring Data Accuracy
The polymerase chain reaction (PCR) stands as a cornerstone technology in molecular biology, clinical diagnostics, and drug development. Its quantitative power, however, is entirely dependent on the rigorous validation of three fundamental parameters: sensitivity, specificity, and efficiency. This in-depth technical guide delineates the theoretical underpinnings, experimental protocols, and analytical frameworks for characterizing these critical assay parameters. Framed within the essential context of the PCR cycle, this whitepaper provides researchers, scientists, and drug development professionals with the detailed methodologies necessary to ensure the generation of reliable, reproducible, and quantitatively accurate data, thereby upholding the highest standards of scientific rigor in PCR-based research and applications.
The Polymerase Chain Reaction (PCR) is an enzymatic process that amplifies a specific DNA sequence exponentially through repetitive thermal cycling. Each cycle consists of three core steps: denaturation of double-stranded DNA, annealing of primers to their complementary sequences, and extension of the new DNA strand by a thermostable DNA polymerase [16]. The remarkable sensitivity of this process is also its greatest vulnerability; without meticulous validation, the powerful amplification can yield misleading results, as historically evidenced by erroneous reports of amplifying dinosaur DNA from ancient artifacts due to modern contamination [96]. Validation transforms a PCR procedure from a mere amplification technique into a trustworthy quantitative or qualitative analytical tool, ensuring that results accurately reflect the underlying biological reality.
A robust understanding of assay validation begins with a deep appreciation of the PCR process itself. The amplification curve generated in real-time PCR is characterized by three distinct phases, each with critical implications for quantification.
- Geometric/Exponential Phase: In this initial phase, all reaction components are in excess, fueling consistent, maximal amplification efficiency. The accumulation of product is exponential, and the data in this phase are considered quantitatively reliable because the original quantitative relationships between samples are preserved [97] [98].
- Linear Phase: As reagents become depleted (e.g., primers, dNTPs, or enzyme activity diminishes), the amplification efficiency declines cycle-by-cycle. The reaction enters a linear phase where the data become less quantitative and less consistent [97].
- Plateau Phase: The reaction ceases as one or more critical components are exhausted. Data from this phase are not quantitative, and the final yield is not indicative of the starting template quantity [97].
The threshold cycle (Ct) is the key data point derived from the amplification plot. It is defined as the fractional PCR cycle number at which the fluorescence of the amplifying target crosses a threshold set within the exponential phase. The Ct value is inversely proportional to the logarithm of the initial target quantity; a difference of one Ct value represents a two-fold difference in starting template, assuming 100% efficiency [98]. This relationship is the bedrock of qPCR quantification.
Core Validation Parameters
Sensitivity
Sensitivity in PCR validation encompasses two related concepts: analytical sensitivity refers to the lowest concentration of the target that an assay can reliably detect, while diagnostic sensitivity refers to the ability of the assay to correctly identify true positive samples.
Table 1: Key Metrics for Assessing PCR Sensitivity
| Metric | Definition | Experimental Approach |
|---|---|---|
| Limit of Detection (LOD) | The lowest target concentration that can be detected in ≥95% of replicates [96]. | Serial dilution of a known positive sample; Probit analysis is often used for statistical determination. |
| Limit of Quantification (LOQ) | The lowest target concentration that can be quantified with acceptable precision and accuracy (e.g., CV < 25-35%) [96]. | Analysis of a dilution series to determine the point where quantification becomes unreliable. |
| Dynamic Range | The range of template concentrations over which the fluorescent signal is directly proportional to the input [96]. | A 6 to 8-point, 10-fold serial dilution series analyzed to create a standard curve with an R² value of ≥0.980 [96]. |
Experimental Protocol for Determining LOD and Dynamic Range:
- Preparation: Prepare a 7-point, 10-fold serial dilution of a target standard with a known concentration (e.g., synthetic DNA, cloned plasmid, or characterized positive sample) [96].
- Amplification: Amplify each dilution in triplicate (or more) using the optimized qPCR assay.
- Data Analysis: Plot the mean Ct value for each dilution against the logarithm of the starting quantity or dilution factor.
- Linearity Assessment: Perform linear regression analysis. The linear dynamic range is defined by the dilutions that fall on the linear portion of this standard curve. The R² value should be ≥0.980 [96].
- LOD Determination: Test the lowest dilutions (and further intermediate dilutions around the suspected LOD) in a high number of replicates (e.g., 20+). The LOD is the concentration at which ≥95% of the replicates are positive.
Specificity
Specificity is the ability of an assay to exclusively detect the intended target without cross-reacting with non-target sequences, including genetically similar organisms or host genomic DNA.
Table 2: Components of PCR Specificity Validation
| Component | Definition | Validation Method |
|---|---|---|
| Inclusivity | The ability of the assay to detect all intended target strains, subtypes, or variants [96]. | Test against a panel of well-characterized target strains (international standards recommend up to 50 strains) reflecting genetic diversity. |
| Exclusivity (Cross-reactivity) | The ability of the assay to exclude detection of non-target, but genetically similar, organisms [96]. | Test against a panel of near-neighbor non-target species and common sample flora. |
| In Silico Analysis | Computational assessment of primer/probe binding to intended and unintended sequences. | BLAST analysis against genomic databases (e.g., GenBank) to check for sequence similarities/differences [96]. |
Experimental Protocol for Specificity Testing:
- In Silico Specificity Check: Before wet-lab testing, the oligonucleotide (primers and probe) sequences should be analyzed in silico using tools like BLAST to ensure they bind specifically to the target and to identify potential cross-reactive organisms for empirical testing [96].
- Wet-Lab Testing: The optimized PCR assay is run with template DNA/RNA from:
- A panel of inclusivity targets (e.g., different strains of the target pathogen).
- A panel of exclusivity targets (near-neighbor species, other pathogens commonly found in the sample matrix, and host genomic DNA).
- Analysis: Specificity is confirmed when all inclusivity samples return positive results (with expected Ct values and melting temperatures, if applicable), and all exclusivity samples return negative results (or Ct values significantly beyond those of true positives) [96] [99].
Efficiency
PCR efficiency (E) is a critical quantitative parameter defined as the fraction of target templates that are duplicated in each PCR cycle during the exponential phase. An efficiency of 1.0 (or 100%) indicates perfect doubling. Efficiencies between 90% and 110% (E=0.9 to 1.1) are generally considered acceptable [100] [101].
Calculating Efficiency: The most common method for determining efficiency is via a standard curve from a serial dilution experiment.
- The slope of the standard curve (Ct vs. log input) is used in the formula: E = 10^(-1/slope) - 1 [100] [97].
- A slope of -3.32 corresponds to 100% efficiency. Slopes steeper than -3.32 indicate lower efficiency [97].
Figure 1: Workflow for determining PCR amplification efficiency via a standard curve.
Troubleshooting PCR Efficiency:
- Low Efficiency (<90%): Often caused by poor primer design (e.g., secondary structures, dimers), suboptimal reaction conditions (e.g., annealing temperature, Mg²⁺ concentration), or the presence of inhibitors [16] [101].
- Apparent Efficiency >110%: This is often an artifact caused by the presence of PCR inhibitors in more concentrated samples, which become diluted out in the lower points of the standard curve, flattening the slope. Pipetting errors and primer-dimer formation can also contribute [101].
The ΔΔCt method of relative quantification should only be used when the amplification efficiencies of the target and reference (normalizer) genes have been demonstrated to be approximately equal and close to 100%. If efficiencies differ, the standard curve method or efficiency-corrected ΔΔCt calculations must be used to avoid significant quantification errors [100] [97].
The Scientist's Toolkit: Essential Reagents and Materials
The reliability of a validated PCR assay is contingent upon the quality and consistency of its core components.
Table 3: Essential Reagents for Validated PCR Assays
| Reagent / Material | Critical Function | Validation Considerations |
|---|---|---|
| Thermostable DNA Polymerase | Enzymatically synthesizes new DNA strands. Different enzymes have varying processivity, fidelity, and tolerance to inhibitors. | Choice between standard (e.g., Taq) and high-fidelity enzymes. Hot-start enzymes are crucial for specificity. Verification of performance with the specific assay is required [16]. |
| Primers & Probes | Confer sequence specificity for target amplification and detection. | Must be designed and validated for inclusivity and exclusivity. Purity (HPLC-purified) is essential. In silico analysis is a mandatory first step [102] [96]. |
| PCR Buffer & Mg²⁺ | Provides optimal chemical environment for polymerase activity and primer annealing. | Mg²⁺ concentration often requires optimization as it significantly impacts specificity and yield. Some buffers contain additives to aid in GC-rich target amplification [16]. |
| dNTPs | The building blocks (A, dT, C, G) for DNA synthesis. | Quality and concentration must be consistent. Degraded or imbalanced dNTPs severely impact efficiency and yield. |
| Internal & Extraction Controls | Monitor sample preparation and check for PCR inhibition. | An exogenous control spiked into the sample is necessary to distinguish true negatives from failed reactions due to inhibition [102]. |
| Standard Reference Materials | Calibrates the assay for quantitative analysis. | Used to construct standard curves for determining efficiency, LOD, and dynamic range. Can be commercially sourced or laboratory-generated [102]. |
An Integrated Validation Workflow
Assay validation is a holistic process where parameters are not assessed in isolation. The following diagram illustrates the interconnected workflow.
Figure 2: Integrated workflow for the comprehensive validation of a PCR assay.
The power of PCR as a quantitative and diagnostic tool is unlocked only through rigorous, comprehensive validation. Sensitivity, specificity, and efficiency are not merely abstract concepts but are interdependent parameters that must be empirically characterized using well-defined experimental protocols and statistical analyses. Adherence to established guidelines, such as the MIQE guidelines, ensures the generation of reliable, reproducible, and trustworthy data [102] [96]. For researchers in both basic science and drug development, a deeply understood and meticulously validated PCR assay is not the final step of method development, but the foundational first step toward generating scientifically defensible and clinically actionable results.
The Polymerase Chain Reaction (PCR) is a foundational technique in molecular biology, enabling the exponential amplification of specific DNA sequences from minimal starting material. Since its inception in 1985, PCR technology has evolved through several generations, each offering significant advancements [6] [11]. Quantitative PCR (qPCR), also known as real-time PCR, represented the second generation, allowing researchers to monitor amplification as it occurs [50]. The most recent evolution, digital PCR (dPCR), has introduced a paradigm shift by enabling absolute nucleic acid quantification without the need for standard curves [103] [50].
This technical guide provides an in-depth comparison of qPCR and dPCR technologies, focusing on their underlying principles, performance characteristics in sensitivity and quantification, and practical workflow considerations. The information is framed within the broader context of PCR cycle research, providing researchers, scientists, and drug development professionals with the critical insights needed to select the appropriate technology for their specific applications.
Fundamental Principles and Technologies
qPCR: Real-Time Fluorescence Monitoring
qPCR functions by monitoring the accumulation of amplified DNA products in real-time throughout the amplification cycles. The process relies on fluorescent reporters—either intercalating dyes or sequence-specific probes—that emit signals proportional to the amount of amplified DNA [6]. The key output is the quantification cycle (Cq), which represents the PCR cycle number at which the fluorescence signal exceeds a predetermined threshold [6]. To determine target concentration, the Cq values of unknown samples are compared against a standard curve generated from samples with known concentrations [103]. This method provides relative quantification, though absolute quantification is possible with appropriate standards.
dPCR: Partitioning and Absolute Quantification
dPCR takes a fundamentally different approach by partitioning a single PCR reaction into thousands to millions of individual reactions, each acting as a separate amplification vessel [103] [50]. Following endpoint amplification, each partition is analyzed to determine if it contains the target sequence (positive) or not (negative). The absolute concentration of the target nucleic acid is then calculated using Poisson statistics based on the ratio of positive to negative partitions, eliminating the requirement for a standard curve [104] [105] [50]. This partitioning enables single-molecule detection and precise absolute quantification.
Comparative Workflow Visualization
The diagram below illustrates the core procedural differences between qPCR and dPCR workflows.
Performance Comparison: Sensitivity, Quantification, and Precision
Key Performance Metrics
Table 1: Comparative Analysis of qPCR and dPCR Performance Characteristics
| Performance Parameter | qPCR | dPCR |
|---|---|---|
| Quantification Method | Relative (requires standard curve); Absolute with standards [103] | Absolute (no standard curve) [103] [106] |
| Sensitivity | Moderate | High; excels at detecting rare mutations and low-abundance targets [103] [106] |
| Precision (Variability) | Moderate; inter-assay CV% typically higher [106] | High; intra-assay CV% ~4.5% reported, less susceptible to inhibitors [104] [106] |
| Dynamic Range | Broad (up to 7-8 logs) [107] | Constrained by partition number [108] |
| Impact of PCR Inhibitors | Susceptible; affects amplification efficiency and Cq values [104] | More tolerant; partitioning dilutes inhibitors [104] [106] |
| Multiplexing Capability | Moderate; limited by fluorescent channel availability [107] | Excellent; suitable for complex multiplexing [104] [107] |
Experimental Evidence from Comparative Studies
Recent studies directly comparing both technologies demonstrate clear performance differences:
Periodontal Pathobiont Detection: A 2025 study comparing multiplex dPCR and qPCR for detecting periodontal pathogens found dPCR demonstrated superior sensitivity, detecting lower bacterial loads, particularly for P. gingivalis and A. actinomycetemcomitans. dPCR showed lower intra-assay variability (median CV%: 4.5%) compared to qPCR and identified qPCR false negatives at low concentrations (< 3 log10Geq/mL), resulting in a 5-fold underestimation of A. actinomycetemcomitans prevalence [106].
Respiratory Virus Detection: A 2025 study comparing dPCR and Real-Time RT-PCR for detecting influenza A, influenza B, RSV, and SARS-CoV-2 found dPCR demonstrated superior accuracy, particularly for high viral loads of influenza A, influenza B, and SARS-CoV-2, and for medium loads of RSV. It showed greater consistency and precision than Real-Time RT-PCR, especially in quantifying intermediate viral levels [109].
GMO Quantification: Research on genetically modified organism quantification found dPCR methods showed less sensitivity to PCR inhibitors and better suitability for multiplexing compared to real-time PCR. Both the Bio-Rad QX200 and Qiagen QIAcuity platforms demonstrated equivalent performance to singleplex real-time PCR methods when validated for GMO detection [104].
Experimental Protocols and Methodologies
Detailed dPCR Protocol for Multiplex Pathogen Detection
Table 2: Key Research Reagent Solutions for dPCR Experiments
| Reagent/Consumable | Function | Example from Literature |
|---|---|---|
| Primer-Probe Mixes | Sequence-specific target detection | Optimized concentrations for multiplex detection of periodontal pathobionts or respiratory viruses [106] [109] |
| dPCR Master Mix | Provides optimal reaction conditions | QIAcuity Probe PCR Kit [106] |
| Restriction Enzymes | Enhance DNA accessibility | Anza 52 PvuII (0.025 U/μL) for periodontal pathobiont assay [106] |
| Nanoplate | Microfluidic partitioning device | QIAcuity Nanoplate 26k (26,000 partitions/well) [106] |
| Automated System | Integrated partitioning, thermocycling, imaging | QIAcuity Four system [106] |
A recently published protocol for multiplex detection of periodontal pathogens demonstrates optimized dPCR methodology [106]:
Reaction Setup: Prepare 40 μL reaction mixtures containing:
- 10 μL of sample DNA
- 10 μL of 4× Probe PCR Master Mix
- 0.4 μM of each specific primer
- 0.2 μM of each specific probe
- 0.025 U/μL restriction enzyme (Anza 52 PvuII)
- Nuclease-free water to volume
Partitioning and Amplification:
- Transfer mixtures to QIAcuity Nanoplate 26k
- Seal plate and load into QIAcuity Four instrument
- Thermal cycling: 2 min at 95°C; 45 cycles of 15 sec at 95°C and 1 min at 58°C
Imaging and Analysis:
- Image acquisition on multiple channels with specific thresholds
- Analyze using QIAcuity Software Suite with Poisson distribution calculations
- Apply Volume Precision Factor for improved accuracy
Platform-Specific Considerations
Comparative studies have evaluated different dPCR platforms:
- Bio-Rad QX200 Droplet Digital PCR: Utilizes water-oil emulsion droplets, requiring a droplet generator and reader [104] [105].
- Qiagen QIAcuity Nanoplate System: Employs microfluidic chips with fixed nanowells, integrating partitioning, thermocycling, and imaging [104] [105].
A 2025 study comparing these platforms for gene copy number analysis in protists found both demonstrated similar detection and quantification limits with high precision across most analyses. However, precision was influenced by restriction enzyme choice, with HaeIII generally providing higher precision than EcoRI, especially for the QX200 system [105].
Application-Based Technology Selection
Decision Framework for Technology Selection
Table 3: Application-Based Guidance for Choosing Between qPCR and dPCR
| Application Scenario | Recommended Technology | Rationale |
|---|---|---|
| High-Throughput Screening | qPCR | Faster processing, lower cost per sample, established workflows [103] |
| Rare Mutation Detection | dPCR | Superior sensitivity for detecting low-abundance targets (e.g., cancer mutations) [103] [50] |
| Absolute Quantification | dPCR | No standard curve required; direct counting of molecules [103] [106] |
| Gene Expression Analysis | qPCR | Excellent for relative quantification; cost-effective for multiple samples [103] |
| Complex Samples with Inhibitors | dPCR | Reduced susceptibility to PCR inhibitors [104] [106] |
| Multiplex Target Detection | dPCR | Better suited for complex multiplexing applications [104] |
Current Limitations and Emerging Solutions
While dPCR offers significant advantages, it has limitations that researchers should consider:
- Constrained Dynamic Range: The fixed partition capacity of dPCR makes capturing wide concentration ranges challenging in a single run. High-abundance targets can saturate partitions, while low-abundance ones may be missed [108].
- Throughput and Cost: dPCR typically has lower throughput and higher cost per sample compared to qPCR, making it less suitable for large-scale screening applications [107].
- Statistical Estimation: dPCR relies on Poisson correction to estimate molecule counts, introducing statistical uncertainty, particularly at extreme high and low concentrations [108].
Emerging technologies aim to address these limitations. Platforms like Countable PCR attempt to move beyond partitioning-based estimation by using matrix-based systems to isolate and directly count single molecules without Poisson correction, potentially offering broader dynamic range and higher sensitivity [108].
The choice between qPCR and dPCR is not a matter of one technology being universally superior, but rather selecting the right tool for specific research questions and experimental constraints. qPCR remains the workhorse for high-throughput applications, relative quantification, and gene expression studies where cost-effectiveness and established workflows are priorities. dPCR excels in applications requiring absolute quantification, detection of rare targets, analysis of complex samples with inhibitors, and sophisticated multiplexing.
As PCR technology continues to evolve, the convergence of qPCR and dPCR capabilities is likely, with future platforms potentially offering the throughput and cost-effectiveness of qPCR with the precision and absolute quantification of dPCR. For now, understanding the fundamental principles, performance characteristics, and practical considerations outlined in this technical guide will enable researchers to make informed decisions that optimize their experimental outcomes.
The Polymerase Chain Reaction (PCR) is a foundational nucleic acid amplification technique that has become a cornerstone of biomolecular research and clinical diagnostics. Since its introduction by Kary Mullis in 1985, PCR has evolved into an indispensable tool for applications ranging from pathogen identification to genetic disorder screening and genetically modified organism (GMO) detection [6]. This technical guide examines the validation of PCR methods, focusing specifically on two critical applications: GMO detection and pathogen identification. Validation ensures that PCR assays are reliable, accurate, and reproducible, which is essential for regulatory compliance, clinical decision-making, and scientific research [102] [96]. Within the broader context of thesis research on PCR cycles, understanding these validation frameworks provides crucial insights into transforming basic PCR protocols into robust analytical methods suitable for addressing complex biological questions.
The fundamental principle of PCR involves the exponential amplification of a specific DNA target through repeated temperature cycles of denaturation, annealing, and extension [6] [11]. This process relies on thermostable DNA polymerases, with Taq polymerase being the most widely used due to its stability at high temperatures [11]. Real-time quantitative PCR (qPCR) and reverse transcription PCR (RT-PCR) represent advanced variants that enable quantification and RNA analysis, respectively [6] [53]. As we explore the validation parameters for these techniques, it becomes evident that rigorous experimental design and systematic verification are paramount for generating trustworthy data in both research and clinical settings.
Fundamental Principles of PCR
Core Mechanism and Steps
The polymerase chain reaction amplifies specific DNA sequences through a cyclic three-step process that exponentially increases the number of DNA copies [6] [11]. This mechanism forms the foundation upon which all validated PCR methods are built:
- Denaturation: The double-stranded DNA template is heated to 94-95°C, disrupting hydrogen bonds between complementary bases and separating the strands into single-stranded DNA molecules [6].
- Annealing: The temperature is lowered to typically 55-72°C, allowing short synthetic oligonucleotide primers to bind (anneal) to their complementary sequences on opposite strands of the target DNA region [6]. The optimal annealing temperature depends on the primer sequence, length, and concentration.
- Extension: DNA polymerase, typically thermostable Taq polymerase, synthesizes new DNA strands by adding nucleotides to the 3' ends of the annealed primers at 72°C [6] [11]. The enzyme reads the template strand and creates a complementary copy in the 5' to 3' direction.
These three steps constitute one PCR cycle, and the process is typically repeated 25-40 times in a thermal cycler, resulting in the theoretical exponential amplification of the target sequence [6] [11]. The development of thermostable DNA polymerases revolutionized PCR by eliminating the need to add fresh enzyme after each denaturation step, thereby enabling automation [11].
PCR Variations and Their Applications
Several advanced PCR methodologies have been developed to address specific research needs, with qPCR and RT-PCR being particularly relevant for GMO detection and pathogen identification:
Quantitative PCR (qPCR)/Real-time PCR: This technique monitors DNA amplification in real-time using fluorescent reporter molecules (SYBR Green dye or sequence-specific TaqMan probes) [6] [53]. Unlike conventional PCR which provides end-point detection, qPCR focuses on the exponential phase of amplification, providing quantitative data about the initial amount of target DNA [53]. The key measurement is the threshold cycle (Cq), which represents the PCR cycle at which fluorescence exceeds a background threshold [6] [53].
Reverse Transcription PCR (RT-PCR): This method combines reverse transcription of RNA into complementary DNA (cDNA) followed by PCR amplification [6] [53]. It can be performed as a one-step procedure (reverse transcription and amplification in a single tube) or two-step process (separate reactions) [53]. During the COVID-19 pandemic, RT-PCR served as the primary diagnostic method for detecting SARS-CoV-2 RNA due to its high sensitivity and specificity [6].
Figure 1: PCR Workflow and Method Selection. This flowchart illustrates the decision process for selecting appropriate PCR methodologies based on research objectives and sample type, culminating in different detection and analysis approaches.
PCR Validation Framework
Core Validation Parameters
Validating a PCR assay requires systematic assessment of multiple performance characteristics to ensure the method produces reliable, reproducible results suitable for its intended application [102] [96]. The key parameters constitute a comprehensive validation framework:
Inclusivity: This measures the assay's ability to detect all intended target variants or strains [96]. For example, an influenza A PCR should detect H1N1, H1N2, and H3N2 variants. Inclusivity testing should use 50 well-defined certified strains of the target organism where possible to adequately represent genetic diversity [96].
Exclusivity (Cross-reactivity): This assesses the assay's ability to avoid detection of genetically similar non-targets [96]. For pathogen identification, this ensures the PCR doesn't amplify related but distinct organisms (e.g., distinguishing influenza A from influenza B) [96]. Both inclusivity and exclusivity should be evaluated through in silico analysis (database sequence comparison) followed by experimental verification [96].
Linear Dynamic Range: This defines the range of template concentrations over which the fluorescent signal is directly proportional to the DNA input [96]. It is typically determined using a seven 10-fold dilution series of DNA standard run in triplicate [96]. A well-optimized assay exhibits linearity across 6-8 orders of magnitude, with R² values ≥0.980 considered acceptable [96].
Amplification Efficiency: This critical parameter reflects the rate at which the target sequence doubles during the exponential amplification phase, with ideal values ranging from 90% to 110% [53] [96]. Efficiency is calculated from the slope of the standard curve [6]. Low efficiency requires additional cycles to reach the detection threshold, resulting in higher Cq values and reduced sensitivity [6].
Limit of Detection (LOD) and Limit of Quantification (LOQ): The LOD represents the lowest target concentration that can be reliably detected, while the LOQ is the lowest concentration that can be accurately quantified with stated precision and accuracy [96]. These parameters are particularly important for detecting low pathogen loads or minimal GMO contamination.
Table 1: Essential Validation Parameters for PCR Assays
| Validation Parameter | Definition | Acceptance Criteria | Experimental Approach |
|---|---|---|---|
| Inclusivity | Ability to detect all target variants | Detection of all intended strains/isolates | Test with 50 certified target strains [96] |
| Exclusivity | Ability to exclude non-targets | No amplification of non-target species | Test with genetically related organisms [96] |
| Linear Dynamic Range | Range of quantitative measurement | 6-8 orders of magnitude; R² ≥ 0.980 [96] | Seven 10-fold dilution series in triplicate [96] |
| Amplification Efficiency | Rate of target amplification per cycle | 90-110% [53] [96] | Standard curve with slope of -3.1 to -3.6 [6] |
| Limit of Detection (LOD) | Lowest detectable concentration | Consistent detection at target concentration | Serial dilution of standardized material |
| Precision | Assay reproducibility | CV < 5-10% for replicate measurements | Multiple operators, days, and instrumentations |
Quality Assurance and Regulatory Compliance
Robust PCR validation aligns with established quality standards and guidelines to ensure methodological rigor and result reliability. Several frameworks provide structured approaches to validation:
MIQE Guidelines: The Minimum Information for Publication of Quantitative Real-Time PCR Experiments (MIQE) guidelines aim to ensure the reliability of results, promote consistency between laboratories, and increase experimental transparency [96]. These guidelines have been widely adopted in scientific literature to improve reporting standards.
ISO Standards: International standards such as ISO/IEC 17025 and ISO/IEC 15198 require appropriate validation of analytical methods, including PCR assays [110]. These standards emphasize documentation, quality control, and measurement uncertainty.
Clinical Implementation: For clinical applications, regulatory bodies like the FDA (USA) and IVD Regulations (EU) 2017/746 establish requirements for assay validation [102]. Even commercially available CE-marked or FDA-approved tests require verification in the user's laboratory due to differences in staff competence, equipment, and workflow systems [102].
Laboratory-developed tests (LDTs) require more extensive validation than commercial assays, particularly for rare pathogens or emerging infections where commercial tests may not be available [102]. The validation process should begin with a clear definition of the assay's purpose, as this determines all subsequent validation steps [102].
Figure 2: PCR Assay Validation Process. This workflow outlines the systematic approach to PCR validation, beginning with defining the assay purpose and progressing through testing of essential performance parameters before implementation with continuous monitoring.
Case Study: GMO Detection Using Real-Time PCR
Experimental Design and Methodology
The detection of genetically modified organisms (GMOs) using real-time PCR presents unique challenges, particularly with the emergence of organisms generated through New Genomic Techniques (NGTs) like CRISPR-Cas9 [111]. A recent case study developed a novel single-plex real-time PCR method targeting a specific single nucleotide polymorphism (SNP) in the grf1-3 gene of Arabidopsis thaliana modified using CRISPR-Cas9 technology [111]. The experimental methodology included:
Primer and Probe Design: The assay utilized locked nucleic acid (LNA)-modified primers to improve specificity for the SNP [111]. LNA modifications increase the thermal stability of primer-template complexes, enhancing the ability to discriminate between wild-type and edited alleles.
Reaction Optimization: Researchers systematically optimized primer concentrations (200 nM, 400 nM, 600 nM), probe concentrations (100 nM, 200 nM, 300 nM), and annealing temperatures (56°C to 66°C) [111]. The optimal conditions used 600 nM forward primer, 600 nM reverse primer, and 200 nM probe at 62°C annealing temperature [111].
Master Mix Evaluation: Two different master mixes—TaqMan Fast Advanced Master Mix and Kapa Probe Fast qPCR Master Mix (2×)—were evaluated, with the latter demonstrating superior performance (Cq 20.90 vs. 22.67) under identical conditions [111].
Specificity Assessment: The method's specificity was tested against wild-type (Col-01) DNA, revealing that unmodified TaqMan primers failed to completely discriminate between edited and wild-type sequences, amplifying both with Cq values of 21.44 and 29.6, respectively [111]. This highlighted the need for LNA-modified primers to achieve sufficient specificity.
Performance Characteristics and Data Analysis
The validated qPCR method for GMO detection demonstrated the following performance characteristics:
Amplification Efficiency: The assay achieved an efficiency of approximately 95.4% with an R² value of 0.9995 and a slope of -3.43, within the acceptable range for quantitative analysis [111].
Dynamic Range: The standard curve exhibited linearity across a wide concentration range, from 20,000 copies (Cq 23.34) to 2 copies (Cq 37.01) [111].
Specificity Challenges: Despite optimization, the method showed some amplification of wild-type DNA at high cycle thresholds, creating a "gray area" in result interpretation that necessitates establishing clear cutoff values for positive/negative classification [111].
This case study illustrates that while real-time PCR can be suitable for detecting gene-edited plants, performance varies case-by-case depending on the genomic context of the genetic change, the host species, and the availability of genomic databases for in silico analysis of target sequence similarities [111].
Table 2: Performance Data from GMO Detection Case Study [111]
| Experimental Parameter | Condition 1 | Condition 2 | Optimal Condition |
|---|---|---|---|
| Master Mix Comparison | TaqMan Fast Advanced (Cq 22.67) | Kapa Probe Fast (Cq 20.90) | Kapa Probe Fast |
| Primer Concentration | 200 nM Fwd, 400 nM Rev (Cq 26.74) | 600 nM Fwd, 600 nM Rev (Cq 20.77) | 600 nM each |
| Probe Concentration | 100 nM (Cq 23.19) | 200 nM (Cq 23.59) | 200 nM |
| Annealing Temperature | 56°C (Cq 23.19) | 62°C (Cq 23.59) | 62°C |
| Template Concentration | 10,000 copies (Cq 25.82) | 20,000 copies (Cq 23.34) | 20,000 copies |
| Specificity | Unmodified primers (Cq 29.6 in wild-type) | LNA-modified primers (Improved discrimination) | LNA-modified primers |
Case Study: Pathogen Identification in Clinical Diagnostics
Method Validation for SARS-CoV-2 Detection
The COVID-19 pandemic highlighted the critical importance of validated PCR methods for pathogen identification in clinical diagnostics. Reverse transcription PCR (RT-PCR) emerged as the primary diagnostic method for detecting SARS-CoV-2 due to its high sensitivity, specificity, and rapid turnaround time [6]. Key validation considerations for clinical pathogen detection include:
Sample Collection and Processing: SARS-CoV-2 specimens are typically obtained from the upper respiratory tract via nasopharyngeal swabs, oropharyngeal swabs, nasal swabs, or bronchoalveolar lavage [6]. Proper sample collection is essential for assay accuracy, as inadequate samples may yield false-negative results.
RNA Extraction and Reverse Transcription: The validation process must account for variations in RNA extraction efficiency and reverse transcription efficiency, both of which impact quantitative results [6] [53]. Internal controls should be incorporated to monitor extraction efficiency and detect PCR inhibitors [102].
Analytical Sensitivity and Specificity: The LOD for SARS-CoV-2 detection must be established using characterized reference materials [102]. Specificity testing should include common respiratory pathogens to ensure no cross-reactivity with related viruses [96].
Quantification and Clinical Correlation: For SARS-CoV-2, quantification cycle (Cq) values can assist in assessing viral load, which correlates with disease severity and transmission risk [6]. Serial PCR testing allows clinicians to track disease progression and evaluate recovery by comparing changes in Cq values over time [6].
Quality Control in Clinical PCR
Maintaining validated performance of PCR assays in clinical settings requires rigorous quality control procedures:
Contamination Prevention: PCR amplification creates millions of DNA copies that can contaminate subsequent reactions if not properly contained [6]. Physical separation of pre-amplification and post-amplification areas, use of dedicated equipment and reagents, and implementation of ultraviolet irradiation in workstations help minimize contamination risk [6].
Internal and External Controls: Each PCR run should include positive controls (verified target sequences), negative controls (no-template and no-reverse-transcription), and internal amplification controls to detect inhibition [102]. Participation in external quality assessment programs provides independent evaluation of assay performance [102].
Personnel Competency and Documentation: Technical staff must demonstrate competency in molecular techniques, and all validation data should be thoroughly documented following ALCOA principles (Attributable, Legible, Contemporaneous, Original, Accurate) [102].
Essential Reagents and Research Solutions
Successful PCR validation requires careful selection and quality control of reagents and materials. The following table summarizes essential components and their functions in PCR assays:
Table 3: Research Reagent Solutions for PCR Validation
| Reagent/Material | Function | Validation Considerations |
|---|---|---|
| DNA Polymerase | Enzymatic synthesis of new DNA strands [6] [11] | Thermostability, fidelity (proofreading activity), processivity [11] |
| Primers | Sequence-specific binding to target DNA [6] | Specificity, melting temperature, absence of self-complementarity [6] |
| Probes | Sequence-specific detection in qPCR [53] | Fluorophore-quencher compatibility, specificity, optimal concentration [111] [53] |
| dNTPs | Nucleotide substrates for DNA synthesis | Quality, concentration, absence of contaminants |
| Buffer Components | Optimal reaction conditions for polymerase activity | Mg²⁺ concentration, pH, stabilizers, enhancers [111] |
| Master Mix | Pre-mixed reaction components for consistency | Manufacturer reliability, compatibility with platform [111] |
| Reference Materials | Calibrators and controls for quantification | Certified value, stability, commutability [102] |
| Inhibition Reagents | Assessment of sample quality | Internal control amplification, spike recovery [102] |
Recent advancements in reagent technology have addressed several PCR challenges:
Polymerase Improvements: Modern enzyme blends combine the processivity of Taq polymerase with the proofreading activity of other thermostable polymerases, enabling amplification of longer fragments and improved accuracy [11].
LNA-Modified Primers: As demonstrated in the GMO detection case study, locked nucleic acid (LNA) modifications enhance primer specificity, particularly for discriminating single nucleotide polymorphisms [111].
Master Mix Formulations: Specialized master mixes are available for challenging applications, such as amplifying GC-rich templates or detecting rare targets in complex backgrounds [111] [11].
The validation of PCR methods for GMO detection and pathogen identification represents a critical process that transforms basic nucleic acid amplification into reliable analytical tools. This case study demonstrates that successful validation requires systematic assessment of inclusivity, exclusivity, sensitivity, precision, and dynamic range, with acceptance criteria defined according to the assay's intended purpose [111] [102] [96]. The emergence of new genomic techniques and evolving pathogens necessitates continuous refinement of validation approaches, emphasizing the importance of standardized guidelines like MIQE and adherence to international quality standards [96] [110].
For researchers conducting thesis work on PCR cycles, this analysis highlights several crucial considerations. First, optimal PCR conditions must be empirically determined for each new assay, as factors such as primer concentration, annealing temperature, and master mix selection significantly impact performance [111]. Second, the choice between conventional PCR, qPCR, and digital PCR depends on the required sensitivity, quantification needs, and application context [111] [110]. Finally, maintaining validated status requires ongoing monitoring and quality control, as reagent lots change, equipment ages, and new potential interferents emerge [102]. By integrating these validation principles into PCR research, scientists can ensure their findings rest upon a foundation of robust, reproducible molecular data that advances both scientific knowledge and practical applications in biotechnology and medicine.
The Role of Standard Curves and Controls in Validating qPCR Assays
Within the broader framework of polymerase chain reaction (PCR) cycle research, the validation of quantitative PCR (qPCR) assays stands as a critical pillar for ensuring data integrity. This technical guide delves into the indispensable roles of standard curves and experimental controls in validating qPCR performance. We detail the methodologies for constructing and analyzing standard curves to determine key reaction parameters such as amplification efficiency, linear dynamic range, and sensitivity. Furthermore, we outline the essential suite of controls required to monitor contamination, reagent integrity, and amplification specificity. By providing structured protocols, data interpretation guidelines, and visualization of workflows, this whitepaper serves as a comprehensive resource for researchers and drug development professionals dedicated to generating robust, reproducible, and reliable qPCR data.
Quantitative PCR (qPCR), also known as real-time PCR, is a sensitive and reliable laboratory technique for the precise quantification of nucleic acids. Unlike conventional PCR, which provides end-point analysis, qPCR enables real-time monitoring of DNA amplification through the use of fluorescent dyes or probes [6]. This method has become a cornerstone in molecular biology, clinical diagnostics, and drug development for applications ranging from gene expression analysis to pathogen detection. However, the accuracy and reliability of the data it produces are profoundly dependent on rigorous assay validation.
The fundamental principle of qPCR involves tracking the accumulation of fluorescent signal over multiple amplification cycles. The cycle at which the fluorescence crosses a predefined threshold (the quantification cycle, or Cq) is inversely proportional to the logarithm of the initial target quantity [112]. The reliability of this Cq value to reflect the true starting concentration is contingent upon the optimization and validation of the entire assay system. Even with optimal primer and probe design, factors such as reagent quality, enzyme efficiency, sample purity, and the presence of inhibitors can compromise results. Therefore, within the comprehensive workflow of PCR cycle research, establishing a validated qPCR assay through standard curves and controls is a non-negotiable prerequisite for any subsequent experimental application. This process confirms that the assay is performing with high efficiency, specificity, and accuracy, thereby ensuring that the final biological conclusions are valid.
The qPCR Standard Curve: Foundation for Quantification
The standard curve is a critical tool for quantifying unknown samples and assessing the overall performance of a qPCR assay. It establishes the relationship between the Cq value and the known starting quantity of a target nucleic acid.
Purpose and Theoretical Basis
The primary purpose of a standard curve is to generate a linear regression model from samples of known concentration, which can then be used to determine the concentration of unknown samples. Furthermore, it allows for the calculation of two vital performance metrics: PCR efficiency and the coefficient of determination (R²).
The theoretical foundation lies in the exponential nature of PCR amplification. Under ideal conditions, the number of DNA molecules doubles every cycle, resulting in 100% efficiency [113]. The kinetics of the exponential phase are described by the equation: ( Nn = N0 \times E^n ) where ( Nn ) is the DNA amount after ( n ) cycles, ( N0 ) is the initial target amount, and ( E ) is the amplification efficiency [112]. The standard curve visualizes this logarithmic relationship, translating Cq values into meaningful quantitative data.
Experimental Protocol for Standard Curve Construction
Constructing a reliable standard curve requires meticulous preparation and execution. The following protocol outlines the key steps:
- Source Standard Material: The standard can be a purified plasmid containing the target sequence, a PCR amplicon, or synthetic oligonucleotide (gBlocks). For gene expression studies using reverse transcription qPCR (RT-qPCR), this is often cDNA synthesized from a sample with high target expression [113].
- Determine Concentration: Precisely quantify the standard stock solution using a spectrophotometer (e.g., Nanodrop) and calculate the copy number/μL.
- Prepare Serial Dilutions: Perform a logarithmic serial dilution (e.g., 5- to 10-fold dilutions) of the standard material over at least five orders of magnitude [113]. Use the same diluent (e.g., TE buffer or nuclease-free water) as the one used for the unknown samples to maintain matrix consistency.
- Include a No-Template Control (NTC): A control reaction containing all reagents except the template DNA must be included to detect contamination or the formation of primer-dimers [113] [114].
- Run qPCR Reactions: Plate each dilution, including the NTC, in a minimum of three technical replicates to assess repeatability. Use the same qPCR master mix and cycling conditions intended for the experimental samples.
- Data Analysis: The qPCR instrument software will typically generate the standard curve by plotting the log of the known initial template quantity on the x-axis against the average Cq value for each dilution on the y-axis.
Table 1: Key Parameters for an Optimal qPCR Standard Curve
| Parameter | Optimal/Target Value | Interpretation |
|---|---|---|
| PCR Efficiency | 90% - 105% [113] [115] | Efficiency = (10^(-1/slope) - 1) * 100. Values below 90% suggest inhibition or poor primer performance; over 105% may indicate inhibition in concentrated samples or pipetting errors [113]. |
| Slope | -3.1 to -3.6 | Derived from the linear regression of the standard curve. Directly related to efficiency. |
| R² (Coefficient of Determination) | > 0.99 [113] | Indicates the linearity and precision of the serial dilutions. A low value suggests poor dilution technique or pipetting errors. |
| Standard Deviation of Cq Replicates | < 0.2 [113] | Measures the variability between technical replicates. High SD indicates poor pipetting technique or reaction instability. |
Figure 1: Experimental workflow for establishing a qPCR standard curve, from sample preparation to quality control validation.
Essential Controls in qPCR Experimentation
While the standard curve validates the reaction kinetics, a comprehensive set of controls is required to monitor for contamination, assess reagent integrity, and verify target specificity. The use of controls is fundamental to diagnosing problems and trusting negative results.
Types of Controls and Their Applications
A well-designed qPCR experiment incorporates several types of controls, each serving a distinct purpose.
Table 2: Essential Controls for a Validated qPCR Assay
| Control Type | Purpose | Composition | Interpretation of Results |
|---|---|---|---|
| No-Template Control (NTC) | Detects contamination in reagents or formation of primer-dimers [114]. | All reaction components except the template nucleic acid; replaced with nuclease-free water. | A significant amplification signal (low Cq) indicates contamination. A late Cq signal may indicate primer-dimer formation. |
| No-Reverse-Transcription Control (No-RT) | Used in RT-qPCR to detect amplification from contaminating genomic DNA (gDNA) [114]. | RNA sample that underwent the reverse transcription step without the reverse transcriptase enzyme. | Amplification indicates gDNA contamination. DNase treatment of the RNA sample or designing primers to span an exon-exon junction is recommended [114]. |
| Positive Control | Verifies that all reagents and the instrument are functioning correctly. | A known template that reliably amplifies with the assay. | Failure to amplify indicates a problem with reagents, pipetting, or instrument function. |
| Inter-Plate Calibrator | Normalizes run-to-run variation in large studies spanning multiple qPCR plates. | The same sample (e.g., a pool of cDNA) run on every plate. | Used to correct Cq values across different plates, improving data comparability. |
| Reference Genes | Used in relative quantification to normalize for variations in input cDNA amount and efficiency of reverse transcription [115]. | Genes with stable expression across all experimental conditions (e.g., GAPDH, Actin). | Unstable reference gene expression (Cq shifts) can invalidate relative quantification results. Multiple reference genes should be tested. |
Implementing a Control Strategy
The controls listed in Table 2 should be integrated into every experimental run. For the NTC and No-RT controls, it is good practice to include them for each primer pair or probe set used. The positive control should be a sample with known, moderate expression of the target. When setting up reactions, always place controls in a consistent location on the plate (e.g., the last column) to streamline analysis. The failure of any control necessitates an investigation, and the experiment should not be used for drawing biological conclusions until the issue is resolved.
Figure 2: A decision tree for interpreting the results of key qPCR controls and the corresponding troubleshooting actions.
The Scientist's Toolkit: Key Reagents and Materials
The reliability of qPCR data is directly linked to the quality and suitability of the reagents used. Below is a non-exhaustive list of essential solutions and materials for a validated qPCR assay.
Table 3: Essential Research Reagent Solutions for qPCR
| Item | Function/Purpose | Key Considerations |
|---|---|---|
| qPCR Master Mix | Provides the core components for amplification: DNA polymerase, dNTPs, Mg²⁺, and reaction buffers. | Choose between probe-based (e.g., TaqMan) or dye-based (e.g., SYBR Green) mixes. The polymerase should be thermostable (e.g., Taq polymerase) [6]. |
| Sequence-Specific Primers | Anneal to the target DNA to define the amplicon and initiate synthesis. | Designed for specificity and efficiency. Typical parameters: Tm ~60±2°C, length 18-30 bp, GC content 35-65% [114]. Must be validated with a standard curve. |
| Hydrolysis Probes (e.g., TaqMan) | Provide sequence-specific detection through a fluorophore and quencher. Increases specificity [114]. | Probe Tm should be 5-10°C higher than primers. Avoid a 'G' at the 5' end. Quencher type (e.g., ZEN, IBFQ) impacts background fluorescence. |
| Intercalating Dyes (e.g., SYBR Green) | Bind double-stranded DNA, providing a fluorescent signal proportional to total dsDNA. | Less specific than probes; requires post-run melt curve analysis to confirm amplicon specificity and absence of primer-dimers. |
| Nuclease-Free Water | The solvent for preparing reagents and dilutions. | Must be certified nuclease-free to prevent degradation of primers, probes, and template. |
| Standard Curve Material | Known quantity of nucleic acid used to generate the calibration curve. | Should be a pure, accurately quantified material such as a plasmid, gBlock, or cDNA. Dilutions must be made with high precision. |
The path to robust and reliable qPCR data is paved with rigorous validation. As detailed in this guide, the combined use of a standard curve and a comprehensive panel of controls is not optional but fundamental to any rigorous qPCR assay. The standard curve provides the quantitative framework, yielding critical performance metrics like efficiency and sensitivity, while the controls act as sentinels, guarding against the myriad of technical pitfalls that can compromise results, from contamination to reagent failure. Integrating these validation steps into every stage of PCR cycle research—from initial assay design to final data interpretation—ensures that the resulting conclusions about gene expression, pathogen load, or genetic variation are built upon a solid, trustworthy experimental foundation. For the researcher and drug developer, this diligence is the key to generating data that is not only publishable but actionable.
The Polymerase Chain Reaction (PCR) is a foundational technique in molecular biology that enables the exponential amplification of specific DNA sequences from a small starting amount. Since its development by Kary Mullis in the 1980s, PCR has evolved into several advanced forms, each with distinct advantages for particular research applications [6] [11]. The core PCR process involves repeated cycles of denaturation (separating DNA strands), annealing (binding primers to target sequences), and extension (synthesizing new DNA strands), typically repeated 25-35 times to generate millions of copies of the target DNA region [11] [116]. This thermal cycling process is automated in modern instruments, making PCR a versatile tool with applications ranging from basic research to clinical diagnostics [11].
Understanding the technical capabilities, limitations, and appropriate applications of each PCR generation is essential for experimental success. Endpoint PCR provides qualitative analysis of DNA presence, quantitative real-time PCR (qPCR) enables relative quantification of nucleic acids with high throughput, and digital PCR (dPCR) offers absolute quantification with high sensitivity and precision [117] [106]. This guide examines these three principal PCR methodologies within the context of broader PCR cycle research, providing researchers with a comprehensive framework for selecting the optimal approach based on their specific experimental requirements, sample characteristics, and quantification needs.
Technical Comparison of PCR Methodologies
The evolution from conventional endpoint PCR to qPCR and dPCR has significantly expanded the applications of nucleic acid amplification in research and diagnostics. Each method employs the same fundamental principle of DNA amplification through thermal cycling but differs substantially in detection methodology, quantification capabilities, and optimal use cases.
Endpoint PCR, also known as conventional PCR, represents the original amplification format where DNA is amplified through multiple cycles and the final product is analyzed post-amplification, typically using gel electrophoresis [6] [116]. This method provides qualitative or semi-quantitative information about the presence or absence of specific DNA sequences but does not enable accurate quantification during the amplification process. The detection relies on visualizing amplified DNA fragments through intercalating dyes like ethidium bromide or newer fluorescent dyes after the PCR is complete [116].
Quantitative real-time PCR (qPCR) revolutionized nucleic acid quantification by enabling researchers to monitor amplification as it occurs in real-time through fluorescent detection systems [6]. This method employs either DNA-binding dyes or sequence-specific fluorescent probes that generate increasing fluorescence signals proportional to the amount of amplified DNA during each PCR cycle [6]. The point at which the fluorescence crosses a predetermined threshold (quantification cycle or Cq) is used for relative quantification against standards of known concentration, allowing researchers to determine initial template quantities with high sensitivity [6]. qPCR represents the current gold standard for gene expression analysis, pathogen detection, and various diagnostic applications due to its wide dynamic range, reproducibility, and relatively high throughput [6].
Digital PCR (dPCR), the third-generation PCR technology, provides absolute quantification without requiring standard curves by partitioning a single PCR reaction into thousands of individual reactions [105] [118] [117]. After endpoint amplification, each partition is analyzed for fluorescence to determine if it contains the target sequence (positive) or not (negative). The absolute concentration of the target nucleic acid is then calculated based on the ratio of positive to total partitions using Poisson statistics [118] [117]. This partitioning approach provides dPCR with exceptional sensitivity for detecting rare targets and increased resistance to PCR inhibitors compared to qPCR [118] [106]. dPCR has demonstrated particular utility in applications requiring precise quantification, such as copy number variation analysis, liquid biopsy, viral load monitoring, and detection of minimal residual disease in oncology [117] [106].
Table 1: Core Characteristics of Endpoint PCR, qPCR, and dPCR
| Parameter | Endpoint PCR | Quantitative PCR (qPCR) | Digital PCR (dPCR) |
|---|---|---|---|
| Quantification Type | Qualitative/Semi-quantitative | Relative quantification | Absolute quantification |
| Detection Method | Post-amplification gel electrophoresis | Real-time fluorescence monitoring | Endpoint fluorescence in partitions |
| Standard Curve Requirement | Not applicable | Required for quantification | Not required |
| Dynamic Range | Limited | 5-7 logarithms | 4-5 logarithms |
| Sensitivity | Low | Moderate to high (can detect single-digit copies) | Very high (can detect rare alleles <0.1%) |
| Throughput | Moderate | High | Moderate |
| Tolerance to Inhibitors | Low | Moderate | High |
| Primary Applications | Cloning, mutation detection, presence/absence testing | Gene expression, viral load monitoring, SNP genotyping | Rare mutation detection, copy number variation, liquid biopsy, NIPT |
Table 2: Performance Comparison in Research Applications Based on Recent Studies
| Application | Endpoint PCR | qPCR | dPCR | Supporting Evidence |
|---|---|---|---|---|
| Gene Expression Analysis | Not suitable | Gold standard; requires reference genes [119] [120] | Limited use; direct absolute quantification | qPCR remains dominant for expression studies [121] |
| Rare Target Detection | Limited sensitivity | Moderate sensitivity (1% mutant allele) | Superior sensitivity (0.001%-0.1% mutant allele) | dPCR detects lower bacterial loads in complex samples [106] |
| Absolute Quantification | Not possible | Possible with standard curves | Direct absolute quantification without standards | dPCR provides calibration-free quantification [118] [117] |
| Precision (CV%) | High variability | Moderate (typically 5-15%) | High precision (<5% CV) | dPCR shows lower intra-assay variability (median CV%: 4.5%) than qPCR [106] |
| Multiplexing Capability | Limited | Moderate (3-5 targets) | Moderate (2-3 targets in nanoplates) | Multiplex dPCR possible with different fluorescent probes [106] |
Experimental Design and Workflow Considerations
Selecting the appropriate PCR methodology requires careful consideration of your research objectives, sample characteristics, and analytical requirements. Each platform offers distinct advantages that align with specific experimental needs.
Workflow Diagrams and Decision Pathways
The following workflow diagrams illustrate the fundamental processes and methodological decision pathways for each PCR technology, providing visual guidance for researchers designing experiments.
Diagram 1: Endpoint PCR Workflow
Diagram 2: qPCR Workflow
Diagram 3: dPCR Workflow
Method Selection Guidance
The decision pathway for selecting the appropriate PCR method can be visualized through the following logical workflow:
Diagram 4: PCR Method Selection Guide
Detailed Experimental Protocols
Implementing the appropriate PCR methodology requires careful attention to experimental design, reagent selection, and validation procedures. Below are detailed protocols for key applications of each technology.
qPCR Gene Expression Analysis with Reference Gene Validation
Accurate gene expression analysis using qPCR requires appropriate normalization strategies to account for technical variability. The use of validated reference genes is critical for obtaining reliable results [119] [120].
Sample Preparation and RNA Extraction
- Isolate total RNA from biological samples using validated extraction kits (e.g., QIAzol Lysis Reagent followed by column-based purification)
- Treat samples with DNase to remove genomic DNA contamination (e.g., RQ1 RNase-Free DNase, 37°C for 30 minutes)
- Quantify RNA concentration and assess purity using spectrophotometry (A260/A280 ratio of 1.8-2.0 acceptable)
- Convert 1-2 μg of total RNA to cDNA using reverse transcriptase with oligo(dT) and/or random primers
Reference Gene Validation
- Select multiple candidate reference genes (e.g., ACTB, GAPDH, B2M, HPRT1, HMBS, ribosomal proteins)
- Test expression stability across all experimental conditions using algorithms like geNorm or NormFinder
- Rank genes based on stability measures (M-value in geNorm, stability value in NormFinder)
- Select the 2-3 most stable reference genes for normalization [119]
- Alternative approach: Use global mean normalization when profiling large gene sets (>55 genes) [119]
qPCR Reaction Setup
- Prepare reaction mix containing: 1X SYBR Green or probe-based master mix, forward and reverse primers (200-400 nM each), cDNA template (1-10 ng equivalent)
- Run samples in technical duplicates or triplicates on qPCR instrument with appropriate cycling conditions:
- Initial denaturation: 95°C for 2-5 minutes
- 40-45 cycles of: 95°C for 15 seconds, 60°C for 30 seconds, 72°C for 30 seconds
- Melt curve analysis (for SYBR Green assays): 65°C to 95°C with 0.5°C increments
Data Analysis
- Determine Cq values for target and reference genes
- Calculate normalized expression using geometric mean of reference genes or global mean approach
- For relative quantification, use 2^(-ΔΔCq) method or superior statistical approaches like ANCOVA that account for efficiency variations [121]
- Report results following MIQE guidelines with clear documentation of normalization strategy [121]
dPCR Rare Mutation Detection Protocol
dPCR provides superior sensitivity for detecting low-frequency mutations, making it ideal for liquid biopsy applications and minimal residual disease monitoring [117] [106].
Assay Design and Optimization
- Design TaqMan hydrolysis probes with different fluorophores for wild-type and mutant alleles
- Position mutation site in the middle of the probe sequence for optimal discrimination
- Test primer and probe concentrations using orthogonal methods to minimize background
- Incorporate restriction enzymes (e.g., HaeIII, EcoRI) when targeting tandemly repeated genes to improve accessibility [105]
Sample Preparation and Partitioning
- Extract DNA from patient samples (e.g., cell-free DNA from plasma for liquid biopsy)
- Prepare dPCR reaction mix containing: 1X dPCR master mix, target-specific primers (400-900 nM), fluorescent probes (200-250 nM), and DNA template (1-10 ng/μL)
- For droplet-based systems (e.g., Bio-Rad QX200): Generate 20,000 droplets per sample using droplet generator
- For nanoplate-based systems (e.g., QIAGEN QIAcuity): Load samples into nanoplates with 26,000 partitions per well
- Include no-template controls and positive controls for both wild-type and mutant alleles
Thermal Cycling and Data Acquisition
- Amplify using endpoint PCR conditions:
- Enzyme activation: 95°C for 10 minutes
- 40-45 cycles of: 95°C for 15-30 seconds, 55-60°C for 30-60 seconds
- Signal stabilization: 4°C hold (optional 98°C for 10 minutes for probe-based assays)
- Read plates or droplets using appropriate fluorescence detection systems
- For droplet systems: read droplets sequentially through a fluorescence detector
- For nanoplate systems: image entire plate using multichannel fluorescence imaging
Data Analysis and Interpretation
- Set fluorescence thresholds to distinguish positive and negative partitions
- Apply volume precision factors according to manufacturer specifications
- Calculate absolute concentration using Poisson statistics: Concentration = -ln(1 - p) / V where p is fraction of positive partitions, V is partition volume
- For rare allele detection, ensure sufficient number of partitions to achieve desired sensitivity (≥100,000 partitions for <0.1% variant allele frequency)
- Validate limit of detection (LOD) and limit of quantification (LOQ) using serial dilutions of positive controls
Platform Comparison Studies
Recent comparative studies provide valuable insights for platform selection decisions:
dPCR Platform Performance Comparison A 2025 study comparing the QX200 droplet digital PCR (Bio-Rad) and QIAcuity One nanoplate-based dPCR (QIAGEN) demonstrated both platforms showed similar detection and quantification limits when analyzing gene copy numbers in the ciliate Paramecium tetraurelia [105]. Key findings included:
- LOD for ndPCR: ~0.39 copies/μL input; LOD for ddPCR: ~0.17 copies/μL input
- LOQ for ndPCR: 1.35 copies/μL input; LOQ for ddPCR: 4.26 copies/μL input
- Restriction enzyme choice significantly impacted precision, especially for ddPCR (HaeIII provided higher precision than EcoRI)
- Both platforms showed high precision (CV 6-13% for ddPCR, 7-11% for ndPCR) across most concentrations [105]
dPCR vs qPCR Performance in Microbial Detection A 2025 clinical comparison evaluating periodontal pathobiont detection found dPCR outperformed qPCR for quantifying bacterial targets [106]:
- dPCR showed lower intra-assay variability (median CV%: 4.5%) than qPCR
- dPCR demonstrated superior sensitivity, particularly for low-abundance targets
- dPCR detected 5-fold higher prevalence of A. actinomycetemcomitans in periodontitis patients due to better detection at low concentrations
- Both methods showed good agreement at medium/high bacterial loads but qPCR produced false negatives at low concentrations (< 3 log₁₀ Geq/mL) [106]
Research Reagent Solutions and Essential Materials
Table 3: Key Reagents and Materials for PCR Applications
| Reagent Category | Specific Examples | Function | Application Notes |
|---|---|---|---|
| DNA Polymerases | Taq DNA polymerase, Platinum II Taq Hot-Start | Catalyzes DNA synthesis during extension phase | Hot-start enzymes reduce non-specific amplification; high-fidelity enzymes preferred for cloning [11] |
| Fluorescent Probes | SYBR Green, TaqMan probes, Molecular beacons | Enable real-time detection in qPCR/dPCR | TaqMan probes offer higher specificity; SYBR Green is more cost-effective [6] |
| Reference Genes | ACTB, GAPDH, B2M, HPRT1, RPS5, RPL8 | Normalization of qPCR data | Must be validated for each experimental condition; ribosomal proteins show high stability in gastrointestinal tissue [119] |
| Partitioning Reagents | Droplet generation oil, surfactants, nanoplate seals | Create individual reaction chambers in dPCR | Proper surfactant concentration critical for droplet stability during thermal cycling [117] |
| Restriction Enzymes | HaeIII, EcoRI, PvuII | Improve target accessibility in complex genomes | Particularly important for organisms with high gene copy numbers or tandem repeats [105] [106] |
| Nucleic Acid Purification Kits | QIAamp DNA Mini Kit, QIAzol Lysis Reagent | Isolate high-quality DNA/RNA from samples | Critical for removing PCR inhibitors; choice depends on sample type [106] |
Selecting the appropriate PCR methodology requires careful consideration of research objectives, sample characteristics, and analytical requirements. Endpoint PCR remains valuable for qualitative applications, while qPCR provides robust relative quantification for most gene expression and detection studies. dPCR offers superior capabilities for absolute quantification, rare target detection, and applications requiring high precision.
The continuing evolution of PCR technologies, including platform refinements and improved reagent systems, continues to expand the methodological toolbox available to researchers. By understanding the fundamental principles, performance characteristics, and appropriate applications of each approach, scientists can make informed decisions that optimize experimental outcomes and advance research goals across diverse fields from basic biology to clinical diagnostics.
Conclusion
The PCR cycle, built on the elegant simplicity of denaturation, annealing, and extension, has evolved into a diverse family of sophisticated technologies indispensable to modern bioscience. From its foundational principles to advanced methodologies like qPCR and dPCR, a deep understanding of each step and component is crucial for successful application. Mastering troubleshooting and optimization ensures data reliability, while rigorous validation allows researchers to select the most appropriate technology for their specific needs, whether it's the relative quantification of qPCR or the absolute precision of dPCR. As these technologies continue to advance, they will undoubtedly unlock further breakthroughs in clinical diagnostics, therapeutic development, and our fundamental understanding of biology, solidifying PCR's role as a cornerstone technique for years to come.
References
- 1. Polymerase chain reaction [https://en.wikipedia.org/wiki/Polymerase_chain_reaction]
- 2. The History of PCR and importance for genomic research [https://www.idtdna.com/page/support-and-education/decoded-plus/pcr-its-history-and-importance-for-genomic-research/]
- 3. What is Polymerase Chain Reaction (PCR) [https://www.addgene.org/protocols/pcr/]
- 4. Polymerase Chain Reaction (PCR) - NCBI - NIH [https://www.ncbi.nlm.nih.gov/probe/docs/techpcr/]
- 5. Integrating biotechnology into diagnostic labs: Innovations ... [https://www.sciencedirect.com/science/article/pii/S2590262825000565]
- 6. Polymerase Chain Reaction (PCR) - StatPearls - NCBI - NIH [https://www.ncbi.nlm.nih.gov/books/NBK589663/]
- 7. The History of PCR [https://www.thermofisher.com/us/en/home/brands/thermo-scientific/molecular-biology/molecular-biology-learning-center/molecular-biology-resource-library/spotlight-articles/history-pcr.html]
- 8. Standard PCR Protocol [https://www.sigmaaldrich.com/US/en/technical-documents/protocol/genomics/pcr/standard-pcr?srsltid=AfmBOorwlOXN8tG7lMe0uXw2wuFSBgqKAF30s-yotXm-n0OM8TS0EBpD]
- 9. Advances in Molecular Diagnostics: How PCR is Shaping ... [https://nanodiagnostika.lt/advances-molecular-diagnostics-pcr-future-medicine/]
- 10. A brighter future with advances in PCR [https://www.nature.com/articles/d42473-024-00261-6]
- 11. PCR Basics | Thermo Fisher Scientific - US [https://www.thermofisher.com/us/en/home/life-science/cloning/cloning-learning-center/invitrogen-school-of-molecular-biology/pcr-education/pcr-reagents-enzymes/pcr-basics.html]
- 12. Three Steps of PCR Cycle – Denaturation, Annealing, and ... [https://www.letstalkacademy.com/three-steps-of-pcr-cycle-denaturation-annealing-extension/]
- 13. How does PCR work and what are its 3 steps? | INTEGRA [https://www.integra-biosciences.com/united-states/en/blog/article/how-does-pcr-work]
- 14. Polymerase Chain Reaction [https://www.sigmaaldrich.com/US/en/technical-documents/technical-article/genomics/pcr/polymerase-chain-reaction?srsltid=AfmBOoonDBCbgBk30tAscIqeYNbW96-L-F-8dhKcLb-6mX4kohCysAZQ]
- 15. Optimizing PCR: Proven Tips and Troubleshooting Tricks [https://www.the-scientist.com/optimizing-pcr-proven-tips-and-troubleshooting-tricks-71660]
- 16. PCR Cycling Parameters—Six Key Considerations for ... [https://www.thermofisher.com/us/en/home/life-science/cloning/cloning-learning-center/invitrogen-school-of-molecular-biology/pcr-education/pcr-reagents-enzymes/pcr-cycling-considerations.html]
- 17. PCR Optimization: Factors Affecting Reaction Specificity ... [https://www.mybiosource.com/learn/pcr-optimization-factors-affecting-reaction-specificity-and-efficien/]
- 18. Optimizing PCR Reaction Conditions for High Fidelity and ... [https://www.labx.com/resources/optimizing-pcr-reaction-conditions-for-high-fidelity-and-yield/5579]
- 19. Five Essential Elements of PCR [https://www.bocsci.com/resources/five-essential-elements-of-pcr.html?srsltid=AfmBOoomx4k2e6ytHyrMa9otqK4kYsJXHD6_wt2JwVPHVxG79pAUP6bd]
- 20. Polymerase Chain Reaction [https://www.snapgene.com/guides/polymerase-chain-reaction]
- 21. PCR Setup—Six Critical Components to Consider [https://www.thermofisher.com/us/en/home/life-science/cloning/cloning-learning-center/invitrogen-school-of-molecular-biology/pcr-education/pcr-reagents-enzymes/pcr-component-considerations.html]
- 22. Standard PCR Protocol [https://www.sigmaaldrich.com/US/en/technical-documents/protocol/genomics/pcr/standard-pcr?srsltid=AfmBOoplFNstuxPdSauaXPjnOQQEvbSLoBVEXfx-XWao87KeH-gPQNKk]
- 23. PCR 热循环仪概览| Thermo Fisher Scientific - CN - 赛默飞 [https://www.thermofisher.cn/cn/zh/home/life-science/cloning/cloning-learning-center/invitrogen-school-of-molecular-biology/pcr-education/pcr-thermal-cyclers/pcr-thermal-cyclers-overview.html]
- 24. 聚合酶連鎖反應 [https://www.sigmaaldrich.com/TW/zh/technical-documents/technical-article/genomics/pcr/polymerase-chain-reaction?srsltid=AfmBOoqE1eS1G0daxUPO4LRe-bqB0plvjn0v5Tn6ESK227EmG7AO9dQN]
- 25. 聚合酶链式反应 - 维基百科 [https://zh.wikipedia.org/zh-hans/%E8%81%9A%E5%90%88%E9%85%B6%E9%93%BE%E5%BC%8F%E5%8F%8D%E5%BA%94]
- 26. 使用Node-RED爬虫并基于ECharts可视化某楼盘的销售情况 [https://blog.csdn.net/z924219829/article/details/136966930]
- 27. 实时荧光定量PCR原理及基础知识 - 赛默飞 [https://www.thermofisher.cn/cn/zh/home/life-science/pcr/real-time-pcr/real-time-pcr-learning-center/real-time-pcr-basics/essentials-real-time-pcr.html]
- 28. 实时荧光定量PCR实验数据分析(超全教程)-企业动态 [https://www.biomart.cn/news/16/3173191.htm]
- 29. Polymerase Chain Reaction (PCR) - PMC [https://pmc.ncbi.nlm.nih.gov/articles/PMC4102308/]
- 30. dPCR vs qPCR vs end-point PCR [https://www.qiagen.com/us/knowledge-and-support/knowledge-hub/bench-guide/pcr/digital-pcr/digital-pcr-vs-quantitative-pcr-vs-end-point-pcr]
- 31. 5 Steps to Efficient PCR [https://www.thermofisher.com/us/en/home/life-science/pcr/5-steps-pcr.html]
- 32. PCR and Gel Electrophoresis [https://iastate.pressbooks.pub/genagbiotech/chapter/pcr-and-gel-electrophoresis/]
- 33. How to Interpret DNA Gel Electrophoresis Results [https://www.goldbio.com/blogs/articles/interpreting-gel-electrophoresis-results?srsltid=AfmBOorBVIcW1VvGR5k9eSiZHdIpqIaPcauC38j0AkpBAEhsrK4SS6Q8]
- 34. Interpreting Electrophoresis Gels [https://bento.bio/resources/bento-lab-advice/interpreting-electrophoresis-gels-with-bento-lab/]
- 35. PCR Cycling Parameters—Six Key Considerations for ... [https://www.thermofisher.com/us/en/home/life-science/cloning/cloning-learning-center/invitrogen-school-of-molecular-biology/pcr-education/pcr-reagents-enzymes/pcr-cycling-considerations.html/1000]
- 36. Introduction to Quantitative PCR (qPCR) Gene Expression ... [https://www.thermofisher.com/es/en/home/life-science/pcr/real-time-pcr/real-time-pcr-learning-center/gene-expression-analysis-real-time-pcr-information/introduction-gene-expression.html]
- 37. Basic principles of real-time quantitative PCR [https://pubmed.ncbi.nlm.nih.gov/15833050/]
- 38. Principles of Real-time Quantitative PCR [https://www.cd-genomics.com/diseasepanel/resource/principles-real-time-quantitative-pcr.html]
- 39. PCR/qPCR Data Analysis [https://www.sigmaaldrich.com/US/en/technical-documents/technical-article/genomics/qpcr/data-analysis?srsltid=AfmBOop6eNt2a3pNUzxDsPwwQl_gcKfMFzWCv0YGV4NbezBHGXQ1Fhrr]
- 40. Simplify the complex! Let me guide you through qPCR data ... [https://www.yeasenbio.com/blogs/molecular-biology/simplify-the-complex-let-me-guide-you-through-qpcr-data-analysis-with-ease]
- 41. Optimizing your PCR [https://www.takarabio.com/learning-centers/pcr/faq/optimization?srsltid=AfmBOorqdFnC_j4k10-2peXTyWRxRPwjxVCZiXQQYX_GJxUy0iplmXZj]
- 42. Polymerase Chain Reaction: Basic Protocol Plus ... [https://pmc.ncbi.nlm.nih.gov/articles/PMC4846334/]
- 43. Reverse transcription polymerase chain reaction [https://en.wikipedia.org/wiki/Reverse_transcription_polymerase_chain_reaction]
- 44. The Basics of Reverse Transcription PCR (RT-PCR) [https://www.excedr.com/resources/the-basics-of-reverse-transcription-pcr-rt-pcr]
- 45. Reverse Transcription PCR (RT-PCR): Principle, Enzymes ... [https://microbenotes.com/rt-pcr-definition-principle-enzymes-types-steps-uses/]
- 46. Five Steps to Fast RT-PCR [https://www.thermofisher.com/us/en/home/life-science/pcr/reverse-transcription/superscript-iv-one-step-rt-pcr-system/5-steps-rtpcr.html]
- 47. Basic Principles of RT-qPCR [https://www.thermofisher.com/us/en/home/brands/thermo-scientific/molecular-biology/molecular-biology-learning-center/molecular-biology-resource-library/spotlight-articles/basic-principles-rt-qpcr.html]
- 48. RT-PCR Protocol [https://www.creative-biogene.com/support/rt-pcr-protocol.html]
- 49. Real-Time qRT-PCR - NCBI - NIH [https://www.ncbi.nlm.nih.gov/probe/docs/techqpcr/]
- 50. Digital PCR: from early developments to its future application ... [https://pubs.rsc.org/en/content/articlehtml/2025/lc/d5lc00055f]
- 51. Fundamentals of digital PCR [https://www.qiagen.com/us/knowledge-and-support/knowledge-hub/bench-guide/pcr/digital-pcr/what-is-digital-pcr]
- 52. dPCR: A Technology Review - PMC - PubMed Central [https://pmc.ncbi.nlm.nih.gov/articles/PMC5948698/]
- 53. Introduction to Quantitative PCR (qPCR) Gene Expression ... [https://www.thermofisher.com/us/en/home/life-science/pcr/real-time-pcr/real-time-pcr-learning-center/gene-expression-analysis-real-time-pcr-information/introduction-gene-expression.html]
- 54. Understanding Fluorescent Quantitative PCR (qPCR) Curves [https://www.cd-genomics.com/resource-understanding-fluorescent-quantitative-pcr-curves.html]
- 55. Benchmarking digital PCR partition classification methods ... [https://pmc.ncbi.nlm.nih.gov/articles/PMC10981767/]
- 56. Multiplex PCR: Optimization and Application in Diagnostic ... [https://pmc.ncbi.nlm.nih.gov/articles/PMC88949/]
- 57. Multiplex PCR: Definition, Principle and Application [https://www.bocsci.com/resources/multiplex-pcr-definition-principle-and-application.html?srsltid=AfmBOoqmZ1Utjom9wX8AwP0VLymqkBvtXcki1UXG_35llwLy99Zy248Q]
- 58. Multiplex PCR Kit Market Boosted by Genetic Diagnostics [https://www.towardshealthcare.com/insights/multiplex-pcr-kit-market-sizing]
- 59. Development and Validation of a Quantitative PCR Method ... [https://www.sciencedirect.com/science/article/pii/S0362028X22054242]
- 60. Development and validation of multiplex real-time PCR for ... [https://pmc.ncbi.nlm.nih.gov/articles/PMC10848345/]
- 61. Design and validation of a multiplex PCR method for the ... [https://www.nature.com/articles/s41598-023-47007-w]
- 62. PCR-based diagnostics for infectious diseases [https://pmc.ncbi.nlm.nih.gov/articles/PMC7106425/]
- 63. Real-Time Polymerase Chain Reaction: Current Techniques ... [https://pmc.ncbi.nlm.nih.gov/articles/PMC9778061/]
- 64. Standard PCR Protocol [https://www.sigmaaldrich.com/US/en/technical-documents/protocol/genomics/pcr/standard-pcr?srsltid=AfmBOoqKHYuiA1mRWj-MpZtjblLDDct3KhND6R-Lor__hr3iFdDA5xMO]
- 65. Polymerases for NGS Library Preparation [https://www.neb.com/en-us/applications/dna-amplification-pcr-and-qpcr/specialty-pcr/polymerases-for-ngs-library-preparation?srsltid=AfmBOoq_3eXs8Z5I07KngVp8qTHraxfyf5pQx50etiZxlGkvclkMa_F-]
- 66. Applications of PCR in Drug Development [https://kcasbio.com/blogs/pcr-applications-drug-development/]
- 67. Review Immuno-PCR: Advancements, and applications for ... [https://www.sciencedirect.com/science/article/abs/pii/S0009898125002888]
- 68. PCR Test: What It Is, How It Works & Results [https://my.clevelandclinic.org/health/diagnostics/21462-covid-19-and-pcr-testing]
- 69. PCR Application Ready Work Cell (NGS) [https://highresbio.com/applications/ready-work-cells/pcr-ngs]
- 70. PCR cycle steps [https://www.qiagen.com/us/knowledge-and-support/knowledge-hub/bench-guide/pcr/introduction/pcr-cycling]
- 71. PCR Troubleshooting Guide | Thermo Fisher Scientific - US [https://www.thermofisher.com/us/en/home/life-science/cloning/cloning-learning-center/invitrogen-school-of-molecular-biology/pcr-education/pcr-reagents-enzymes/pcr-troubleshooting.html]
- 72. Troubleshooting primer dimer in PCR [https://www.minipcr.com/primer-dimer-pcr/]
- 73. Eliminating primer dimers and improving SNP detection ... [https://pmc.ncbi.nlm.nih.gov/articles/PMC7200914/]
- 74. PCR Optimization: Strategies To Minimize Primer Dimer [https://genemod.net/blog/pcr-optimization]
- 75. PCR Primer Design Tips - Behind the Bench [https://www.thermofisher.com/blog/behindthebench/pcr-primer-design-tips/]
- 76. What is PCR? (Polymerase chain reaction) [https://www.yourgenome.org/theme/what-is-pcr-polymerase-chain-reaction/]
- 77. Predicting sequence-specific amplification efficiency in ... [https://www.nature.com/articles/s41467-025-64221-4]
- 78. Primer design guide - 5 tips for best PCR results [https://the-dna-universe.com/2022/09/05/primer-design-guide-the-top-5-factors-to-consider-for-optimum-performance/]
- 79. Faster PCR Optimization [https://bitesizebio.com/31937/optimizing-your-pcr-faster/]
- 80. Primer designing tool - NCBI - NIH [https://www.ncbi.nlm.nih.gov/tools/primer-blast/]
- 81. Comprehensive review and meta-analysis of magnesium ... [https://pubmed.ncbi.nlm.nih.gov/40436087/]
- 82. Rules and Tips for PCR & qPCR Primer Design | IDT [https://www.idtdna.com/page/support-and-education/decoded-plus/how-to-design-primers-and-probes-for-pcr-and-qpcr/]
- 83. Bovine serum albumin further enhances the effects of organic ... [https://pmc.ncbi.nlm.nih.gov/articles/PMC3466135/]
- 84. Enhancement of DNA amplification efficiency by using ... [https://www.bocsci.com/blog/enhancement-of-dna-amplification-efficiency-by-using-pcr-additives/?srsltid=AfmBOorGhhqY_N-gRbU20IB-nbVZ9Kp2aRZ2PgNs3LoW_5xWcTBE3Wkg]
- 85. PCR Problems? Try an Additive [https://bitesizebio.com/24/pcr-problems-try-an-additive/]
- 86. Why Add BSA to PCR Mixes? The Science Behind ... [https://synapse.patsnap.com/article/why-add-bsa-to-pcr-mixes-the-science-behind-stabilization]
- 87. PCR optimization for buccal swab-derived samples [https://pubmed.ncbi.nlm.nih.gov/41272443/]
- 88. Guidelines for PCR Optimization with Taq DNA Polymerase [https://www.neb.com/en-us/tools-and-resources/usage-guidelines/guidelines-for-pcr-optimization-with-taq-dna-polymerase?srsltid=AfmBOoqaYPVbcWu_qUKehJbbNIx8Gkwp1rSuhMvgri9HOKkSEw3_2xwu]
- 89. —Four Key Characteristics for DNA Polymerase PCR [https://www.thermofisher.com/ru/ru/home/life-science/cloning/cloning-learning-center/invitrogen-school-of-molecular-biology/pcr-education/pcr-reagents-enzymes/dna-polymerase-characteristics.html]
- 90. How is Hot-Start Technology Beneficial For Your PCR [https://www.thermofisher.com/us/en/home/brands/thermo-scientific/molecular-biology/molecular-biology-learning-center/molecular-biology-resource-library/spotlight-articles/hot-start-technology-benefits-PCR.html]
- 91. What does DNA polymerase fidelity mean? [https://www.neb.com/en-us/tools-and-resources/feature-articles/polymerase-fidelity-what-is-it-and-what-does-it-mean-for-your-pcr?srsltid=AfmBOorrxReQ4S4vk2rWmU0AblX_rRyPPsWR4fGi5rqof60MpgyDwwVd]
- 92. High-fidelity PCR enzyme with DNA-binding domain facilitates ... [https://pmc.ncbi.nlm.nih.gov/articles/PMC5453909/]
- 93. Hot Start Taq DNA Polymerase [https://www.neb.com/en-us/products/m0495-hot-start-taq-dna-polymerase?srsltid=AfmBOoqGPKVOyj_KSYfV2Ta_w_bPbigiRZEmcGPPI8qPNliDV92AzWFu]
- 94. Hot Start PCR with heat-activatable primers [https://pmc.ncbi.nlm.nih.gov/articles/PMC2582603/]
- 95. DNA Polymerase Selection Chart [https://www.neb.com/en-us/tools-and-resources/selection-charts/dna-polymerase-selection-chart?srsltid=AfmBOoq6iqFVy5xs5JzhSTQ5uTbw2XoCQ--3KfxZDShgTkkBg4zi4wwZ]
- 96. Quantitative PCR validation for research scientists: Part 1 of 2 [https://virologyresearchservices.com/2023/01/13/quantitative-pcr-validation-part-1-of-2/]
- 97. Efficiency of Real-Time PCR [https://www.thermofisher.com/us/en/home/life-science/pcr/real-time-pcr/real-time-pcr-learning-center/real-time-pcr-basics/efficiency-real-time-pcr-qpcr.html]
- 98. Understanding Ct Values in Real-Time PCR [https://www.thermofisher.com/blog/behindthebench/understanding-ct-values/]
- 99. Interpretation of PCR results [https://www.vet.cornell.edu/animal-health-diagnostic-center/testing-laboratories/molecular-diagnostics/interpretation-pcr-results]
- 100. PCR efficiency | Determining amplification efficiencies [https://www.qiagen.com/us/knowledge-and-support/knowledge-hub/bench-guide/pcr/pcr-quantification/determining-amplification-efficiencies]
- 101. Understanding qPCR Efficiency and Why It Exceeds 100% [https://biosistemika.com/blog/qpcr-efficiency-over-100/]
- 102. Validating Real-Time Polymerase Chain Reaction (PCR) Assays [https://pmc.ncbi.nlm.nih.gov/articles/PMC7834634/]
- 103. Digital PCR (dPCR) vs Real-Time PCR (qPCR) [https://firalismolecularprecision.com/2025/04/09/dpcr-qpcr-differences/]
- 104. Comparison of two digital PCR platforms for quantification ... [https://pmc.ncbi.nlm.nih.gov/articles/PMC12622311/]
- 105. Comparing the precision of two digital PCR applications for ... [https://www.nature.com/articles/s41598-025-13143-8]
- 106. Digital PCR outperforms quantitative real-time PCR for the ... [https://pmc.ncbi.nlm.nih.gov/articles/PMC12288185/]
- 107. Quantitative or digital PCR? A comparative analysis for ... [https://www.sciencedirect.com/science/article/abs/pii/S0165993624001584]
- 108. The hidden limits of digital PCR and what comes next [https://countablelabs.com/blog/the-hidden-limits-of-digital-pcr-and-what-comes-next]
- 109. Comparative Performance of Digital PCR and Real-Time RT ... [https://pmc.ncbi.nlm.nih.gov/articles/PMC12474457/]
- 110. In-house validation of a droplet digital PCR system using ... [https://www.sciencedirect.com/science/article/abs/pii/S0003267025005665]
- 111. Suitability of Real-Time PCR Methods for New Genomic ... [https://pmc.ncbi.nlm.nih.gov/articles/PMC11989662/]
- 112. Evaluation validation of a qPCR analysis method and... curve [https://pmc.ncbi.nlm.nih.gov/articles/PMC8596907/]
- 113. Learn about the importance of the qPCR standard curve [https://bitesizebio.com/31470/obligate-qpcr-standard-curve/]
- 114. qPCR Steps: Creating a Successful Experiment | IDT [https://www.idtdna.com/page/support-and-education/decoded-plus/successful-qpcr/]
- 115. How To Interpret RT-qPCR Results [https://www.goldbio.com/blogs/articles/how-to-interpret-rt-qpcr-results?srsltid=AfmBOop0Iy_vTzQ362nT5iIMs7g5xITVWyOoRpVXHVrtcO0nu62HriVn]
- 116. Polymerase Chain Reaction [https://www.sigmaaldrich.com/US/en/technical-documents/technical-article/genomics/pcr/polymerase-chain-reaction?srsltid=AfmBOoqaM2tS-AXc3hV-h9ATOP1Q3ct7qhmsgJaLFM4TOW5q04MdUFHl]
- 117. Digital PCR: from early developments to its future application ... [https://pmc.ncbi.nlm.nih.gov/articles/PMC12278255/]
- 118. Droplet Digital PCR: Advantages and Applications in ... [https://www.labx.com/resources/droplet-digital-pcr-advantages-and-applications-in-molecular-diagnostics/5581]
- 119. Evaluation of normalisation strategies for qPCR data ... [https://www.nature.com/articles/s41598-025-06657-8]
- 120. A comparison of normalization methods for the expression of ... [https://pmc.ncbi.nlm.nih.gov/articles/PMC12312509/]
- 121. Analyzing qPCR data: Better practices to facilitate rigor and ... [https://www.sciencedirect.com/science/article/pii/S2405580825004431]