Template DNA Preparation and QC: Best Practices for Reproducibility in Research and Biomanufacturing
This article provides a comprehensive guide to DNA template preparation and quality control, essential for ensuring reproducibility and reliability in downstream applications like cell-free protein production, next-generation sequencing, and clinical...
Template DNA Preparation and QC: Best Practices for Reproducibility in Research and Biomanufacturing
Abstract
This article provides a comprehensive guide to DNA template preparation and quality control, essential for ensuring reproducibility and reliability in downstream applications like cell-free protein production, next-generation sequencing, and clinical diagnostics. It covers foundational principles of DNA variability, detailed methodological protocols for extraction and purification, systematic troubleshooting for common challenges, and rigorous validation frameworks aligned with current quality assurance standards. Designed for researchers, scientists, and drug development professionals, this resource synthesizes current best practices to minimize experimental variability and enhance data integrity across biomedical research.
The Critical Role of DNA Quality: Foundations for Experimental Reproducibility
The fidelity of downstream biological applications, from next-generation sequencing to mRNA therapeutic production, is fundamentally dependent on the initial quality and integrity of the template DNA. Performance variability in these systems often originates from pre-analytical stages, specifically the preparation and quality control of nucleic acid templates. Contaminants, fragmentation, and inaccurate quantification introduced during DNA preparation can significantly impact enzymatic efficiency, data reliability, and experimental reproducibility [1] [2]. This application note details standardized protocols for DNA assessment and preparation, providing a framework to identify, control, and minimize these primary sources of variability, thereby enhancing the consistency and success of downstream biological applications.
Comprehensive DNA Quality Assessment
A multi-parametric approach is essential for accurately determining DNA quantity, purity, and integrity. Relying on a single method can mask critical quality issues that lead to performance variability.
Spectrophotometric Analysis for Quantification and Purity
Ultraviolet (UV) spectrophotometry provides a rapid initial assessment of DNA concentration and sample purity. The method is based on the absorbance of UV light by nucleic acids at 260 nm.
- Concentration Calculation: The fundamental relationship for double-stranded DNA (dsDNA) is an A260 of 1.0 equivalent to 50 µg/mL [3] [2]. Concentration (µg/mL) is calculated as: (A260 reading – A320 reading) × dilution factor × 50 µg/mL [3]. Modern microvolume instruments like the NanoDrop series enable accurate measurements from 1-2 µL sample volumes [4].
- Purity Ratios: Absorbance ratios are critical for detecting common contaminants.
- A260/A280: This ratio assesses protein contamination. Pure DNA typically has a ratio of ~1.8, while a lower ratio suggests protein carryover [1] [3].
- A260/A230: This ratio indicates the presence of co-purified reagents such as salts, EDTA, or organic solvents (e.g., phenol). A ratio of 2.0–2.2 is generally accepted for pure DNA [1].
- Limitations and Dynamic Range: Spectrophotometry cannot distinguish between DNA, RNA, and single-stranded nucleotides, potentially leading to overestimation of dsDNA concentration if contaminated with RNA [1] [3]. Users must also be aware of the instrument's linear dynamic range, which varies by model from 2–15,000 ng/µL for the NanoDrop 2000 to 0.2–27,500 ng/µL for the NanoDrop One [4].
Fluorometric Quantification for Accurate Mass Measurement
For applications requiring high accuracy, fluorometric methods using DNA-binding dyes are recommended. This method is highly specific for dsDNA and is not influenced by the presence of nucleotides, RNA, or common contaminants that affect spectrophotometry [1] [3]. Fluorometers like the Qubit are considered the gold standard for quantifying the mass of DNA input prior to library preparation for sequencing [1]. This method is particularly crucial for low-concentration samples or when working with precious, limited quantities of DNA, as it is more sensitive than absorbance-based methods [3].
Electrophoretic Analysis for Integrity and Size Distribution
Assessing DNA integrity is vital for applications requiring high molecular weight (HMW) DNA or specific fragment sizes.
- Gel Electrophoresis: Conventional agarose gels can resolve DNA fragments up to 15–20 kb. To assess HMW DNA, pulsed-field gel electrophoresis or low-percentage agarose gels are used to detect shearing or degradation [1]. Visually, intact HMW DNA appears as a tight, high-molecular-weight band, while degraded DNA manifests as a smear of lower molecular weight fragments [1].
- Capillary Gel Electrophoresis (CGE): Instruments like the Agilent 2100 Bioanalyzer or Femto Pulse System provide a quantitative, automated, and high-resolution alternative to gels. CGE generates an electrophoretogram that precisely profiles the size distribution of DNA fragments in a sample, which is indispensable for verifying fragment size after shearing or for quantifying the different topological forms of plasmid DNA (supercoiled, open-circular, and linear) [5]. The Femto Pulse is specifically recommended for fragments >10 kb, for which the Bioanalyzer is not suitable [1].
Table 1: DNA Quality Control Techniques Comparison
| Method | Parameter Measured | Key Metric | Advantages | Limitations |
|---|---|---|---|---|
| UV Spectrophotometry (NanoDrop) | Concentration & Purity | A260/A280 ~1.8; A260/A230 2.0-2.2 [1] | Fast; small sample volume (1-2 µL) [4] | Overestimates if RNA/single-stranded nucleotides present; detects some contaminants [1] |
| Fluorometry (Qubit) | DNA Mass | ng/µL (specific for dsDNA) | Highly specific for dsDNA; insensitive to common contaminants [1] [3] | Requires specific standards; does not assess purity or integrity |
| Gel Electrophoresis | Integrity & Size | Visual assessment of band intensity/size | Low cost; assesses integrity and approximate size [1] [3] | Semi-quantitative; low resolution for large fragments (>20 kb) [1] |
| Capillary Gel Electrophoresis (Bioanalyzer) | Integrity, Size & Quantification | DNA Integrity Number (DIN); precise fragment sizing | High sensitivity and quantitative size distribution; small sample size [5] | Higher cost; limited dynamic range for very large fragments [1] |
DNA Preparation Methodologies
The choice of DNA preparation method is a major determinant of template quality and a significant source of performance variability.
Conventional Plasmid DNA Preparation
The traditional method for generating linear DNA templates for techniques like in vitro transcription (IVT) involves propagating circular plasmid DNA in bacteria, followed by purification and enzymatic linearization [6]. While well-established, this process is time-consuming, labor-intensive, and can be hampered by bacterial toxicity of certain DNA sequences, such as long poly(dT) tracts, leading to low yields [6]. Quality control of the final linearized plasmid is critical and should confirm complete linearization and quantify the proportion of undesirable topological forms (e.g., supercoiled, open-circular) [5].
PCR-Generated DNA Templates
PCR-based generation of linear DNA templates offers a rapid, cell-free alternative to plasmid propagation. Recent systematic comparisons show that PCR-generated templates can yield higher amounts of both DNA and transcribed mRNA compared to traditional linearized plasmids, without compromising mRNA quality or the immunogenicity of resulting mRNA-lipid nanoparticle (LNP) vaccines [6]. This method is particularly advantageous for high-throughput synthesis of multiple constructs and for sequences that are unstable in bacterial hosts [6].
Specialized Techniques for Challenging Samples
Working with low-template or challenging samples (e.g., forensic, ancient DNA, or single cells) requires specialized methods to overcome stochastic effects and amplification artifacts.
- Handling Low-Template DNA (LT-DNA): LT-DNA analysis is prone to artifacts like increased stutter and allele dropout. A semi-linear amplification method (abSLA PCR) using primers containing abasic sites has been developed to improve allele recovery. In this technique, an abasic site in one primer prevents the nascent strand from serving as a template in subsequent cycles, reducing the exponential accumulation of artifacts and enabling more robust short tandem repeat (STR) profiling from single cells or low genomic DNA inputs [7].
- Optimizing Extraction from Difficult Matrices: Tough samples like bone require a combination of chemical and mechanical lysis. Chemical demineralization with EDTA must be carefully balanced, as it is a known PCR inhibitor [8]. Coupling this with controlled mechanical homogenization using instruments like the Bead Ruptor Elite can reduce preparation time while improving DNA integrity by minimizing excessive shearing and controlling heat generation [8].
Detailed Experimental Protocols
Protocol: Quality Control Workflow for Template DNA
This protocol ensures DNA is of sufficient quality for downstream enzymatic applications like sequencing or IVT.
Materials & Reagents:
- Purified DNA sample
- Nuclease-free water or TE buffer
- Qubit dsDNA HS Assay Kit (Thermo Fisher Scientific)
- NanoDrop Spectrophotometer or equivalent
- Agilent 2100 Bioanalyzer with DNA-specific kit (e.g., High Sensitivity DNA Kit)
Procedure:
- Spectrophotometric Purity Check:
- Blank the spectrophotometer with 1.5 µL of nuclease-free water or TE buffer [4].
- Apply 1.5 µL of the DNA sample to the pedestal and measure the absorbance spectrum from 230 nm to 320 nm.
- Record the concentration and the A260/A280 and A260/A230 ratios. Proceed only if ratios are approximately 1.8 and 2.0-2.2, respectively [1].
Fluorometric Quantification:
- Prepare the Qubit working solution according to the kit instructions.
- Add 1-20 µL of each standard and sample to separate Qubit assay tubes.
- Add Qubit working solution to each tube to a final volume of 200 µL, mix thoroughly, and incubate for 2 minutes.
- Measure the samples on the Qubit fluorometer and record the concentration in ng/µL. This value should be used for calculating inputs in downstream applications [1].
Fragment Size Analysis via Bioanalyzer:
- Prepare the gel-dye mix, priming solution, and samples as detailed in the kit protocol.
- Load the gel-dye mix into the appropriate well on the chip.
- Load the marker and DNA samples into the designated wells.
- Run the chip in the Bioanalyzer instrument. The resulting electrophoretogram will show the fragment size distribution, allowing assessment of degradation or verification of the expected fragment size [1] [5].
Expected Outcomes: High-quality, high molecular weight genomic DNA should show a tight distribution of long fragments on the Bioanalyzer, a Qubit concentration that matches the NanoDrop reading, and optimal purity ratios. A low A260/A280 ratio or a smeared Bioanalyzer profile indicates protein contamination or degradation, respectively, and the sample should be repurified.
Protocol: Preparation of PCR-Generated DNA Templates for IVT
This protocol describes a bacteria-free method to generate high-quality linear DNA for mRNA synthesis [6].
Materials & Reagents:
- High-fidelity DNA polymerase (e.g., Phusion Plus, KAPA HiFi)
- dNTPs
- Forward primer with 5' T7 promoter sequence (TAATACGACTCACTATAGGG)
- Reverse primer
- DNA template (plasmid or gBlock)
- PCR purification kit
Procedure:
- PCR Reaction Setup:
- Assemble the following reaction on ice:
- Nuclease-free water: to 50 µL final volume
- 10X High-fidelity PCR buffer: 5 µL
- dNTPs (10 mM each): 1 µL
- Forward primer (10 µM): 2.5 µL
- Reverse primer (10 µM): 2.5 µL
- DNA template (1-10 ng): 1 µL
- DNA Polymerase: 0.5 µL
- Mix gently and centrifuge to collect the reaction.
- Assemble the following reaction on ice:
PCR Amplification:
- Run the following thermocycling program:
- Initial Denaturation: 98°C for 30 s
- 25-35 cycles of:
- Denaturation: 98°C for 10 s
- Annealing: 60°C for 30 s
- Extension: 72°C for 30 s/kb
- Final Extension: 72°C for 5 min
- Hold: 4°C
- Run the following thermocycling program:
PCR Product Purification:
- Verify successful amplification and specificity by running 5 µL of the product on an agarose gel.
- Purify the remaining PCR product using a PCR purification kit according to the manufacturer's instructions. Elute in nuclease-free water or TE buffer.
- Quantify the purified DNA using the Qubit fluorometer and assess purity via NanoDrop. Analyze the fragment size and purity using the Bioanalyzer to confirm a single, sharp peak of the expected size.
Expected Outcomes: A successful preparation yields a single, discrete band on the agarose gel and a single, sharp peak on the Bioanalyzer trace. The DNA should have A260/A280 and A260/A230 ratios within the expected range for pure DNA. This template is now suitable for IVT reactions.
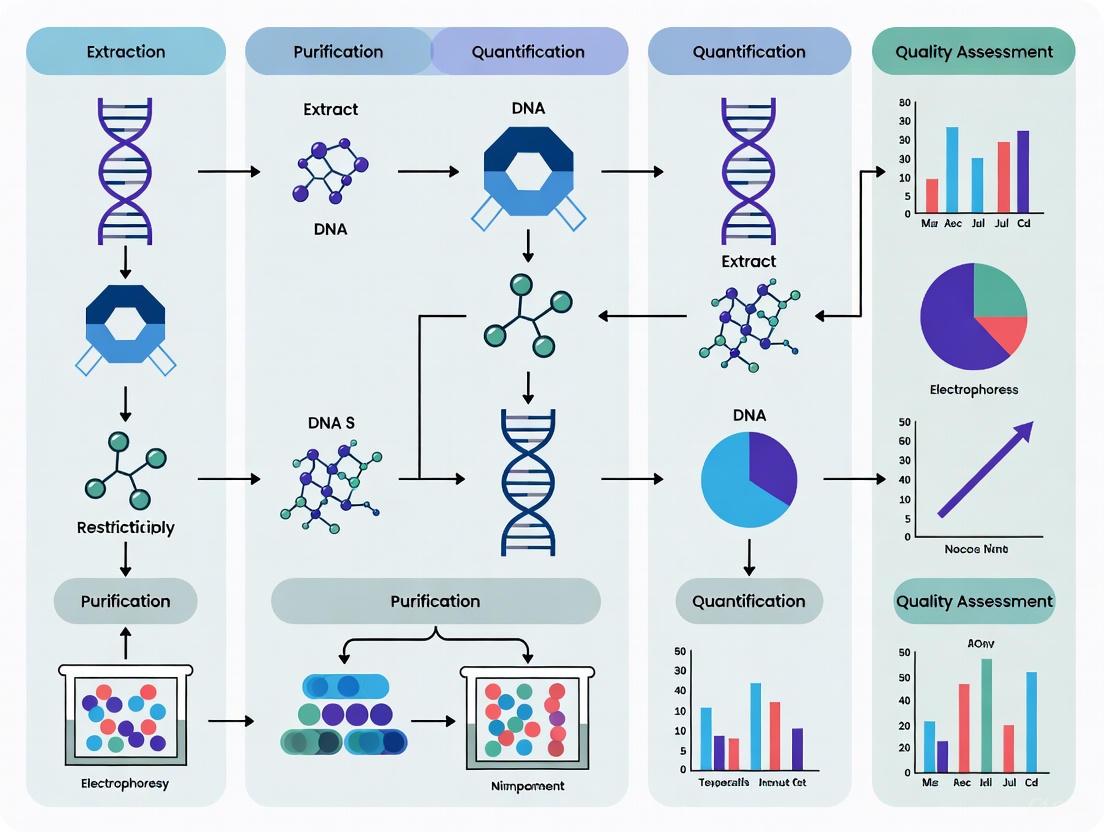
Workflow Visualization and Reagent Solutions
DNA Template Preparation and QC Workflow
The following diagram illustrates the integrated workflow for preparing and quality-controlling DNA templates, highlighting critical checkpoints to control performance variability.
Essential Research Reagent Solutions
Table 2: Key Reagents and Kits for DNA Preparation and Quality Control
| Item | Function/Application | Key Characteristics |
|---|---|---|
| Qubit dsDNA HS/BR Assay Kits | Fluorometric quantification of dsDNA mass [1] | Highly specific for dsDNA; insensitive to RNA, nucleotides, or salts; essential for accurate library input quantification. |
| NanoDrop Spectrophotometer | Microvolume spectrophotometry for concentration and purity screening [4] | Requires only 1-2 µL of sample; provides A260/280 and A260/230 purity ratios for rapid contamination assessment. |
| Agilent 2100 Bioanalyzer/Femto Pulse | Capillary gel electrophoresis for DNA integrity and size analysis [1] [5] | Provides quantitative, high-resolution sizing; Femto Pulse is optimized for fragments >10 kb. |
| High-Fidelity DNA Polymerase | PCR-generation of linear DNA templates for IVT [6] | Offers high accuracy and yield for producing high-quality, protein-coding DNA templates without bacterial cloning. |
| Bead Ruptor Elite Homogenizer | Mechanical lysis of challenging samples (e.g., bone, tissue) [8] | Enables controlled, efficient cell disruption while minimizing DNA shearing through adjustable speed and temperature parameters. |
| GenElute gDNA Purification Kit | Silica-column-based purification of genomic DNA [2] | Efficiently recovers high-quality DNA while removing contaminants and enzyme inhibitors like proteins and salts. |
Systematic Factors Affecting DNA Template Quality and Function
The reliability of any experiment or diagnostic assay involving DNA is fundamentally constrained by the quality of the template. Systematic factors influencing this quality span from initial sample collection and handling to the molecular integrity of the DNA itself. This application note delineates these critical factors, provides validated protocols for quality assessment, and offers a toolkit to ensure DNA template functionality in downstream applications such as sequencing, PCR, and genotyping.
Systematic Factors and Their Impact on DNA Quality
The quality and functional utility of a DNA template are governed by a complex interplay of pre-analytical, environmental, and molecular factors. Understanding these is crucial for diagnosing issues and selecting appropriate samples for specific applications.
Table 1: Systematic Factors Affecting DNA Template Quality
| Factor Category | Specific Factor | Impact on DNA Quality | Primary Effect on Downstream Function |
|---|---|---|---|
| Sample Origin & Type | FFPE vs. Fresh-Frozen Tissue | FFPE causes crosslinking, fragmentation, and deamination (C>T artifacts) [9]. | Reduced amplification efficiency; artifactual mutations in sequencing [9]. |
| Bone or Ancient Samples | Highly degraded, low-copy-number DNA, contaminated with inhibitors [10]. | High rates of allelic drop-out and genotyping failure in STR analysis [10]. | |
| Pre-Analytical Handling | Archival Duration (FFPE) | Inverse correlation between storage time and DNA integrity/amplifiability [9]. | Decreased sequencing uniformity and variant calling accuracy [9]. |
| Preservation Method | Inadequate freezing or use of wrong preservatives accelerates hydrolysis and oxidation [8]. | DNA fragmentation, making samples unsuitable for long-range PCR or sequencing. | |
| Molecular Integrity | Fragment Size Distribution | Majority of fragments <23 kb hinders large-insert library construction [11]. | Failure in PacBio or other long-read sequencing technologies [11]. |
| Presence of Abasic Sites | Blocks polymerase progression during replication and PCR [7]. | PCR amplification failure; can be exploited for specialized amplification schemes [7]. | |
| Chemical Purity | Contaminants (Phenol, Salt, EDTA) | Abnormal A260/A280 and A260/A230 ratios; EDTA is a known PCR inhibitor [12] [11] [8]. | Inhibition of polymerase enzymes in PCR and sequencing reactions [12]. |
| PCR Inhibitors (Heme, Humic Acids) | Co-purify with DNA from specific sample types like blood or soil [12]. | Partial or complete failure of DNA amplification [12]. |
Detailed Experimental Protocols for Quality Assessment
Rigorous quality control is non-negotiable. The following protocols provide a framework for assessing DNA quantity, purity, and integrity.
Protocol 1: Spectrophotometric and Fluorometric QC for DNA Purity and Quantity
This protocol uses complementary methods to accurately determine DNA concentration and detect common contaminants [12] [11].
- Sample Dilution: Dilute the DNA sample in the same elution buffer (e.g., TE buffer) used for storage. For spectrophotometry, use 1-2 µL. For fluorometry, use 1-10 µL as per kit instructions.
- Spectrophotometric Analysis (NanoDrop):
- Blank the instrument with the elution buffer.
- Apply 1-2 µL of diluted DNA and measure the absorbance.
- Record: Concentration (ng/µL), A260/A280 ratio, and A260/A230 ratio.
- Interpretation: Pure DNA has an A260/A280 ratio of ~1.8 and A260/A230 of ~2.0-2.2. Lower ratios indicate protein/phenol or salt/organic solvent contamination, respectively [11].
- Fluorometric Analysis (Qubit):
- Prepare the working solution by diluting the Qubit dsDNA HS reagent in the provided buffer.
- Add 1-10 µL of DNA sample to 199-190 µL of working solution. Vortex and incubate for 2 minutes.
- Read the concentration using the Qubit fluorometer.
- Interpretation: The Qubit system is specific for double-stranded DNA and provides a more accurate concentration than spectrophotometry, which can be skewed by contaminants [11].
Protocol 2: Gel Electrophoresis for DNA Integrity Assessment
This protocol visualizes the fragment size distribution of the extracted DNA, which is critical for choosing the right downstream application [12].
- Gel Preparation: Prepare a 1% agarose gel by dissolving 1 g of agarose powder in 100 mL of 1x TAE buffer. Heat until dissolved, cool to ~50°C, add a DNA intercalating dye (e.g., GelRed), and pour into a casting tray with a comb [9].
- Sample Preparation: Mix 10 µL of DNA sample with 2 µL of 6x loading dye [9].
- Electrophoresis: Load the sample and an appropriate molecular weight ladder (e.g., 50-10,000 bp). Run the gel at 100 V for 60 minutes in 1x TAE buffer [9].
- Visualization and Interpretation: Image the gel under UV light.
Protocol 3: qPCR Amplification Efficiency as a Functional Quality Metric
This protocol assesses the functional quality of the DNA by testing its amplifiability, which can reveal degradation or the presence of inhibitors not always evident from gels [12].
- Reaction Setup: Prepare a 10 µL reaction mix containing:
- 5 µL of 2x SYBR Green master mix.
- 1 µL of 4 µM forward primer.
- 1 µL of 4 µM reverse primer.
- 2 µL of nuclease-free water.
- 1 µL of DNA template (20 ng/µL recommended starting concentration) [9].
- qPCR Run: Perform amplification on a real-time PCR system with the following cycling conditions:
- Initial Denaturation: 95°C for 2 minutes.
- 40 Cycles: Denaturation at 95°C for 10 s, Annealing/Extension at 60°C for 30 s [9].
- Data Analysis:
- Cq Value: A significantly delayed Cq value compared to a high-quality control DNA indicates degradation or inhibition.
- Amplification Plot: Abnormal curve shapes can also suggest poor template quality.
DNA Quality Assessment Workflow
The following diagram synthesizes the core protocols into a standard operational workflow for comprehensive DNA quality assessment.
The Scientist's Toolkit: Key Research Reagent Solutions
Selecting the right reagents is critical for successful DNA extraction, repair, and analysis, especially for challenging samples.
Table 2: Essential Reagents and Kits for DNA Work
| Reagent / Kit | Primary Function | Example Application |
|---|---|---|
| QIAamp DNA FFPE Kit (Qiagen) | Extracts DNA from formalin-fixed tissues while mitigating crosslinks [9]. | Recovery of amplifiable DNA from clinical FFPE archives for cancer research [9]. |
| PreCR Repair Mix (NEB) | Enzymatically repairs damaged bases (e.g., deaminated cytosines, oxidized guanines) [9]. | Reduces sequencing artifacts and improves amplification efficiency from degraded/FFPE DNA [9]. |
| Phusion Plus DNA Polymerase | High-fidelity polymerase that is effectively blocked by abasic sites, useful for specialized assays [7]. | Enables semi-linear amplification (abSLA PCR) strategies to improve STR typing from low-template DNA [7]. |
| GlobalFiler IQC PCR Amplification Kit | Optimized for amplifying low-template and degraded DNA samples for STR profiling [10]. | Generating DNA profiles from challenging forensic samples like bones [10]. |
| Bead Ruptor Elite Homogenizer | Mechanical homogenization for efficient lysis of tough samples (bone, tissue) with controlled parameters to minimize DNA shearing [8]. | Recovering high-quality DNA from difficult-to-lyse and limited starting materials [8]. |
Specialized Protocol for Low-Template and Damaged DNA
Challenging samples require advanced methods beyond standard protocols to recover genetic information.
Protocol 4: abSLA PCR for Enhanced STR Typing from Low-Template DNA
This method uses primers containing synthetic abasic sites to achieve semi-linear amplification, reducing stochastic effects and improving allele recovery from trace DNA [7].
- Primer Design: Design one primer per target (the "abasic primer") with a synthetic abasic site (e.g., a tetrahydrofuran moiety) located 8-10 nucleotides from the 3' end. The paired primer is conventional [7].
- Preamplification Reaction:
- Prepare a 10 µL reaction mix with:
- 5 µL of 2x Phusion Plus PCR Master Mix.
- 1 µL of primer mix (containing abasic and normal primers).
- 1 µL of low-template DNA.
- Thermal Cycling: Initial denaturation at 98°C for 30 s; followed by 15 cycles of: 94°C for 10 s, 60°C for 3 min, 72°C for 25 s; final extension at 72°C [7].
- Prepare a 10 µL reaction mix with:
- Post-Processing: Use 1 µL of the abSLA PCR product as the template for a subsequent, standard multiplex STR amplification kit (e.g., Identifiler Plus) [7].
- Analysis: Analyze final PCR products by capillary electrophoresis. The abSLA pretreatment typically results in increased peak heights and recovery of more STR loci compared to direct amplification [7].
Advanced STR Analysis Workflow
The specialized abSLA protocol integrates into the broader analysis workflow for low-template DNA samples as shown below.
Impact of Contaminants and Strand Breakage on Downstream Applications
The integrity and purity of template DNA are foundational to the success of modern molecular biology and diagnostic applications. Contaminants and DNA strand breakage represent two critical parameters that can severely compromise experimental results, leading to false conclusions, failed assays, and costly repetitions. Contaminants such as proteins, salts, and organic compounds can inhibit enzymatic reactions, while strand breakage directly affects the amplifiability and accurate representation of the genetic material. This application note details the sources of these issues, provides robust protocols for quality assessment, and summarizes their documented impact on key downstream applications to guide researchers in ensuring data reliability.
Understanding the root causes of DNA damage is the first step in mitigating its effects. DNA degradation and contamination occur through several well-characterized mechanisms, often acting in concert.
Primary Degradation Pathways
- Oxidative Damage: Exposure to environmental stressors like heat or UV radiation generates reactive oxygen species (ROS) that modify nucleotide bases, leading to strand breaks and structural changes that interfere with replication and sequencing [8].
- Hydrolytic Damage: Water molecules can break the chemical bonds in the DNA backbone, leading to depurination (the loss of purine bases) and the creation of abasic sites. These sites can stall DNA polymerases during amplification and, if extensive, fragment DNA into unusable pieces [8].
- Enzymatic Breakdown: Endogenous and exogenous nucleases rapidly degrade nucleic acids if not properly inactivated during sample collection, storage, or extraction. Heat treatment, chelating agents (e.g., EDTA), and nuclease inhibitors are essential countermeasures [8].
- Co-extracted Inhibitors: Complex biological samples like dental calculus or bone often contain PCR inhibitors. For instance, EDTA, used to demineralize bone, is a known PCR inhibitor if its concentration is not carefully balanced [8].
- Sample Processing Contaminants: Guanidine salts, phenol, and carbohydrates from lysis buffers can carry over into the final DNA eluate, absorbing strongly at UV wavelengths and inhibiting downstream enzymatic reactions [13].
- Laboratory Introduced Contaminants: Normal handling of laboratory microtubes can cause leaching of light-absorbing chemicals that interfere with spectrophotometric quantification [13].
Quality Control Assessment Methodologies
Rigorous quality control is non-negotiable. The following section outlines standard and advanced protocols for evaluating DNA purity and integrity.
Assessing DNA Purity and Concentration
Protocol: Spectrophotometric Analysis for DNA Purity and Quantification
This protocol uses UV absorbance to assess sample purity and concentration [13].
- Instrument Preparation: Use a spectrophotometer (e.g., Infinite F200 with a Nanoquant plate). Clean and calibrate the instrument according to the manufacturer's instructions.
- Blank Measurement: Load 2 µL of the same elution buffer used for the DNA samples (e.g., low-salt Tris-HCl buffer, not water) into the instrument and set it as the blank.
- Sample Measurement: Load 2 µL of each DNA sample in duplicate. The instrument should also measure absorbance at 340 nm to correct for background scattering from plate contaminants.
- Data Analysis:
- Concentration: Calculate DNA concentration from the A260 reading using the Lambert-Beer law. Ensure readings fall within the reliable range of A260 0.1 to 1.0.
- Purity (260/280 Ratio): A ratio of ~1.8 indicates pure DNA. Ratios significantly lower (~1.6) suggest protein or phenol contamination.
- Purity (260/230 Ratio): A ratio in the 2.0-2.2 range is expected. Lower values indicate contamination by salts, carbohydrates, or guanidine compounds.
Table 1: Interpreting Spectrophotometric DNA Quality Indicators
| Metric | Optimal Value | Sub-Optimal Value | Potential Contaminant |
|---|---|---|---|
| A260 Range | 0.1 - 1.0 | <0.1 or >1.0 | N/A (Measurement unreliable) |
| 260/280 Ratio | ~1.8 | ≤1.6 | Proteins, Phenol |
| 260/230 Ratio | 2.0 - 2.2 | Appreciably lower | Salts, Guanidine HCL, Carbohydrates |
Assessing DNA Integrity
Protocol: Agarose Gel Electrophoresis for DNA Integrity
This protocol evaluates the molecular weight of genomic DNA to determine its level of fragmentation [13].
- Gel Preparation: Prepare a 0.8% agarose gel in an appropriate buffer (e.g., 1x TAE or TBE). Incorporate a fluorescent nucleic acid stain like GelRed.
- Sample and Ladder Loading: Based on spectrophotometric quantification, mix 50 ng of each DNA sample with loading dye. Load a DNA molecular weight marker (e.g., Lambda-pUC Mix Marker 4) for size reference.
- Electrophoresis: Run the gel at a constant voltage (e.g., 5-10 V/cm) until sufficient separation is achieved.
- Visualization and Analysis:
- Visualize the gel under UV light.
- Intact genomic DNA appears as a single, tight high molecular weight (HMW) band (>20 kb).
- Degraded DNA appears as a faint, smeared distribution of fragments.
- For semi-quantitative analysis, perform densitometry to calculate the ratio between the density of the HMW band and the smear.
Fluorometric Assay for Quantification and Integrity Estimation
The Quant-iT PicoGreen dsDNA Assay provides a more sensitive and accurate measurement of double-stranded DNA (dsDNA) concentration that is less affected by common contaminants than spectrophotometry. The assay is also sensitive to DNA fragmentation; a significant discrepancy between PicoGreen and spectrophotometric concentration values suggests compromised DNA integrity [13].
The quality of the starting DNA template has a direct and quantifiable impact on the performance and outcome of downstream applications. The following table synthesizes key findings from recent studies.
Table 2: Documented Impact of DNA Contaminants and Strand Breakage on Downstream Applications
| Application | Specific Technique | Impact of Contaminants | Impact of Strand Breakage/Degradation | Supporting Data |
|---|---|---|---|---|
| Next-Generation Sequencing (NGS) | Ancient Metagenomics (Dental Calculus) | N/S | DNA extraction method choice significantly impacts microbial community recovery and endogenous DNA content [14]. | |
| Next-Generation Sequencing (NGS) | Circulating Tumor DNA (ctDNA) Analysis | N/S | Pilot studies show significant inter-laboratory variability in variant allele frequency (VAF) measurement for degraded ctDNA, dependent on both assay and quality control materials used [15]. | |
| Polymerase Chain Reaction (PCR) | Real-time PCR for Residual DNA Quantification | Non-specific signal detection from contaminants leads to inaccurate DNA concentration measurements [16]. | Fluoroprobe-based qPCR (e.g., TaqMan) is required for specific and sensitive quantification of fragmented host cell DNA in biologics [16]. | |
| Polymerase Chain Reaction (PCR) | General PCR and qPCR | Presence of PCR inhibitors (e.g., carryover EDTA, salts) reduces amplification efficiency, leading to false negatives and inaccurate quantification [8]. | Fragmented DNA provides fewer intact templates, reducing amplification efficiency and yield. Shearing can also lead to non-uniform coverage in target enrichment [8]. | |
| DNA-Based Authentication | DNA Barcoding, PCR, LAMP | N/S | High-temperature processing and shearing cause DNA breakage, a major limitation for authenticating processed herbal materials and botanical supplements [17]. |
Abbreviation: N/S: Not explicitly specified in the sourced context, but impact is well-documented in the broader literature.
The Scientist's Toolkit: Research Reagent Solutions
Selecting the appropriate reagents is critical for navigating challenges associated with contaminants and strand breakage.
Table 3: Essential Research Reagents for Challenging DNA Samples
| Reagent / Kit | Function / Application | Key Feature |
|---|---|---|
| Magnetic Bead-Based Kits (e.g., Chemagic Kits) | DNA extraction and purification from various sample types. | Efficient removal of proteins, salts, and other inhibitors; amenable to automation [13]. |
| Carrier-Based Extraction Solutions | Recovery of trace amounts of DNA (e.g., residual host cell DNA). | Uses a novel DNA carrier to concentrate and recover trace DNA free from contaminating proteins and salts [16]. |
| Probe-Based qPCR Kits (e.g., AccuRes Quantification Kits) | Specific quantification of fragmented DNA in complex backgrounds. | FAM-labeled probes and Hot Start polymerase prevent non-specific amplification; can detect femtogram levels of DNA [16]. |
| Fluorometric Assays (e.g., Quant-iT PicoGreen) | Highly sensitive and specific quantification of dsDNA. | Minimizes contribution from ssDNA and RNA; quantification is affected by fragmentation, serving as an integrity check [13]. |
| Hot-Start DNA Polymerases | PCR amplification from challenging templates. | Prevents non-specific amplification and primer-dimer formation at low temperatures, improving specificity and yield [16]. |
| Dynabeads M-280 Streptavidin | Preparation of single-stranded DNA (ssDNA) templates. | Enables solid-phase purification and strand separation for techniques like pyrosequencing and SNP analysis [18]. |
Visualizing the DNA Quality Assessment Workflow
The following diagram illustrates a logical workflow for the comprehensive assessment of DNA quality, integrating the protocols and metrics described in this document.
The Link Between DNA Preparation and Cell-Free Protein Production Yield
The reproducibility and yield of cell-free protein synthesis (CFPS) are critically dependent on the quality and preparation method of the DNA template. Performance variability remains a common challenge in cell-free protein production, hindering wider adoption for both research and biomanufacturing. While inherent biological stochasticity contributes to this variability, systematic factors including the source, preparation, quantitation, and quality of the DNA template significantly impact protein synthesis outcomes [19]. This application note examines the fundamental relationship between DNA template preparation and protein yield in CFPS, providing researchers with optimized protocols and analytical frameworks to enhance experimental reproducibility.
Cell-free systems offer a promising alternative to traditional cell-based biomanufacturing by eliminating cellular constraints, enabling rapid expression of difficult-to-produce proteins in an open, customizable environment [20]. The configuration of CFPS as a membrane-less solution of expression machinery makes the use of both plasmid DNA and linear expression templates (LETs) viable, each with distinct advantages and limitations [21]. As CFPS applications expand from fundamental research to industrial production, therapeutic manufacturing, and point-of-care diagnostics, standardized DNA preparation methods become increasingly essential for achieving consistent, high-yield protein synthesis [20].
DNA Template Types and Their Impact on CFPS Yield
Plasmid DNA versus Linear Expression Templates
CFPS systems can utilize either plasmid DNA or linear expression templates (LETs) to drive protein synthesis, with each template type offering distinct advantages and limitations that significantly impact protein yield, reaction duration, and appropriate applications [21].
Table 1: Comparison of DNA Template Types in CFPS
| Parameter | Plasmid DNA | Linear Expression Templates (LETs) |
|---|---|---|
| Preparation Time | Days (requires cloning, transformation, and cultivation) | Hours (PCR-generated) [21] |
| Template Stability | High (resistant to nuclease degradation) [21] | Low (susceptible to nuclease degradation) [21] |
| Relative Cost | $$ (moderate) | $ (low) [21] |
| Ideal Application | Large-scale protein production, reactions requiring extended duration | Rapid prototyping, toxic gene expression, high-throughput screening [21] |
| Protein Yield Range | 0.02-1.7 mg/mL [20] | Variable, typically lower than plasmids without stabilization [21] |
| Key Advantage | Template stability enables prolonged expression | Bypasses cloning; enables expression of toxic genes [21] |
LETs consist of a promoter region, gene coding sequence, and transcriptional terminator, and can be quickly produced in vitro via polymerase chain reaction (PCR) from existing plasmid DNA or genomic DNA [21]. This rapid template generation decreases the "primers-to-testable-DNA" time from days to only a few hours, significantly accelerating the prototyping cycle time of multicomponent genetic circuits [21]. Additionally, LETs enable expression of toxic genes that would be difficult to clone into plasmids, as the linear template can be amplified directly from genomic DNA or from a promoterless plasmid [21].
Despite these benefits, plasmids remain the most widely used DNA template in CFPS due to their superior resistance to degradation by nucleases present in crude cellular lysates [21]. The nucleases native to E. coli remain active after lysate purification and readily digest linear double-stranded or single-stranded DNA fragments, causing LETs to have a much shorter half-life than circular plasmids and resulting in lower protein yields [21].
DNA Quality Metrics and Their Impact on Protein Yield
The quantity, quality, and purity of DNA templates directly influence CFPS efficiency. Several key parameters must be controlled to ensure optimal protein production yields:
Functional DNA Concentration: The amount of intact, undegraded DNA template directly correlates with transcription efficiency and subsequent protein yield [19].
Contaminant Presence: Residual salts, solvents, metabolites, or endotoxins from DNA preparation procedures can inhibit transcriptional and translational machinery [19].
DNA Strand Integrity: Breaks in DNA strands or nicks can reduce the number of functional templates available for transcription, particularly problematic for LETs [19].
The following workflow illustrates the critical decision points in DNA template preparation and their impact on final protein yield:
Experimental Protocols for DNA Template Preparation and Analysis
DNA Template Quality Control Protocol
Objective: To ensure DNA template quality and quantity parameters meet optimal thresholds for reproducible cell-free protein synthesis.
Materials:
- Purified DNA template (plasmid or LET)
- Spectrophotometer (Nanodrop or equivalent)
- Fluorometric DNA quantification system (Qubit or equivalent)
- Agarose gel electrophoresis system
- Thermal cycler (for LET amplification)
Procedure:
DNA Quantification:
- Measure absorbance at 260 nm using a spectrophotometer to determine DNA concentration.
- Calculate A260/A280 ratio (ideal range: 1.8-2.0) and A260/A230 ratio (ideal: >2.0) to assess purity.
- Confirm concentration using fluorometric methods for enhanced accuracy.
Structural Integrity Assessment:
- Prepare a 0.8-1.0% agarose gel in 1X TAE or TBE buffer.
- Load 100-200 ng DNA per lane alongside appropriate molecular weight markers.
- Run gel at 5-8 V/cm for 45-60 minutes.
- Visualize under UV light; plasmid DNA should show predominantly supercoiled form, LETs should appear as single discrete bands without smearing.
Functional Verification:
- Perform test cell-free reaction with standardized control template (e.g., GFP-encoding plasmid).
- Compare protein yield to historical laboratory data using identical reaction conditions.
- For LETs, include plasmid control at same molar concentration to establish yield efficiency.
Troubleshooting Notes:
- Low A260/A280 ratio may indicate protein contamination; consider additional purification steps.
- DNA degradation apparent on gel (smearing) necessitates template repurification.
- Acceptable DNA quality should yield >70% of reference protein production in control reactions.
LET Stabilization Methods for Enhanced CFPS Yield
Objective: To implement stabilization techniques that protect linear DNA templates from nuclease degradation in crude lysate CFPS systems, thereby increasing protein yield.
Rationale: Native nucleases present in crude bacterial lysate, particularly exonuclease V (RecBCD complex), rapidly degrade LETs, limiting their utility despite significant advantages in prototyping speed [21].
Table 2: LET Stabilization Approaches and Effectiveness
| Stabilization Method | Mechanism of Action | Yield Improvement | Implementation Complexity |
|---|---|---|---|
| GamS Protein | Inhibits RecBCD nuclease activity by binding DNA ends [21] | 37.6% of plasmid expression level [21] | Medium (requires protein expression/purification) |
| Chi Sites | DNA sequences that alter RecBCD activity [21] | 23% of plasmid expression level [21] | Low (incorporated into primer design) |
| Terminal Modifications | Phosphorothioate linkages protect ends from exonucleases [21] | 36% increase over unmodified LET [21] | Low to Medium (modified synthesis required) |
| Genomic Nuclease Deletion | Extract from ΔrecBCD or ΔendA strains reduces nuclease activity [21] | 3-6x improvement over wild-type extracts [21] | High (requires specialized strains) |
| 3'-UTR Structures | RNA secondary structures protect transcript ends [21] | Up to 265% increase with T7 terminator [21] | Low (incorporated into template design) |
| Commercial PURE System | Recombinant system with minimal nuclease activity [21] | Near-plasmid level expression | High (significant cost increase) |
Materials:
- PCR-purified LET
- GamS protein (purified or commercial source)
- Phosphorothioate-modified primers
- Nuclease-deficient cell extract (if available)
- Standard CFPS reaction components
Procedure:
Template Design with Stabilization Elements:
- Incorporate chi sites (5'-GCTGGTGG-3') near the 5' end of LET during primer design.
- Include strong transcriptional terminators (e.g., T7 terminator) at the 3' end.
- For added protection, design primers with 2-3 phosphorothioate linkages at both 5' and 3' ends.
LET Preparation with Stabilizers:
- Amplify target sequence using standard PCR protocols with appropriate modifications.
- Purify PCR product using silica-column based purification or agarose gel extraction.
- For GamS stabilization: pre-incubate LET with GamS protein (10:1 molar ratio of GamS:DNA ends) for 10 minutes at room temperature before adding to CFPS reaction.
CFPS Reaction with Stabilized LET:
- Prepare standard CFPS master mix according to established laboratory protocols.
- Add stabilized LET template at optimal concentration (typically 5-20 nM).
- Incubate reaction at appropriate temperature (30-37°C) for protein synthesis.
- Monitor protein yield over time compared to unstabilized LET controls.
The following diagram illustrates the molecular mechanisms of different LET stabilization approaches:
The Scientist's Toolkit: Research Reagent Solutions
Table 3: Essential Reagents for DNA Preparation and CFPS
| Reagent/Material | Function | Example Products | Application Notes |
|---|---|---|---|
| Commercial CFPS Kits | Provides optimized components for protein synthesis | PURExpress (NEB), PUREfrex 2.0, Magic PURE | Minimal nuclease activity; ideal for LET expression [21] |
| Nuclease-Deficient Strains | Source of cell extract with reduced DNA degradation | ΔrecBCD, ΔendA, ΔrecD mutant E. coli strains | 3-6x improvement in LET stability [21] |
| GamS Protein | RecBCD inhibitor that stabilizes LETs | Purified recombinant GamS | Enables LET expression at 37.6% of plasmid levels [21] |
| Phosphorothioate-Modified Oligos | Primer with nuclease-resistant linkages for LET generation | Custom synthesis from IDT, Sigma | Two terminal modifications increase yield by 36% [21] |
| Magnetic Bead Purification | DNA cleanup removing enzymes, salts, and contaminants | AMPure XP, Mag-Bind | Critical for removing PCR inhibitors |
| Fluorometric DNA Quantitation | Accurate DNA concentration measurement | Qubit dsDNA assays | More accurate than spectrophotometry for CFPS |
| Lyophilization Reagents | Stabilizers for room-temperature CFPS storage | Trehalose, sucrose, PEG | Enables portable, cold-chain-independent applications [20] |
DNA template preparation represents a fundamental determinant of success in cell-free protein synthesis systems. Both template quality and stabilization strategy directly impact protein yield, reproducibility, and the applicability of CFPS across research and biomanufacturing domains. The protocols and analyses presented herein provide a framework for standardized DNA template preparation that accommodates both plasmid and linear expression systems while addressing the unique challenges associated with each template type. As CFPS technologies continue to evolve toward industrial implementation and point-of-care applications, robust DNA preparation methodologies will remain essential for maximizing protein yield and ensuring experimental reproducibility.
Optimized DNA Preparation Protocols: From Extraction to Quantification
Automated DNA Extraction and Purification Methods for Consistency
In molecular biology research, the consistency and quality of template DNA preparation are foundational for the reliability of downstream applications, from routine genotyping to advanced sequencing. Automated DNA extraction and purification methods have emerged as critical tools for overcoming the variability and inefficiencies inherent in manual protocols. By standardizing the complex procedures of cell lysis, binding, washing, and elution, automation minimizes human error, reduces cross-contamination risks, and enhances throughput without compromising yield or integrity. This application note details standardized protocols and performance data for automated methods across diverse, challenging sample types, providing a framework for integrating these systems into robust DNA preparation workflows. The adoption of these methods is essential for any high-quality research and development pipeline, including drug discovery and diagnostic development, where precision and reproducibility are paramount.
Automated Methodologies and Protocols
Nondestructive DNA Extraction from Tooth Root Surfaces
Background: Forensic and ancient DNA analysis often requires the preservation of physical evidence. A nondestructive automated method allows for successful genetic analysis while maintaining the tooth's integrity for ethical or archival purposes [22].
Protocol Workflow:
- Sample Cleaning: Chemically clean the tooth surface, followed by UV irradiation to eliminate surface contaminants.
- Demineralization: Submerge the entire tooth in 15-20 mL of 0.5 M EDTA (pH 8.0) and incubate overnight at room temperature with gentle agitation. EDTA chelates calcium ions, softening the mineralized cementum layer on the root surface without physical destruction [22].
- Lysis: Transfer the tooth to a tube containing a commercial lysis buffer (e.g., from a forensic DNA extraction kit) and proteinase K. Incubate at 56°C for 2-3 hours to digest the demineralized tissue and release DNA.
- Automated Purification: Transfer the lysate to a deep-well plate for automated DNA purification on a robotic platform (e.g., a liquid handler configured for magnetic bead-based kits). The workflow includes:
- Binding: DNA binds to silica-coated magnetic beads in the presence of chaotropic salts.
- Washing: Beads are washed twice with a commercial wash buffer to remove inhibitors like EDTA and proteins.
- Elution: DNA is eluted in a low-salt buffer (e.g., TE buffer or nuclease-free water) [22].
- Quality Control: Assess DNA quantity and quality via real-time PCR and STR typing to evaluate the success of the extraction.
Robotic CTAB (RoboCTAB) Extraction for Plant Tissues
Background: The cetyltrimethylammonium bromide (CTAB) method is effective for plant tissues but is labor-intensive. This protocol describes its adaptation for semi-automated, high-throughput genotyping [23].
Protocol Workflow:
- Tissue Preparation and Lysis:
- Harvest 50-100 mg of young root or leaf tissue and place it in a deep-well plate.
- Add 500 µL of CTAB extraction buffer (2% CTAB, 100 mM Tris-HCl pH 8.0, 20 mM EDTA, 1.4 M NaCl) and a stainless-steel bead to each well.
- Seal the plate and homogenize using a bead mill homogenizer (e.g., Bead Ruptor Elite) for 2 x 45 seconds.
- Incubate the plate at 65°C for 30-45 minutes, with occasional mixing.
- Automated Phase Separation and Purification: Use a robotic liquid handler (e.g., Opentrons OT-2) for the following steps:
- Deproteinization: Add 500 µL of chloroform:isoamyl alcohol (24:1) to the lysate. The robot mixes the plate thoroughly to form an emulsion.
- Phase Separation: The plate is centrifuged (manual step), and the robot transfers 400 µL of the upper aqueous phase to a new deep-well plate.
- Precipitation: Add 300 µL of isopropanol to the aqueous phase. Mix gently and incubate at -20°C for 30 minutes to precipitate DNA.
- Washing: The robot pelletes the DNA by centrifugation (manual step), then aspirates the supernatant. The pellet is washed with 500 µL of 70% ethanol.
- Elution: Air-dry the pellet and resuspend in 100 µL of TE buffer or nuclease-free water [23].
- Automation Note: The protocol is designed to process up to four 96-well plates (384 samples) simultaneously.
Magnetic Bead-Based High-Yield Extraction (SHIFT-SP)
Background: The SHIFT-SP method optimizes magnetic silica bead-based extraction for speed and maximum yield, making it ideal for low-biomass samples in clinical diagnostics [24].
Protocol Workflow:
- Sample Lysis: Mix 200 µL of sample (e.g., whole blood, bacterial culture) with 300 µL of Lysis Binding Buffer (LBB) containing guanidinium thiocyanate and Triton X-100, at an optimized pH of 4.1. Incubate at 62°C for 2 minutes to lyse cells and denature proteins [24].
- Rapid "Tip-Based" Binding:
- Add 30-50 µL of magnetic silica beads to the lysate.
- Using a automated liquid handler, perform "tip-based" binding by repeatedly aspirating and dispensing the mixture for 1-2 minutes. This method ensures rapid and efficient exposure of DNA to beads, achieving over 95% binding efficiency within 2 minutes [24].
- Washing: The magnetic beads are captured, and the supernatant is discarded. The bead-bound DNA is washed twice with 500 µL of a wash buffer (e.g., ethanol-based).
- High-Efficiency Elution:
- Elute the DNA by adding 50 µL of a low-salt elution buffer (e.g., 10 mM Tris-HCl, pH 9.0).
- Incubate at 62°C for 2 minutes with active "tip-based" mixing to achieve high-concentration eluates [24].
- Throughput: The entire process is completed in 6-7 minutes and is fully automation-compatible for 96-well formats.
Performance Data and Comparative Analysis
The following tables summarize quantitative performance data for the featured automated methods, providing a basis for protocol selection.
Table 1: Performance Metrics of Automated DNA Extraction Methods
| Method / Sample Type | Average DNA Yield | Processing Time | Downstream Success Rate | Key Advantage |
|---|---|---|---|---|
| Nondestructive (Tooth) [22] | Not specified | Overnight demineralization + ~4-5 hrs automated processing | 74% (STR profiles from archaeological canines) | Specimen preservation; low contamination risk |
| RoboCTAB (Soybean Leaf) [23] | 1.87 µg (per sample) | Not specified, but high-throughput | Suitable for GBS library sequencing (1.18M reads/sample) | High yield; cost-effective for large-scale plant genotyping |
| SHIFT-SP (Model DNA) [24] | >95% recovery efficiency | 6-7 minutes | Compatible with qPCR and sequencing | Maximum speed and yield; automation-friendly |
| Magnetic Bead (PAXgene Blood) [25] | 4.27 - 4.82 µg (varies by platform) | ~40 minutes (for comparable method) | Effective for clinical studies | Reliable for stabilized blood samples |
Table 2: Comparison of Automated Platforms for Blood Samples Collected in PAXgene Tubes [25]
| Platform | Average DNA Yield (µg) | Purity (A260/A280) | Remarks |
|---|---|---|---|
| QIAsymphony SP | 4.27 ± 2.19 | Not specified | Significantly higher yield than KingFisher Apex |
| Maxwell RSC | 4.82 ± 2.96 | Not specified | Highest yield among tested platforms |
| KingFisher Apex | 1.09 ± 0.61 | Not specified | Lower yield for this specific sample type |
Essential Research Reagent Solutions
Successful implementation of automated DNA extraction relies on key reagents and tools. The following table details essential components and their functions.
Table 3: Key Research Reagents and Materials for Automated DNA Extraction
| Reagent / Material | Function | Application Notes |
|---|---|---|
| Magnetic Silica Beads | Solid-phase for DNA binding and purification | Enable automation in platforms like KingFisher and QIAsymphony [25] [24]. |
| CTAB Buffer | Lysis of plant cells; precipitation of polysaccharides & polyphenols | Essential for removing plant-specific PCR inhibitors [23]. |
| EDTA (Ethylenediaminetetraacetic acid) | Demineralizing agent; nuclease inhibitor | Chelates Mg²⁺; critical for bone/tooth samples and preventing enzymatic degradation [22] [8]. |
| Guanidinium Thiocyanate | Chaotropic salt; powerful protein denaturant and nuclease inactivator | Used in lysis buffers (e.g., SHIFT-SP) for efficient DNA release and stability [24]. |
| Proteinase K | Broad-spectrum serine protease | Digests histones and denatures proteins in tissue samples, facilitating DNA release [22]. |
| Liquid Handling Robot | Automated pipetting system | Executes precise liquid handling (e.g., Opentrons OT-2, Opentrons Flex) for high-throughput workflows [23]. |
| Bead Mill Homogenizer | Mechanical cell disruption | Efficiently lyses tough tissues (plant, bone) and bacterial cells using bead beating [8] [23]. |
Workflow Visualization
The following diagrams illustrate the logical workflows and decision pathways for the automated DNA extraction protocols discussed.
The reliability of any experiment involving template DNA is fundamentally dependent on the quality and integrity of the starting material. Researchers and drug development professionals frequently encounter challenging sample types—such as bone, formalin-fixed paraffin-embedded (FFPE) tissues, and low-input materials—that present unique obstacles for nucleic acid extraction and downstream analysis. These challenges, if not strategically managed, can introduce significant variability and compromise the reproducibility of cell-free protein production, sequencing, and other molecular applications [26] [19]. This document outlines evidence-based protocols and quality control strategies specifically optimized for these difficult samples, providing a framework to enhance experimental consistency and data integrity within the broader context of template DNA preparation.
Bone Samples: Overcoming Mineralization and Degradation
Key Challenges and Strategic Approach
Bone tissue is notoriously difficult to process due to its hard, mineralized matrix that is resistant to lysis. Effective DNA recovery requires a combination approach that addresses both the inorganic and organic components of the sample. The primary challenges include demineralization, efficient lysis of osteocytes, and mitigating the effects of inherent degradation and inhibitors like EDTA that are necessary for the process [8].
Optimized Protocol for Bone DNA Extraction
The following protocol combines chemical and mechanical methods to maximize DNA yield and quality from bone samples.
Step 1: Demineralization and Initial Processing
- Crushing: Use a sterile mortar and pestle or a dedicated mechanical crusher to pulverize the bone sample into a fine powder under liquid nitrogen. This step is critical for increasing the surface area for subsequent chemical reactions.
- Chemical Demineralization: Incubate the bone powder in a buffer containing 0.5 M EDTA (pH 8.0), Proteinase K (20 mg/mL), and a detergent (e.g., SDS or N-Lauryl Sarcosyl) for 24–72 hours at 56°C with constant agitation. The EDTA chelates calcium ions, softening the bone matrix, while Proteinase K digests proteins. Critical Consideration: Precisely balance the EDTA concentration, as it is a known PCR inhibitor; excessive amounts can compromise downstream applications [8].
Step 2: Mechanical Homogenization
- Transfer the demineralized slurry to a tube containing specialized beads (e.g., ceramic or stainless steel).
- Homogenize using a high-throughput bead mill homogenizer, such as the Bead Ruptor Elite, with optimized parameters (e.g., speed: 4–6 m/s, cycle duration: 30–60 seconds, 2–3 cycles). Perform this step with cooling (4°C or using a cryo unit) to minimize heat-induced DNA damage [8].
- Rationale: Mechanical homogenization provides the physical force needed to complete the lysis of cells that chemical methods alone cannot reach, creating a "combo power punch" [8].
Step 3: DNA Purification and Assessment
- Purify the lysate using silica-membrane columns or magnetic beads designed for complex samples. Automated systems (e.g., Promega Maxwell RSC) can enhance reproducibility [27] [28].
- Elute the DNA in a low-EDTA TE buffer or nuclease-free water to avoid carry-over inhibition.
- Proceed to Quality Control (Section 4).
FFPE Samples: Reversing Cross-linking and Fragmentation
Key Challenges and Strategic Approach
DNA from FFPE samples is highly degraded and chemically modified due to formalin-induced cross-linking and fragmentation during fixation and storage. The strategic goals are to reverse cross-links, repair DNA damage, and employ analysis methods compatible with short fragments [27] [29].
Optimized Protocol for FFPE DNA Recovery
This protocol is adapted from studies utilizing the Maxwell RSC Xcelerate DNA FFPE Kit, which has demonstrated efficacy in recovering DNA from archival blocks [27].
Step 1: Deparaffinization and Sectioning
- Cut 2–3 sections of 10–20 µm thickness from the FFPE block. Use a clean microtome blade for each block to prevent cross-contamination.
- Transfer sections to a microcentrifuge tube and add 1 mL of xylene or a proprietary deparaffinization solution. Vortex vigorously and incubate at room temperature for 10 minutes.
- Centrifuge at full speed for 5 minutes. Carefully remove and discard the supernatant.
- Wash the pellet by adding 1 mL of 70–100% ethanol, vortexing, and centrifuging for 5 minutes. Remove the supernatant and air-dry the pellet briefly (5–10 minutes) [27] [29].
Step 2: Lysis and Cross-link Reversal
- Add a lysis buffer containing Proteinase K to the deparaffinized pellet. Incubate at 56°C for 2–4 hours, or overnight for older samples, with agitation. For more efficient reversal of cross-links, the incubation temperature can be increased to 80–90°C for 20–30 minutes after the initial Proteinase K digestion [27].
- Critical Consideration: The use of buffered formalin (pH ~7) during initial tissue fixation is a major determinant of success. Tissues fixed in unbuffered formalin yield DNA fragments of only 100–300 bp, whereas buffered formalin can preserve fragments up to ~1 kb [27].
Step 3: DNA Purification and Assessment
- Purify the lysate using an automated system like the Maxwell RSC or a manual column-based kit designed for FFPE samples. These systems often include reagents that help remove formalin-induced contaminants.
- Elute in a recommended volume of TE buffer or nuclease-free water.
- Proceed to Quality Control (Section 4). Given the fragmented nature of the DNA, methods like short amplicon STR (miniSTR) or next-generation sequencing (NGS) with small DNA input protocols are recommended for downstream analysis [27].
Universal and Sample-Specific Quality Control
Rigorous QC is non-negotiable for challenging samples. The following metrics and methods are essential for evaluating sample viability before proceeding to costly downstream applications [1] [30] [31].
Quantitative and Qualitative QC Metrics
Table 1: Essential Quality Control Metrics for DNA from Challenging Samples
| QC Metric | Method/Instrument | Optimal Values | Interpretation of Suboptimal Values |
|---|---|---|---|
| DNA Mass/Quantity | Fluorometry (e.g., Qubit with dsDNA BR Assay) | Varies by sample | Inaccurate mass leads to failed library preps. Preferable over spectrophotometry for specificity [1] [31]. |
| Purity (A260/A280) | Spectrophotometry (e.g., NanoDrop) | ~1.8 [1] [30] | Ratio <1.8 indicates protein/phenol contamination; >1.8 suggests RNA contamination [1]. |
| Purity (A260/A230) | Spectrophotometry (e.g., NanoDrop) | 2.0–2.2 [1] | Ratio <2.0 indicates contamination (e.g., salts, EDTA, organics) [1]. |
| Size/Integrity | Gel Electrophoresis / Bioanalyzer | Sharp, high molecular weight band [1] [31] | Smearing indicates degradation. For FFPE RNA, use DV200 (%>200nt) or DV100 (%>100nt) [29]. |
| Degradation/DNA Quality | qPCR / Fragment Analyzer | Depends on assay | High degradation index or poor amplification efficiency indicates fragmented DNA [27]. |
QC Workflow and Decision Tree
The following workflow provides a logical pathway for assessing DNA quality and making informed decisions about downstream applications.
The Scientist's Toolkit: Essential Research Reagents and Materials
Successful processing of challenging samples relies on a carefully selected set of reagents and instruments.
Table 2: Essential Research Reagent Solutions for Challenging Samples
| Item | Function | Example Use-Case |
|---|---|---|
| EDTA (0.5 M, pH 8.0) | Chelating agent that demineralizes bone by binding calcium ions. | Bone demineralization during initial processing [8]. |
| Proteinase K | Broad-spectrum serine protease that digests proteins and inactivates nucleases. | Lysis of bone powder and reversal of protein-DNA cross-links in FFPE samples [8] [27]. |
| Bead Mill Homogenizer | Instrument using rapid shaking with beads to mechanically disrupt tough tissues and cells. | Efficient lysis of bone, bacterial, and other fibrous samples (e.g., Bead Ruptor Elite) [8]. |
| Automated Nucleic Acid Purification System | Standardized, high-throughput systems for DNA/RNA extraction using magnetic beads or columns. | Reproducible purification from FFPE (e.g., Maxwell RSC) and other samples, reducing human error [27] [28]. |
| Specialized Beads (Ceramic, SS) | Beads of varying composition and size that provide optimal physical lysis for different sample matrices. | Homogenization of tough samples; ceramic for general use, stainless steel for especially hard materials [8]. |
| Silica-Membrane Columns/Magnetic Beads | Solid-phase matrices that bind DNA in the presence of high-salt buffers, allowing impurities to be washed away. | Final purification and concentration of DNA after lysis and homogenization [28]. |
The successful preparation of template DNA from challenging samples like bone, FFPE, and low-input materials is a cornerstone of reproducible research in genetics and drug development. By adopting the sample-specific extraction protocols, adhering to rigorous, multi-faceted quality control standards, and utilizing the appropriate toolkit of reagents and instruments outlined in this document, researchers can significantly reduce experimental variability. These strategies ensure that even the most difficult and irreplaceable samples can be transformed into reliable genetic templates, thereby safeguarding the integrity of downstream analyses and accelerating scientific discovery.
Accurate deoxyribonucleic acid (DNA) quantification is a critical prerequisite for success in molecular biology applications, including next-generation sequencing (NGS), polymerase chain reaction (PCR), and clinical diagnostics [32] [33]. The reliability of these downstream processes is fundamentally dependent on the precise initial measurement of DNA concentration and quality. Two principal methodologies dominate this field: spectrophotometric analysis and fluorometric analysis. The choice between these techniques significantly impacts the accuracy of subsequent experimental outcomes. This application note provides a detailed comparison of these DNA quantification methods, framed within the context of template DNA preparation and quality control. We present structured quantitative data, standardized protocols, and analytical workflows to guide researchers, scientists, and drug development professionals in selecting the optimal quantification strategy for their specific research needs.
Technical Comparison of Quantification Methods
Fundamental Principles
Spectrophotometric Analysis (e.g., using a NanoDrop instrument) operates on the principle of ultraviolet (UV) light absorption by nucleic acids at 260 nm. The concentration is calculated using the Beer-Lambert law, where one A260 unit corresponds to approximately 50 µg/mL for double-stranded DNA (dsDNA) [34]. This method also assesses sample purity by calculating the ratio of absorbance at 260 nm to that at 280 nm (for protein contamination) and 230 nm (for solvent or salt contamination). Pure DNA typically exhibits an A260/A280 ratio between 1.8 and 2.0 [34] [35].
Fluorometric Analysis (e.g., using Qubit systems) employs fluorescent dyes that selectively bind to specific target molecules—such as dsDNA, single-stranded DNA (ssDNA), or RNA—and emit fluorescence only upon binding [33]. The Qubit dsDNA High Sensitivity (HS) Assay, for instance, uses a dye highly selective for dsDNA, even in the presence of an equal mass of RNA, providing specific quantification of the target molecule [33]. The fluorescent signal is measured and interpolated onto a standard curve to determine concentration.
Performance Data and Comparative Analysis
The following table summarizes key performance characteristics and comparative data derived from recent studies:
Table 1: Comparative Performance of DNA Quantification Methods
| Characteristic | Spectrophotometry (NanoDrop) | Fluorometry (Qubit, AccuGreen, AccuClear) |
|---|---|---|
| Fundamental Principle | UV absorbance at 260 nm [34] | Fluorescence emission upon dye binding to target [33] |
| dsDNA Specificity | Low - measures total nucleic acids (dsDNA, ssDNA, RNA) [32] | High - dyes are specific for dsDNA, even with RNA present [33] |
| Sample Purity Assessment | Yes (via A260/A280 and A260/230 ratios) [32] [35] | No [32] |
| Typical Working Range | ~2 ng/µL to high concentrations [35] | Varies by kit; e.g., Qubit dsDNA HS: 0.2–100 ng [33]; AccuGreen: 0.1–10 ng/µL [32] |
| Accuracy with Pure DNA | High correlation (R ≥ 0.995) with standards [35] | High accuracy and precision, even at low concentrations [33] |
| Measured Concentration Trend | Often overestimates vs. fluorometry, especially with contaminants or in fish DNA [32] [36] | Typically lower, more reflective of amplifiable dsDNA [32] [36] |
| Influence of Analyst | No significant variance found between analysts [32] | No significant variance found between analysts [32] |
Independent studies consistently demonstrate a significant disparity in concentration values obtained by these two methods. Research comparing DNA from fine needle aspiration cytology (FNAC) smears, formalin-fixed paraffin-embedded (FFPE) tissues, and whole blood found that spectrophotometry consistently reported dramatically higher concentrations than fluorometry [36]. For example, in FFPE samples, the mean DNA yield measured by spectrophotometry was 69.9 ng/µL compared to just 1.9 ng/µL with fluorometry [36]. This overestination by UV absorbance is largely attributed to its inability to distinguish between dsDNA, ssDNA, RNA, and free nucleotides, all of which absorb at 260 nm [33] [37].
Analysis of Degraded and Contaminated DNA
The performance of each method is further differentiated when analyzing challenging samples, such as degraded DNA or samples containing contaminants.
- Degraded DNA: For DNA degraded by sonication or heat, fluorometric quantification has been shown to yield more accurate results in subsequent quantitative PCR (qPCR) analyses of genetically modified (GM) content [38] [37]. This is likely because the fluorescent dye quantifies the actual amplifiable double-stranded DNA fragments, leading to the addition of more viable template copies into the qPCR reaction [37].
- Contaminated DNA: Spectrophotometry excels at detecting impurities like proteins (low A260/A280 ratio) or phenol (absorbance at 270-275 nm) [34] [35]. However, the presence of such contaminants can cause spectrophotometry to overestimate the functional DNA concentration. Fluorometric assays are less affected by common contaminants such as salts, free nucleotides, solvents, detergents, and proteins, providing a more reliable measure of the actual dsDNA content available for enzymatic reactions [33].
Experimental Protocols
Standardized Fluorometric Quantification Protocol (e.g., Qubit dsDNA HS Assay)
This protocol is adapted for use with the Qubit Fluorometer and the Qubit dsDNA HS Assay kit [33] [39].
Research Reagent Solutions: Table 2: Essential Reagents and Materials for Fluorometric Quantification
| Item | Function |
|---|---|
| Qubit Fluorometer (4 or Flex) | Measures fluorescent signal from sample-dye complex [33]. |
| Qubit dsDNA HS Assay Kit | Provides the target-specific fluorescent dye and buffer for the working solution [32] [33]. |
| Qubit Assay Tubes | Specialized tubes designed for optimal reading in the fluorometer. |
| DNA Standards (1 & 2) | Provided with the kit; used to generate the standard curve for accurate sample concentration interpolation [33]. |
Step-by-Step Workflow:
- Preparation of Working Solution: Use the fluorometer's onboard reagent calculator. For a single sample, dilute the concentrate dye 1:200 in the provided Qubit buffer. For example, to prepare enough for one sample and two standards, mix 199 µL of buffer with 1 µL of dye. Prepare a master mix if multiple samples are being quantified [33].
- Preparation of Standards:
- Pipet 190 µL of working solution into each of two Qubit assay tubes.
- Add 10 µL of Standard #1 to the first tube and 10 µL of Standard #2 to the second tube. Mix thoroughly by vortexing for 2-3 seconds.
- Preparation of Samples:
- Pipet 190-198 µL of working solution into assay tubes (the volume depends on the sample volume used).
- Add 1-10 µL of each DNA sample to the respective tube. Mix thoroughly by vortexing. A sample volume of 2 µL is typical for the dsDNA HS assay.
- Incubation: Incubate all tubes at room temperature for 2 minutes to allow for dye binding.
- Measurement:
- On the Qubit fluorometer, select the appropriate assay (e.g., "dsDNA HS").
- Follow the on-screen instructions to read the two standards first to establish the calibration curve.
- Read the samples. The instrument will display the sample concentration directly.
- Data Export: Results can be exported via WiFi to a cloud account or transferred via USB as a CSV file [33].
Standardized Spectrophotometric Quantification Protocol (e.g., NanoDrop)
This protocol is adapted for microvolume measurement using instruments like the NanoDrop 2000 [35].
Step-by-Step Workflow:
- Instrument Initialization: Clean the upper and lower measurement pedests with a lint-free lab wipe. Apply 1-2 µL of the blank solution (typically the same buffer used to elute or dilute the DNA, e.g., TE buffer or nuclease-free water) to the measurement surface. Perform a blank measurement.
- Sample Measurement:
- Wipe off the blank.
- Apply 1-2 µL of the DNA sample to the measurement surface.
- Lower the arm and initiate the measurement from the software.
- Record the concentration (in ng/µL) and the purity ratios (A260/A280 and A260/A230).
- Post-Measurement Cleaning: Wipe the sample off the pedests and clean with a damp lab wipe. A second blank measurement can be performed to ensure no sample carryover.
Validation Notes: A validated NanoDrop method should demonstrate a linear correlation coefficient of R ≥ 0.9950, precision with a coefficient of variation ≤ 2%, and recovery percentages within acceptable limits (e.g., 100% ± 5%) [35].
Integrated Workflow for DNA Quality Control
Based on the comparative data, an integrated workflow that leverages the strengths of both techniques is recommended for comprehensive template DNA preparation, especially for critical applications like NGS.
Diagram 1: DNA QC Workflow
This workflow ensures that researchers obtain both purity information (from spectrophotometry) and an accurate, specific concentration of amplifiable dsDNA (from fluorometry), providing a complete quality control profile before proceeding to costly downstream applications [32] [33].
Both spectrophotometric and fluorometric analyses provide critical, yet distinct, roles in the ecosystem of DNA quantification and quality control. Spectrophotometry offers a rapid assessment of nucleic acid concentration and sample purity, serving as an effective first-pass quality check. In contrast, fluorometry provides superior sensitivity, specificity, and accuracy for determining the concentration of functional double-stranded DNA, which is paramount for the success of sensitive downstream applications like qPCR and NGS. For robust template DNA preparation, a combination of both methods—using spectrophotometry for purity screening and fluorometry for precise dsDNA quantification—is the recommended strategy to ensure data integrity and optimize resource utilization in research and drug development.
The integrity of downstream molecular analyses, from quantitative PCR (qPCR) to long-read sequencing, is fundamentally dependent on the initial steps of sample preservation and nucleic acid extraction. The choice between mechanical and chemical lysis methods presents a critical trade-off between DNA yield and quality, requiring careful optimization to match specific sample types and analytical goals. This application note provides a structured framework for selecting and optimizing lysis protocols, supported by recent comparative studies and quantitative data, to guide researchers in preparing high-quality template DNA.
Theoretical Foundations: Lysis Mechanisms and DNA Degradation Pathways
Effective cell lysis requires disrupting cellular envelopes to release nucleic acids. Mechanical lysis methods, such as bead beating, employ physical force to shear cells open. In contrast, chemical lysis uses enzymes and detergents to dissolve membrane lipids and degrade proteins. A key challenge is that the very processes that release DNA can also activate its degradation through several pathways:
- Enzymatic Breakdown: Endogenous nucleases (DNases) require divalent cations like Mg²⁺ as cofactors. Their activity can be mitigated by chelating agents such as Ethylenediaminetetraacetic acid (EDTA), which sequesters these metal ions, thereby inactivating the enzymes [40] [8].
- Oxidative Damage: Exposure to reactive oxygen species (ROS) can cause base modifications and strand breaks.
- Hydrolytic Damage: Water molecules can break the phosphodiester bonds in the DNA backbone, particularly at low pH or high temperatures.
- Shear Stress: Overly aggressive mechanical homogenization can fragment DNA, compromising its usefulness for long-read sequencing applications [8] [41].
The optimal lysis strategy effectively releases intracellular DNA while simultaneously deploying protective measures against these degradation pathways.
Comparative Performance of Lysis Methods
The performance of lysis methods varies significantly across sample types. The following tables summarize key quantitative findings from recent studies.
Table 1: Comparison of DNA Extraction Kit Performance for Subgingival Biofilm Samples (Single Paper Point)
| Kit Name | Manufacturer | Primary Lysis Method | Total dsDNA Yield (Healthy Sites) | Total dsDNA Yield (Periodontitis Sites) | Bacterial DNA Yield (qPCR) | Approx. Cost per Sample (€) | Processing Time (min) |
|---|---|---|---|---|---|---|---|
| DNeasy Blood & Tissue | QIAGEN | Enzymatic & Chemical | ++++ (Highest) | ++++ (Highest) | ++++ (Highest) | 4.48 | ~150 |
| NucleoSpin Tissue Mini | MACHEREY‑NAGEL | Enzymatic & Chemical | +++ | +++ | +++ | 3.48 | ~90 |
| ZymoBIOMICS DNA Miniprep | ZYMO RESEARCH | Mechanical (Bead Beating) & Chemical | ++ | ++ | ++ | 6.51 | ~120 |
Note: Yield comparisons are relative within the study. The DNeasy Kit used a pre-wash step with glass beads, adding a mechanical element [42].
Table 2: Impact of Mechanical Lysis Intensity on DNA from Soil Samples
| Homogenization Parameter | Setting 1 (Low Intensity) | Setting 2 (Medium Intensity) | Setting 3 (High Intensity) | Impact on DNA |
|---|---|---|---|---|
| Speed & Time (Example) | 4 m/s for 10 s | 6 m/s for 30 s | 9 m/s for 60 s | - |
| Mean Fragment Length | 9,324 bp | 4,406 bp | 3,418 bp | Longer fragments with low intensity |
| DNA Yield | ~2.5 µg (Sufficient for library prep) | ~5 µg | ~10 µg | Higher yield with high intensity |
| Sequencing Read N50 | Higher | Medium | Lower | Better for long-read sequencing |
| Microbial Community Bias | Minimal change observed across intensities | Minimal change observed across intensities | Minimal change observed across intensities | Community representation preserved |
Data adapted from Scientific Reports (2024), which demonstrated that low-energy input improves DNA integrity for long-read sequencing without sacrificing community composition accuracy [41].
Table 3: Comparison of Bacterial Separation Techniques from Whole Blood
| Separation Method | Principle | Bacterial Recovery (16S Ct) | Host DNA Depletion | Turnaround Time | Reproducibility |
|---|---|---|---|---|---|
| Centrifugation | Differential sedimentation | Lowest Ct (Highest) | Most Efficient | Fast (≈30 min) | Highest |
| Chemical (Polaris) | Alkaline surfactant lyses host cells | Intermediate | Intermediate | Intermediate (≈20 min) | Intermediate |
| Enzymatic (MolYsis) | Chaotropic buffer + DNase | Intermediate | Least Efficient | Slowest (≈90 min) | Intermediate |
| Standard (Qiagen kit) | No specific separation | N/A | N/A | N/A | N/A |
*Data from a 2025 study on bloodstream infections; centrifugation was identified as the most effective and robust method for enriching bacterial DNA from blood [43]._
Detailed Experimental Protocols
Protocol: Mechanical Lysis Optimization for Soil DNA
This protocol is optimized for extracting high-molecular-weight DNA from soil samples for long-read sequencing [41].
Workflow Overview:
Key Reagents and Equipment:
- Lysis Buffer: Typically containing SDS and other surfactants.
- Garnet Beads (0.7 mm): For efficient mechanical disruption of tough microbial cell walls.
- Benchtop Homogenizer (e.g., FastPrep-24): Must allow precise control of speed and time.
- Microcentrifuge
Step-by-Step Procedure:
- Sample Preparation: Weigh 0.25 g of soil and transfer it to a tube containing garnet beads and the provided lysis buffer.
- Mechanical Homogenization: Secure the tube in the homogenizer and process at 4 meters/second for 10 seconds.
- Incubation: Incubate the lysate at a defined temperature (e.g., 65°C) for 5-10 minutes to complete the lysis.
- Separation: Centrifuge the tube at >10,000 × g for 1-2 minutes to pellet soil particles and beads.
- DNA Recovery: Transfer the supernatant to a new tube for subsequent DNA purification using a silica-column-based kit.
- Elution: Elute DNA in a low-EDTA TE buffer or nuclease-free water.
Quality Control: Assess DNA yield and fragment size distribution using a fluorometer and fragment analyzer.
Protocol: Chemical Lysis with EDTA-Based Preservation for Tissues
This protocol leverages the metal-chelating properties of EDTA to preserve DNA integrity during thawing and lysis of tissue samples [40] [44].
Workflow Overview:
Key Reagents and Equipment:
- EDTA Solution (100 mM, pH 8.0): Prevents DNA degradation by chelating metal ions required by DNases.
- Proteinase K: Digests histones and other DNA-binding proteins.
- SDS (Sodium Dodecyl Sulfate): Ionic detergent that dissolves lipid membranes and denatures proteins.
- Water Bath or Heat Block
Step-by-Step Procedure:
- Preservation: For optimal long-term storage, flash-freeze tissue samples in liquid nitrogen and store at -80°C.
- Thawing for DNA Extraction: Thaw the frozen tissue sample directly in a tube containing an EDTA-based solution (e.g., 100 mM EDTA, pH 8.0). This critical step inactivates nucleases during the thawing process.
- Chemical Lysis: Add Proteinase K (to a final concentration of 100 µg/mL) and SDS (to 1-2% w/v). Incubate at 55-65°C with agitation until the tissue is completely dissolved (1-3 hours).
- Enzyme Inactivation: Heat the lysate to 70°C for 10-15 minutes to inactivate Proteinase K.
- DNA Purification: Purify the DNA from the lysate using standard phenol-chloroform extraction and ethanol precipitation, or a commercial silica-membrane kit.
- Storage: Resuspend the purified DNA in TE buffer or nuclease-free water. For stable, long-term storage at room temperature, consider anhydrobiosis technologies [45].
The Scientist's Toolkit: Essential Research Reagents & Materials
Table 4: Key Reagents and Kits for Sample Lysis and DNA Preservation
| Item Name | Type/Composition | Primary Function | Application Notes |
|---|---|---|---|
| EDTA (Ethylenediaminetetraacetic acid) | Chemical Chelator | Inactivates metal-dependent DNases by chelating Mg²⁺ and Ca²⁺ ions. | Core component of DESS and TE buffers; effective for room-temperature preservation of tissues [40] [44]. |
| DESS Solution | Chemical Preservative (DMSO, EDTA, Saturated NaCl) | Preserves morphology and DNA integrity at room temperature. | Ideal for field work and museum specimens; effective across nematodes, insects, and plants [44]. |
| DNeasy Blood & Tissue Kit | Commercial Kit (Enzymatic/Chemical) | Efficient DNA extraction from low-biomass samples. | Demonstrated superior yield from single paper point subgingival biofilm samples [42]. |
| PowerSoil Pro Kit | Commercial Kit (Mechanical/Chemical) | DNA extraction from complex, difficult samples (soil, stool). | Bead-beating based; outperformed non-mechanical kits for neonatal stool [46]. |
| GenTegra DNA | Anhydrobiosis Matrix | Room-temperature storage of purified DNA extracts. | Protects low-concentration DNA extracts (≥0.2 ng) for forensic applications; eliminates freezer dependency [45]. |
| Garnet Beads (0.7 mm) | Mechanical Lysis Aid | Enhances cell disruption in bead-beating homogenizers. | Provides a balance of efficient lysis and minimal DNA shearing when used with optimized settings [41]. |
| Proteinase K | Enzyme | Broad-spectrum serine protease; degrades proteins and inactivates nucleases. | Essential for digesting histones in nuclei and breaking down tough tissue structures. |
Successful template DNA preparation requires a strategic balance between mechanical and chemical lysis forces. The data and protocols presented herein demonstrate that there is no universal solution; the optimal method is dictated by sample type and analytical objectives. For long-read sequencing from complex matrices like soil, gentle mechanical lysis preserves fragment length. For low-biomass clinical samples like biofilms, enzymatic-chemical kits maximize yield. Integrating targeted chemical protectants like EDTA during critical phases such as tissue thawing provides a powerful strategy to safeguard DNA integrity against inherent nucleases. By applying these structured, evidence-based protocols, researchers can significantly enhance the quality and reliability of their genomic data.
Guidelines for DNA Template Concentration by Application Type
The preparation of high-quality DNA template is a foundational step in molecular biology, directly influencing the success and reproducibility of downstream applications. Within the broader context of template DNA preparation and quality control methods research, selecting the appropriate DNA concentration is critical for optimizing experimental outcomes across techniques ranging from basic PCR to next-generation sequencing (NGS) and in vitro transcription (IVT). This document provides application-specific guidelines for DNA template concentration, supported by detailed protocols and quality control measures essential for researchers, scientists, and drug development professionals.
DNA Template Concentration Guidelines by Application
The optimal DNA template concentration varies significantly depending on the specific application, required sensitivity, and the complexity of the starting material. The following table summarizes recommended concentrations for common molecular biology techniques.
Table 1: DNA Template Concentration Guidelines for Key Applications
| Application | Recommended Template Concentration | Key Considerations | Primary References |
|---|---|---|---|
| Standard PCR | 5–50 ng genomic DNA; 0.1–1 ng plasmid DNA [47] | Higher DNA amounts increase nonspecific amplification; lower amounts reduce yield. | [47] |
| Real-Time (qPCR/rt-PCR) | Varies by target; must be determined empirically and validated per ISO guidelines for sensitive pathogen detection [48] | Sensitivity must be balanced with specificity. Method verification against a reference standard is critical for diagnostic applications. | [48] |
| Automated Fluorescent Sequencing | 0.3–2 µg plasmid DNA per reaction [49] | Accurate quantitation is vital. Too much DNA causes premature termination; too little yields poor signal. | [49] |
| In Vitro Transcription (IVT) for mRNA Synthesis | Method-dependent; PCR-generated and linearized plasmid templates must be high-quality and intact for efficient mRNA production [6] | The quality and integrity of the linear DNA template are more critical than concentration alone. | [6] |
| Next-Generation Sequencing (NGS) Library Preparation | Protocol-dependent; requires tight quality control of input material [50] | Input requirements vary by library prep kit and sequencing platform. Quality control is essential to prevent biases. | [50] |
| Cell-Free Protein Production | Concentration must be optimized to minimize performance variability [19] | The amount of functional DNA added is a key factor influencing reproducibility and protein yield. | [19] |
Detailed Experimental Protocols
Protocol 1: Real-Time PCR for Pathogen Detection in Cosmetics
This protocol, adapted from a study evaluating real-time PCR (rt-PCR) for quality control of cosmetics, outlines the detection of Escherichia coli, Staphylococcus aureus, Pseudomonas aeruginosa, and Candida albicans [48].
Sample Inoculation and Enrichment:
- Select cosmetic products with varying physical characteristics (e.g., cream, gel, oil).
- Spike 1 g samples of each product with a low inoculum (3–5 CFU) of the target pathogen.
- Dilute spiked samples in 9 mL of Eugon broth and incubate at 32.5°C for 20–24 hours. For complex matrices (e.g., soap with antimicrobial ingredients), a 36-hour enrichment and a 1:100 sample dilution may be required [48].
Automatic DNA Extraction:
- Following enrichment, extract DNA using a commercial kit such as the PowerSoil Pro kit.
- Process 250 µL of enrichment, mixed with 800 µL of CD1 solution, using an automated extractor like the QIAcube Connect according to the manufacturer's instructions [48].
Real-Time PCR Pathogen Assays:
- Use commercial, validated rt-PCR kits that include an internal reaction control.
- Analyze each DNA extract in duplicate on a rt-PCR plate.
- Include necessary controls: a no-template control (NTC), a positive control provided in the kit, and extraction controls (medium, zero, and extraction controls) [48].
- Configure thermal cycling conditions according to the kit manufacturer's instructions.
Protocol 2: Plasmid DNA Preparation for Sequencing
This protocol details steps for preparing high-quality plasmid DNA suitable for automated fluorescent sequencing [49].
Cell Growth and Harvesting:
- Inoculate a single bacterial colony into a small volume of LB broth (not Terrific Broth) for a 4-8 hour starter culture.
- Use the starter to inoculate a larger overnight culture. Incubate at 37°C with shaking for 12-16 hours for high-copy plasmids [51].
- Harvest bacterial cells by centrifugation to form a pellet [51].
Alkaline Lysis and Purification:
- Resuspend the cell pellet in a resuspension buffer (e.g., Tris-HCl, EDTA, RNase A).
- Lyse cells using a lysis buffer (e.g., NaOH, SDS) to release plasmid DNA.
- Neutralize the solution with a neutralization buffer (e.g., potassium acetate) to precipitate cellular debris while keeping plasmid DNA in solution [51].
- Clear the lysate by centrifugation or filtration to remove precipitated debris [51].
Column Purification and Quality Control:
- Bind plasmid DNA from the cleared lysate to a silica column or similar DNA-binding matrix.
- Wash the column with an ethanol-based wash buffer to remove contaminants.
- Elute the purified plasmid DNA using a low-salt elution buffer (e.g., Tris-HCl or water) [51].
- Critical Steps for Sequencing:
- Wash the DNA pellet with 70% ethanol after isopropanol precipitation to remove excess salt.
- Dry the DNA pellet completely in a speedvac or by air-drying to remove residual ethanol.
- Accurately quantify the final DNA concentration by spectrophotometry. The optimal range for sequencing is 0.3–2 µg per reaction [49].
Protocol 3: Quality Control of FFPE DNA Using qPCR and Electrophoresis
This protocol employs a nanoscale quality control framework to assess DNA integrity from Formalin-Fixed Paraffin-Embedded (FFPE) samples for cancer research [9].
DNA Extraction and Enzymatic Repair:
- Extract genomic DNA from FFPE tissue sections using a dedicated kit (e.g., QIAamp DNA FFPE tissue kit).
- Treat an aliquot of the extracted DNA with a commercial enzymatic repair mix (e.g., PreCR repair mix) to address damage like crosslinks and deamination [9].
DNA Integrity Assessment:
- Gel Electrophoresis: Verify DNA integrity using 1% agarose gel electrophoresis. Intact DNA appears as a high-molecular-weight band, while degraded DNA manifests as a smear. For higher resolution, use denaturing polyacrylamide gel electrophoresis (PAGE) [9].
- Quantitative PCR (qPCR): Perform single-plex qPCR to amplify targets of varying lengths.
- Reaction Setup: 10 µL reaction containing 5 µL of 2× SYBR Green master mix, 1 µL of each forward and reverse primer (4 µM), 2 µL nuclease-free water, and 1 µL extracted DNA.
- Thermal Cycling: 95°C for 2 min; followed by cycles of 95°C for 10 s and 60°C for 30 s [9].
- Interpretation: A quantifiable inverse correlation exists between the degree of DNA fragmentation (seen as a smear on gel) and amplification efficiency in qPCR. Samples with poor integrity should be directed to targeted short-amplicon assays [9].
Workflow Visualization
The following diagram illustrates the logical workflow for selecting the appropriate DNA template preparation and quality control path based on the intended application.
DNA Template Preparation Workflow
Research Reagent Solutions
The following table lists key reagents and materials essential for successful DNA template preparation and analysis.
Table 2: Essential Research Reagents and Materials for DNA Template Preparation
| Item | Function/Application | Examples & Notes |
|---|---|---|
| Commercial Plasmid Prep Kits | Purify plasmid DNA from bacterial cultures at various scales. | Miniprep (1-5 mL, up to 40 µg), Midiprep (25-100 mL, up to 400 µg), Maxiprep (100-500 mL, up to 1.5 mg) [51]. |
| Nucleic Acid Extraction Kits | Isolate DNA from complex or challenging samples. | PowerSoil Pro kit for environmental/cosmetic samples [48]; QIAamp DNA FFPE tissue kit for archival tissues [9]. |
| Real-Time PCR Kits | Detect and quantify specific DNA targets with high sensitivity. | Kits include an internal reaction control. Must be validated per ISO guidelines for diagnostic QC [48]. |
| DNA Polymerase | Enzyme critical for amplifying target DNA in PCR. | Taq DNA polymerase for standard PCR. High-fidelity/engineered polymerases for long or GC-rich templates [47]. |
| DNA Repair Mix | Enzymatically repair damaged DNA from suboptimal samples. | PreCR repair mix for fixing FFPE-induced damage (crosslinks, deamination) [9]. |
| Fluorometric Assay | Accurately quantify DNA concentration. | Qubit Fluorometer; more accurate for dilute or contaminated samples than spectrophotometry [9]. |
| Agarose Gels | Assess DNA size, integrity, and approximate quantity. | Standard quality control step post-extraction and post-PCR [9] [51]. |
Adherence to application-specific DNA template concentration guidelines and rigorous quality control protocols is fundamental to achieving reliable and reproducible results in molecular biology and drug development. The protocols and frameworks presented here, encompassing real-time PCR, plasmid preparation, and FFPE DNA quality assessment, provide a standardized approach that aligns with international standards. By integrating these best practices for DNA template preparation, researchers can significantly reduce variability, enhance data accuracy, and ensure the success of downstream applications in genomic research, diagnostic development, and therapeutic manufacturing.
Solving Common DNA Preparation Problems: A Troubleshooting Guide
Within the broader context of template DNA preparation and quality control methods research, achieving high yields of pure plasmid DNA is a foundational step for downstream applications in drug development and molecular biology. A frequent and critical point of failure in this workflow is the inefficient lysis of bacterial cells, leading directly to insufficient plasmid yield and compromised data integrity. Incomplete lysis prevents the full release of plasmid content, while subsequent handling errors can cause irreversible plasmid loss. This application note details the primary causes of these issues and provides optimized, actionable protocols to ensure consistent, high-yield DNA preparation.
Troubleshooting Low DNA Yield
A systematic approach is essential for diagnosing the root causes of low plasmid DNA yield. The following table summarizes the common problems, their causes, and initial corrective actions.
Table 1: Troubleshooting Guide for Low Plasmid DNA Yield
| Problem Category | Specific Issue | Possible Cause | Recommended Solution |
|---|---|---|---|
| Bacterial Culture | Culture Oversaturation | Cells overgrow, leading to plasmid degradation and loss [52]. | Grow culture to late-log phase (OD600 ~3); avoid overnight overgrowth [52]. |
| Culture Undergrowth | Starting from old colonies/frozen stock extends lag time [52]. | Use fresh colonies (< few days old) or an active starter culture [52]. | |
| Loss of Selective Pressure | Antibiotic degrades (e.g., ampicillin), allowing plasmid-free cells to proliferate [52]. | Use fresh antibiotic stocks; for long growth, consider stable alternatives like kanamycin. | |
| Plasmid & Vector | Low Copy Number | Plasmid has a low origin of replication (e.g., pBR322, pACYC) [52]. | Use high-copy vectors (e.g., pUC); for low-copy, scale up culture volume [52]. |
| Problematic DNA Insert | Insert is toxic or unstable, making bacteria "sick" and reducing yield [52]. | Use specialized cell lines (e.g., STBL2 for unstable repeats) [52]. | |
| Lysis Process | Incomplete Lysis | Overly gentle mixing fails to fully resuspend or lyse the cell pellet [52]. | Invert tube continuously for 3 minutes after adding lysis buffer [52]. |
| Over-Extended Lysis | prolonged exposure to alkaline lysis buffer denatures plasmid DNA irreversibly [52]. | Do not exceed 5 minutes total lysis/neutralization time; follow protocol precisely. | |
| Insufficient Buffer Volumes | Standard volumes are inadequate for dense cultures or low-copy plasmids [52]. | Double the volumes of resuspension, lysis, and neutralization buffers [52]. | |
| Purification | Precipitate Quality | Neutralized lysate appears "gloopy" instead of a fine, "coconut-like" precipitate [52]. | Mix more vigorously after neutralization; if persistent, double buffer volumes next time [52]. |
| Poor Precipitation | Isopropanol used for precipitation is old or has absorbed water, reducing efficiency [52]. | Use fresh, high-quality isopropanol for precipitation steps [52]. |
Detailed Experimental Protocols
Protocol 1: Optimized Alkaline Lysis and Purification
This standard protocol highlights critical steps to prevent incomplete lysis and plasmid loss during a mini- or midiprep.
Workflow Overview:
Materials:
- Research Reagent Solutions:
- Resuspension Buffer (e.g., P1): Typically contains Tris-Cl (pH 8.0) and EDTA, often with RNase A. EDTA chelates metals to inhibit DNases [53] [51].
- Lysis Buffer (e.g., P2): Contains NaOH and SDS. SDS dissolves lipids and denatures proteins/genomic DNA; NaOH disrupts the cell membrane [53] [51].
- Neutralization Buffer (e.g., N3 or P3): Contains potassium or sodium acetate. Acidic buffer neutralizes the pH, precipitating proteins, genomic DNA, and SDS, while plasmid DNA remains soluble [53] [51].
- Wash Buffer: Contains ethanol or isopropanol to remove salts and other contaminants from the silica membrane [51].
- Elution Buffer (TE or water): Low-salt buffer (Tris-EDTA) or nuclease-free water releases purified plasmid DNA from the binding membrane [53] [51].
Step-by-Step Method:
- Cell Harvesting: Pellet bacterial cells from a healthy, late-log phase culture (OD600 ~3) by centrifugation. Completely remove the supernatant [51] [52].
- Resuspension: Resuspend the cell pellet completely in Resuspension Buffer by vigorous pipetting or vortexing until no cell clumps remain. An incomplete resuspension is a major cause of low yield [52].
- Alkaline Lysis: Add Lysis Buffer and mix immediately and gently by inverting the tube continuously for 3 minutes. Do not vortex, as this will shear genomic DNA. The solution should become viscous and clear. Critical Step: Do not allow lysis to proceed for more than 5 minutes to prevent plasmid denaturation [52].
- Neutralization: Add Neutralization Buffer and mix immediately and gently by inverting the tube continuously for 1 minute. A fine, white precipitate of protein, genomic DNA, and cell debris should form. A "gloopy" consistency indicates issues [52].
- Clearing Lysate: Centrifuge the lysate for 10 minutes at high speed (>12,000 × g). The precipitate will form a tight pellet. Carefully transfer the supernatant (containing the plasmid DNA) to a new tube or a silica membrane column, avoiding the transfer of any precipitate [51].
- Binding and Washing: For column-based purification, follow kit instructions. Typically, the cleared lysate is applied to the column, centrifuged, washed with Wash Buffer, and centrifuged again to dry the membrane [51]. Ensure all ethanol from the wash is removed.
- Elution: Elute the purified plasmid DNA with pre-warmed (40-50°C) Elution Buffer or water. Let it sit on the membrane for 1-2 minutes before centrifugation to increase yield [51].
Protocol 2: Chloroform-Bead Mechanical Lysis for Stubborn Samples
For tough-to-lyse bacterial strains or other challenging samples (e.g., mycobacteria, gram-positive bacteria), a combination of chemical and mechanical lysis is vastly superior [54] [8].
Workflow Overview:
Materials:
- Research Reagent Solutions:
- 0.2 mm Glass Beads: Provide mechanical shearing force to physically disrupt tough cell walls [54].
- Chloroform: Acts as a potent chemical lysis agent, sterilizes the sample, and aids in lipid removal [54].
- NaCl/TE Buffer: Provides a saline and buffered environment for the reaction [54].
- RNase A: Degrades RNA to prevent its co-purification with DNA [54] [53].
- Phenol-Chloroform: Organic solvent for protein removal and further purification [54].
- Phase-Lock Tubes: Facilitate easy and clean separation of aqueous and organic phases, improving recovery and safety [54].
Step-by-Step Method:
- Sample Preparation: Transfer a cell pellet (or a ~10 mg loopful from solid media) to a 2.0 mL screw-cap tube containing 600 mg of 0.2 mm glass beads [54].
- Lysis: Add 700 µL of 0.1 M NaCl/TE buffer and 500 µL of chloroform to the tube [54].
- Mechanical Disruption: Securely close the tube and vortex at 2,700 rpm for 7 minutes using a vortex adapter for consistent, high-speed mixing. This step simultaneously applies chemical and mechanical lysis [54].
- RNase Treatment: Add RNase A to the lysate and incubate for 20 minutes at room temperature to remove RNA [54].
- Purification: Transfer the mixture to a phase-lock tube. Perform phenol-chloroform extraction, followed by a chloroform extraction alone, to purify the DNA [54].
- Precipitation and Elution: Precipitate the DNA from the final aqueous phase using isopropanol. Wash the DNA pellet with 70% ethanol, air-dry, and resuspend in 100 µL of elution buffer [54].
Results and Data Analysis
The effectiveness of optimized lysis protocols is demonstrated by quantitative improvements in DNA yield and quality. The data below compare a conventional method with the enhanced Chloroform-Bead method.
Table 2: Performance Comparison of DNA Extraction Methods for Mycobacteria [54]
| Method | DNA Yield (µg, median) | Purity (A260/A230, median) | Processing Time |
|---|---|---|---|
| Conventional Methods | 1.9 | 1.22 | 2-3 days |
| Chloroform-Bead Method | 17.9 - 22.2 | 1.86 - 1.96 | ~2 hours |
This multi-laboratory evaluation demonstrates that the Chloroform-Bead method, which directly addresses incomplete lysis, provides a ~10-fold increase in yield and significantly higher purity while drastically reducing processing time [54]. The method has been validated across a large number of samples, including M. tuberculosis and over 32 non-tuberculous mycobacterial species, confirming its robustness and universal applicability for difficult-to-lyse organisms [54].
The integrity of template DNA is a foundational requirement for the success of downstream molecular applications, including next-generation sequencing (NGS) and polymerase chain reaction (PCR). DNA degradation, the process by which DNA fragments into smaller pieces, poses a significant challenge in fields ranging from forensic science to clinical diagnostics and drug development [55]. This degradation occurs primarily through three core mechanisms: oxidation, hydrolysis, and enzymatic breakdown [8]. Effective management of these processes is critical during the preparation of template DNA, as degraded samples can lead to incomplete genetic profiles, failed sequencing runs, and unreliable research data [56]. This application note provides a detailed examination of these degradation pathways and offers robust, practical protocols to preserve DNA integrity, ensuring the quality and reproducibility of research outcomes.
Understanding the Mechanisms of DNA Degradation
The degradation of DNA is a dynamic process influenced by environmental factors and sample handling practices. A thorough understanding of the underlying mechanisms is the first step in developing effective countermeasures.
Oxidative Damage
Oxidation is a major cause of DNA damage, particularly in samples exposed to environmental stressors. Reactive oxygen species (ROS), such as free radicals, modify nucleotide bases, leading to strand breaks and structural alterations that interfere with enzymatic processes like replication and sequencing [8]. Sources of oxidative stress include heat and UV radiation. To slow this process, the use of antioxidants and proper storage in oxygen-free environments or at ultra-low temperatures (e.g., -80°C) is highly recommended [8].
Hydrolytic Damage
Hydrolysis, driven by water molecules, attacks the DNA backbone. This process leads to two primary types of damage:
- Depurination: The removal of purine bases (adenine and guanine), resulting in abasic sites that can stall polymerase enzymes during amplification [8].
- Deamination: The conversion of cytosine to uracil, which introduces erroneous base calls during sequencing [56]. Hydrolytic damage is extensive in aqueous environments and can fragment DNA into unusable pieces. Using buffered solutions to maintain a stable pH and storing samples in dry or frozen conditions can significantly reduce hydrolysis-related degradation [8].
Enzymatic Breakdown
Enzymatic breakdown, primarily caused by nucleases, is a rapid and efficient degradation pathway. Endogenous nucleases are activated upon cell death, while exogenous nucleases are introduced by proliferating microorganisms [56]. These enzymes cleave the phosphodiester bonds in the DNA backbone. Protection strategies include heat treatment during extraction, the use of chelating agents like EDTA to inactivate metal-dependent nucleases, and the incorporation of nuclease inhibitors into storage buffers [8].
The following diagram illustrates the interconnected nature of these degradation pathways and their impact on DNA integrity.
Quantitative Analysis of Degradation Factors
The rate of DNA degradation is not constant; it is governed by specific environmental conditions. The following tables summarize key quantitative relationships and the stability of different DNA forms, which are critical for risk assessment and protocol design.
Table 1: Environmental Factor Impact on DNA Degradation
| Factor | Effect on Degradation Rate | Quantitative Impact & Notes |
|---|---|---|
| Temperature | Strong positive correlation | Increase of 10°C can double/treble chemical degradation rates; a 2°C rise measurably impacts nDNA stability [56]. |
| Humidity/Moisture | Strong positive correlation | Water activity is a primary reactant in hydrolysis and enables microbial growth [56]. |
| UV Radiation | Direct damage | Induces cyclobutane pyrimidine dimers, distorting the DNA helix and blocking polymerase activity [56]. |
| pH | Extreme values accelerate damage | Acidic conditions catalyze hydrolytic destruction (e.g., depurination at pH ~3); neutral to slightly alkaline pH is most favorable [57] [56]. |
| Microbial Activity | Major enzymatic driver | Microbes introduce exogenous nucleases; their metabolic activity can alter local pH [56]. |
Table 2: Comparative DNA Stability and Degradation
| Characteristic | Nuclear DNA (nDNA) | Mitochondrial DNA (mtDNA) |
|---|---|---|
| Structure | Linear, double-stranded | Circular, double-stranded |
| Copies per Cell | Two (diploid) | Hundreds to thousands (haploid) [56] |
| Relative Degradation Rate | Higher | Lower persistence in degraded samples due to higher copy number and circular structure [55] [56] |
| Key Degradation Insight | Guanine sites show substantially increased rates of base-loss due to unique electron resonance structure [57]. |
Practical Experimental Protocols for Managing DNA Degradation
This section provides actionable protocols to mitigate DNA degradation during sample handling, storage, and analysis.
Protocol: Prevention of Degradation During Sample Collection and Storage
Principle: To preserve DNA integrity by immediately inhibiting degradative pathways upon sample collection.
Materials:
- Antioxidants (e.g., for inclusion in buffers)
- EDTA (a chelating agent to inhibit nucleases)
- Specialized preservatives (e.g., DNA/RNA Shield, or similar commercial products)
- Liquid nitrogen (for flash-freezing)
- -80°C freezer for long-term storage
- FTA Cards for room-temperature storage of stable samples [57]
Workflow Diagram:
Procedure:
- Rapid Processing: Process fresh samples immediately whenever possible.
- Chemical Preservation:
- For tissues or cells in suspension, immediately immerse in a specialized stabilization medium that contains antioxidants and nuclease inhibitors [8].
- Alternatively, homogenize the sample in a lysis buffer containing EDTA (e.g., 10-20 mM) and a reducing agent.
- Physical Preservation (Flash Freezing):
- For long-term preservation, submerge a small piece of tissue (≤ 0.5 cm³) directly in liquid nitrogen. This halts all biochemical activity instantly.
- Transfer and store the frozen sample at -80°C [8].
- Room-Temperature Storage: For stable samples like blood or buccal cells, apply to FTA Cards, which contain chemicals that denature proteins and chelate cations, enabling safe storage at room temperature [57].
Protocol: Optimized DNA Extraction from Challenging Samples
Principle: To efficiently recover the maximum amount of non-degraded DNA from difficult, low-input, or formalin-fixed samples while removing PCR inhibitors.
Materials:
- Lysis Buffer (e.g., MagMAX DNA Multi-Sample Ultra 2.0 Buffer or similar, with EDTA)
- Proteinase K
- Mechanical Homogenizer (e.g., Bead Ruptor Elite with specialized bead tubes) [8]
- RNase A
- Magnetic bead-based purification kit (e.g., MagMAX series)
- Thermomixer
- Automated nucleic acid extractor (e.g., KingFisher) [58]
Procedure:
- Lysate Preparation:
- Tough Tissues (e.g., bone, plant): Use a combination of chemical and mechanical lysis. Add samples to a tube with lysis buffer, Proteinase K, and ceramic beads. Homogenize using the Bead Ruptor Elite with optimized speed and time settings to avoid excessive shearing. Incubate at 55–72°C with shaking until fully lysed [8] [58].
- FFPE Samples: First, perform dewaxing and deparaffinization. Use automated solutions like AutoLys M Tubes with heating and Proteinase K digestion to break cross-links [58].
- Optional RNase Treatment: Add RNase A to the lysate and incubate at room temperature for 2-5 minutes to reduce RNA contamination, which can confound quantification [58].
- Nucleic Acid Purification: Use magnetic bead-based chemistry (e.g., MagMAX) on an instrument like the KingFisher. This method efficiently binds DNA, removes inhibitors (e.g., heme, humic acids), and yields high-purity DNA compatible with sensitive downstream applications like NGS [58].
- Elution: Elute the purified DNA in a low-EDTA TE buffer or nuclease-free water, adjusted to a neutral pH (~8.0).
Protocol: Quality Control and Degradation Assessment
Principle: To accurately quantify and qualify the extracted DNA to determine its suitability for downstream applications.
Materials:
- Spectrophotometer (e.g., NanoDrop One)
- Fluorometer (e.g., Qubit) with dsDNA HS Assay Kit
- Capillary Electrophoresis System (e.g., Agilent TapeStation, Bioanalyzer, or Fragment Analyzer)
- Quantitative PCR (qPCR) kit with assays for multiple target lengths (e.g., Quantifiler HP) [59]
Procedure:
- Purity and Concentration:
- Use spectrophotometry (NanoDrop) to assess the A260/A280 ratio. A ratio of ~1.8 is ideal, but be aware that this method is sensitive to contaminants.
- Use fluorometry (Qubit) for a specific and accurate measurement of double-stranded DNA concentration, as it is not affected by RNA or nucleotides.
- Integrity and Fragmentation Analysis:
- Perform capillary electrophoresis. This provides a DNA Integrity Number (DIN) or similar metric and an electrophoretogram showing the distribution of DNA fragment sizes. A sharp peak at a high molecular weight indicates intact DNA, while a smear of low-molecular-weight fragments indicates degradation.
- Alternatively, use qPCR to amplify targets of different lengths (e.g., short vs. long amplicons). A significant drop in amplification efficiency for the longer amplicon is a clear indicator of DNA fragmentation [60]. The Degradation Index (DI), provided by some quantification kits, is a valuable metric for estimating the level of fragmentation and adjusting the amount of DNA used in PCR [59].
The Scientist's Toolkit: Essential Reagents and Equipment
Table 3: Key Research Reagent Solutions for Managing DNA Degradation
| Item | Function/Benefit | Application Notes |
|---|---|---|
| EDTA | Chelates Mg²⁺ ions, inactivating metal-dependent DNases. | Standard component of lysis and TE elution buffers [8]. |
| Antioxidants | Scavenges Reactive Oxygen Species (ROS), reducing oxidative base damage. | Added to storage buffers and some stabilization media [8]. |
| FTA Cards | Solid medium for room-temperature DNA storage; contains lyophilized chelators and denaturants. | Ideal for stable sample collection and shipping [57]. |
| Magnetic Bead Kits | Selective binding of DNA for efficient purification and inhibitor removal. | Kits like MagMAX are optimized for a wide range of challenging samples [58]. |
| Mechanical Homogenizer | Provides controlled, efficient cell disruption for tough samples. | The Bead Ruptor Elite allows parameter optimization to minimize DNA shearing [8]. |
| Stabilization Media | Chemically preserves nucleic acids at room temperature by inhibiting nucleases and oxidation. | Useful for field collection or when immediate freezing is not possible [58]. |
| Proteinase K | Broad-spectrum serine protease; digests nucleases and other proteins. | Critical for efficient lysis, especially in tissues and FFPE samples [58]. |
Effective management of DNA degradation is not a single step but an integrated practice spanning from sample collection to final quality control. By understanding the distinct threats posed by oxidation, hydrolysis, and enzymatic breakdown, researchers can implement the targeted strategies and detailed protocols outlined in this document. The consistent application of these methods—utilizing appropriate preservatives, optimized extraction techniques, and rigorous QC—ensures the recovery of high-quality template DNA. This, in turn, guarantees the reliability of data generated in advanced molecular applications, directly supporting robust and reproducible scientific research in drug development and beyond.
The purity of template DNA is a foundational requirement for the success and reproducibility of downstream applications in pharmaceutical development and basic research. Contaminants such as salts, EDTA, proteins, and organic solvents co-purified during extraction can profoundly inhibit enzymatic reactions, compromise sequencing accuracy, and lead to erroneous conclusions in quality control assays [61]. The challenge is particularly acute in sensitive fields such as clinical diagnostics, gene therapy, and next-generation sequencing, where the integrity of the genetic template dictates the reliability of the entire experimental pipeline. This application note details standardized protocols for the identification and removal of these pervasive contaminants, providing a rigorous framework to support robust thesis research on DNA preparation methodologies.
Different contaminants interfere with biological assays through distinct mechanisms. Understanding these impacts is crucial for diagnosing purity issues and selecting the appropriate cleanup strategy.
- Salts (e.g., Chaotropes, Citrates): High concentrations of ions can disrupt the precise ionic balance required for enzyme function. For instance, chaotropic salts used in silica-binding protocols can inhibit polymerase activity in PCR if not adequately removed [61].
- EDTA (Ethylenediaminetetraacetic acid): This common buffer component acts as a chelating agent, sequestering divalent cations like Mg²⁺ that are essential cofactors for many enzymes, including DNA polymerases in PCR and restriction enzymes in cloning [62].
- Proteins: Incompletely digested or removed proteins can bind to DNA, interfering with enzyme access and functionality in downstream enzymatic steps [63].
- Organic Solvents (Phenol, Chloroform, Ethanol): Carry-over of these solvents from extraction procedures can denature proteins and inhibit enzyme-driven reactions. Phenol, even at low concentrations, is a potent protein denaturant and can disrupt enzymatic assays [61].
The table below summarizes the primary sources and potential effects of these contaminants on common downstream applications.
Table 1: Common Contaminants in DNA Preparation and Their Downstream Effects
| Contaminant | Typical Source | Impact on Downstream Applications |
|---|---|---|
| Salts (e.g., Guanidinium, NaOAc) | Lysis buffers, binding buffers, precipitation [64] [61] | Inhibits PCR & enzyme digestions by disrupting ionic balance; interferes with spectrophotometry [61]. |
| EDTA | Resuspension buffer (e.g., TE buffer), lysis buffers [51] [62] | Chelates Mg²⁺, an essential cofactor for polymerases and restriction enzymes, halting enzymatic reactions [62]. |
| Proteins | Incomplete cell lysis or protein precipitation [64] [63] | Can coat DNA, blocking enzyme binding sites and leading to failed or inefficient reactions [63]. |
| Organic Solvents (Phenol, Ethanol) | Phenol-chloroform extraction, ethanol precipitation steps [63] [61] | Denatures enzymes in PCR and sequencing; ethanol can cause DNA to float out of gel wells during electrophoresis [61]. |
Quantitative Analysis of Cleanup Method Performance
Selecting an optimal cleanup method requires a balance of efficiency, throughput, and practicality. The following table provides a comparative overview of key performance metrics for standard decontamination protocols.
Table 2: Performance Comparison of Major Nucleic Acid Cleanup Methods
| Method | Principle | Effective Contaminant Removal | Typical Recovery Efficiency | Processing Time | Relative Cost |
|---|---|---|---|---|---|
| Ethanol Precipitation | Solubility shift in alcohol/salt; centrifugation [61] | Salts, nucleotides, short primers [61] | Moderate to High (can vary with pellet handling) | High (including incubation) [61] | Low |
| Silica Column | Binding to silica membrane under high salt; wash and elute [64] [61] | Proteins, salts, organics, dyes [61] | High (can be sample size dependent) | Moderate | Moderate |
| Anion Exchange | Binding to DEAE groups via salt pH/condition control [65] [61] | Proteins, RNA, endotoxins [65] | Very High (near 100% reported) [65] | Moderate | Moderate to High |
| Magnetic Beads | Charge-based binding at low pH; magnetic capture [61] | Proteins, salts, organics [61] | High | Low (amenable to automation) [61] | High |
| Phenol-Chloroform Extraction | Liquid-phase separation; proteins denature at interface [63] [61] | Proteins, cellular debris [63] | Moderate (risk of interphase loss) | High (hazardous handling) [61] | Low |
Detailed Experimental Protocols for Contaminant Removal
Protocol: Ethanol Precipitation for Desalting and Concentrating DNA
This classic method is effective for removing salts and concentrating DNA samples, though it requires careful handling to avoid co-precipitating contaminants or losing material [61].
- 1. Sample Preparation: Transfer the DNA sample (in aqueous solution) to a nuclease-free microcentrifuge tube.
- 2. Salt Addition: Add salt to provide counterions for precipitation. Common choices include:
- 3. Alcohol Addition: Add 2 to 2.5 volumes of ice-cold 100% ethanol. Mix thoroughly by vortexing.
- 4. Precipitation: Incubate at -20°C for 30 minutes to overnight. For maximum recovery of short fragments or low-concentration samples, longer incubation (overnight) is recommended.
- 5. Pelletting: Centrifuge at >12,000 × g for 15-30 minutes at 4°C. Carefully decant the supernatant without disturbing the pellet.
- 6. Washing: Add 500 μL to 1 mL of ice-cold 70% ethanol to the pellet. Vortex briefly or tap the tube to dislodge the pellet. Centrifuge at >12,000 × g for 5-10 minutes at 4°C. Carefully decant the supernatant.
- 7. Drying: Air-dry the pellet for 5-15 minutes at room temperature until no visible ethanol remains. Do not over-dry, as this can make DNA difficult to resuspend.
- 8. Resuspension: Resuspend the DNA in an appropriate buffer (e.g., TE buffer or nuclease-free water) [61].
Protocol: Silica Column-Based Cleanup
This protocol utilizes a bind-wash-elute workflow to remove a wide range of contaminants and is the basis for many commercial kits [64] [61].
- 1. Binding Condition Adjustment: Mix the DNA sample with a binding buffer. This buffer typically contains a chaotropic salt (e.g., guanidine hydrochloride) which denatures proteins and allows DNA to bind to the silica membrane [64].
- 2. Binding: Transfer the mixture to a silica membrane column. Centrifuge at ≥10,000 × g for 30-60 seconds. Discard the flow-through. The DNA is now bound to the membrane.
- 3. Washing: Add a wash buffer (often containing ethanol and salts) to the column. Centrifuge at ≥10,000 × g for 30-60 seconds. Discard the flow-through. This step removes salts, solvents, and other impurities [64] [61]. A second wash may be performed for higher purity requirements.
- 4. Elution: Transfer the column to a clean collection tube. Apply a low-ionic-strength elution buffer (e.g., TE buffer or nuclease-free water) directly to the center of the membrane. Incubate at room temperature for 1-2 minutes to allow full hydration of the membrane. Centrifuge at ≥10,000 × g for 1-2 minutes to collect the purified DNA [64].
Protocol: Phenol-Chloroform Extraction for Protein Removal
This method is highly effective for removing protein contamination from DNA samples, but requires careful handling due to the toxicity of the reagents [63] [61].
- 1. Volume Adjustment: Bring the DNA sample to a standard volume (e.g., 100 μL) with TE buffer or nuclease-free water in a sterile microcentrifuge tube.
- 2. Organic Mixture Addition: Add an equal volume of phenol:chloroform:isoamyl alcohol (25:24:1). Cap the tube tightly.
- 3. Phase Separation: Vortex vigorously for 15-30 seconds to form an emulsion. Centrifuge at 12,000 × g for 5 minutes at room temperature. This will separate the mixture into two distinct phases: a lower organic phase and an upper aqueous phase containing the DNA, with a white protein interface in between.
- 4. Aqueous Phase Recovery: Carefully transfer the upper aqueous phase to a new microcentrifuge tube, avoiding the protein interface and the lower organic phase.
- 5. Chloroform Wash (Optional): For extreme purity, add an equal volume of chloroform to the recovered aqueous phase. Vortex and centrifuge as in steps 3-4. This step helps remove any residual phenol.
- 6. DNA Recovery: Recover the DNA from the final aqueous phase by ethanol precipitation, as described in Protocol 4.1 [63].
Workflow Visualization for Contaminant Removal
The following diagram illustrates the key decision pathways for selecting an appropriate decontamination strategy based on the primary contaminant and sample requirements.
The Scientist's Toolkit: Essential Research Reagent Solutions
Successful implementation of the protocols above relies on a set of core reagents and materials. The following table details key solutions and their specific functions in the decontamination workflow.
Table 3: Essential Reagents for Nucleic Acid Cleanup Protocols
| Reagent / Solution | Function / Mechanism |
|---|---|
| TE Buffer (Tris-EDTA) | Standard storage and elution buffer. Tris maintains pH; EDTA chelates metal ions to inhibit nucleases [64] [62]. |
| Chaotropic Salt Buffers (e.g., Guanidine HCl) | Denatures proteins and enables DNA binding to silica matrices in column-based purification [64]. |
| Binding Buffer (for Silica/IEX) | Provides optimal salt and pH conditions to promote nucleic acid binding to the purification matrix [65]. |
| Wash Buffer (Ethanol/Salt) | Removes contaminants, salts, and solvents from the matrix while keeping DNA bound. Alcohol helps associate nucleic acid with the matrix [64] [61]. |
| Elution Buffer (Low-salt, TE/Water) | Disrupts DNA-matrix interaction under low-ionic-strength conditions, releasing purified DNA [64]. |
| Phenol:Chloroform:IAA | Organic mixture for liquid-liquid extraction. Denatures and removes proteins; IAA reduces foaming [63]. |
| Ethanol (70% & 100%) | 70% used for washing precipitates to remove salts; 100% used for precipitating nucleic acids [61]. |
| 3M Sodium Acetate (pH 5.2) | Provides monovalent cations (Na⁺) required for efficient ethanol precipitation of DNA [61]. |
The meticulous removal of contaminants is not merely a preparatory step but a critical determinant of data integrity in molecular research. The protocols and analyses presented here provide a validated framework for researchers to ensure the highest quality of template DNA, thereby safeguarding the validity of downstream applications in drug development and thesis research. By systematically applying these methods—whether ethanol precipitation for desalting, silica columns for comprehensive cleanup, or phenol-chloroform extraction for stubborn proteinaceous impurities—scientists can significantly enhance the reliability and reproducibility of their genetic analyses.
Within the broader context of template DNA preparation and quality control research, the efficient recovery of large DNA fragments (>10 kb) remains a critical challenge that can directly impact the success of sophisticated downstream applications. Techniques such as long-read sequencing, genome assembly, and cloning of large genetic constructs are particularly dependent on the integrity and yield of the starting DNA material [1] [11]. The elution step in solid-phase extraction protocols represents a key bottleneck for large fragments, as these molecules bind more tightly to silica matrices than their shorter counterparts [66]. This application note synthesizes current research and provides detailed, optimized protocols to overcome these limitations, ensuring high-yield recovery of high molecular weight (HMW) DNA for demanding applications in pharmaceutical development and basic research.
The fundamental issue stems from the increased number of interaction points between a long DNA molecule and the silica surface. While this property aids in binding during the wash steps, it conversely makes the complete release of the intact fragment during elution considerably more difficult. As noted by manufacturers, "Larger DNA fragments bind more tightly to the QIAquick columns," making efficient recovery unpredictable for fragments significantly larger than 10 kb [66]. Without protocol optimization, this can result in substantial DNA losses, compromising experimental outcomes and wasting valuable sample material.
Technical Challenges and Optimized Parameters
Key Factors Influencing Elution Efficiency
The recovery of large DNA fragments is influenced by several interconnected parameters. Understanding and controlling these factors is essential for developing a robust elution strategy.
Elution Buffer Temperature: Pre-warming the elution buffer is the most consistently recommended intervention for improving the yield of large fragments. Heated buffer increases the kinetic energy of the molecules, facilitating their release from the silica matrix. For instance, one manufacturer suggests that if a fragment is "only a few kb larger than the 10 kb limit, it can be helpful to heat the elution buffer EB to 60°C and let it incubate on the column for a few minutes before centrifuging" [66]. Similarly, the Monarch PCR & DNA Cleanup Kit protocol recommends pre-warming the elution buffer to 50°C for fragments >10 kb [67].
Incubation Time: The duration for which the elution buffer is in contact with the purification matrix is directly correlated with yield for large fragments. Rushing this step leads to incomplete elution. A standard 1-minute incubation is insufficient for HMW DNA; extended incubation times of at least 5 minutes are necessary to allow the buffer to penetrate the matrix and desorb the DNA fully [67].
Buffer Composition and pH: The chemical environment of the elution buffer is crucial for both yield and long-term stability. Low-EDTA TE buffer (10 mM Tris-HCl, 0.1 mM EDTA, pH 8.5) is widely recommended as it provides a stable, slightly alkaline environment that protects DNA from degradation [67] [11]. It is critical to avoid using nuclease-free water without pH verification, as slightly acidic water (e.g., Milli-Q water) can damage DNA and reduce yield [67]. Furthermore, storage of DNA in magnesium-containing solutions should be avoided, as magnesium can promote enzymatic degradation [67].
Column Capacity and Overloading: Exceeding the DNA binding capacity of a purification column dramatically reduces elution efficiency. Overloading causes clogging and creates a dense matrix from which large fragments cannot escape. If dealing with high DNA quantities, the sample should be split across multiple columns to ensure optimal recovery [67].
Quantitative Comparison of Elution Conditions
The table below summarizes the impact of different elution parameters on the recovery of large DNA fragments, providing a quick reference for protocol optimization.
Table 1: Optimization parameters for eluting large DNA fragments
| Parameter | Standard Protocol | Optimized Protocol for Large Fragments (>10 kb) | Impact on Yield |
|---|---|---|---|
| Elution Buffer Temperature | Room temperature | 50–60°C [67] [66] | Significant increase |
| Incubation Time | 1 minute | ≥5 minutes [67] | Major improvement |
| Application Technique | Standard application | Apply buffer directly to the center of the column matrix [67] | Improves consistency |
| Elution Volume | Variable | Can be as low as 5 µL for high concentration [67] | Increases concentration |
| Buffer Type | Water or TE | Low-EDTA TE Buffer, pH 8.5 [67] [11] | Ensures stability and compatibility |
Alternative Extraction Methods
While silica column protocols can be optimized, alternative nucleic acid extraction methodologies can offer superior performance for HMW DNA. A 2025 study reported a magnetic silica bead-based method called SHIFT-SP, which is both rapid (6–7 minutes) and highly efficient [24]. When compared to a commercial column-based method, SHIFT-SP delivered double the DNA yield in a fraction of the time (6–7 minutes vs. 25 minutes) [24]. The key to its efficiency with large DNA lies in the optimized binding and elution conditions, including a "tip-based" mixing mode that enhances bead-sample interaction. For specialized applications requiring extraction from complex matrices like dried blood spots (DBS), a cost-effective Chelex-100 resin boiling method has also been shown to provide high DNA recovery, making it suitable for low-resource settings [68].
Experimental Protocol: Optimized Elution for Large Fragments
Detailed Workflow
This protocol is designed for the recovery of DNA fragments >10 kb from silica-based spin columns, incorporating critical optimization steps.
Materials Required
- Purified DNA bound to a silica spin column (e.g., Monarch Spin Column S1A [67])
- Low-EDTA TE Buffer (10 mM Tris-HCl, 0.1 mM EDTA, pH 8.5) or kit-specific elution buffer [67] [11]
- Thermal block or water bath, set to 50–60°C
- Microcentrifuge
- Nuclease-free collection tube
Procedure
- Pre-warm Elution Buffer: Pre-heat the required volume of elution buffer to 50–60°C in a thermal block or water bath. Note: For very large fragments (>20 kb), a temperature of 60°C is preferred [66].
- Apply Buffer to Column: Place the silica column containing the bound DNA in a clean collection tube. Apply the pre-warmed elution buffer directly to the center of the column matrix to ensure even distribution and maximum contact [67].
- Incubate: Allow the column to stand at room temperature for at least 5 minutes with the buffer on the matrix. This extended incubation is critical for the efficient desorption of large DNA fragments [67].
- Centrifuge: Centrifuge the column for 1 minute at the recommended speed to collect the eluate.
- Optional Second Elution: For maximum recovery, the elution step (steps 2-4) can be repeated with a fresh aliquot of buffer, pooling the eluates. Note that this will increase the total volume but can enhance overall yield.
Workflow Visualization
The following diagram illustrates the optimized elution workflow, highlighting the key modifications that lead to improved recovery of large DNA fragments.
Quality Control and Downstream Applications
Post-Elution Quality Assessment
Rigorous quality control is non-negotiable after optimizing the elution process. The following checks are recommended to confirm the quantity, quality, and integrity of the recovered large fragments.
- Quantification: Use a fluorometric method (e.g., Qubit Fluorometer with dsDNA BR Assay) for accurate DNA mass measurement. Spectrophotometric methods (NanoDrop) are unreliable for quantification as they are sensitive to contaminants, but they are useful for assessing purity [1] [11].
- Purity Assessment: Measure absorbance ratios. A pure DNA sample typically has an A260/280 ratio of ~1.8 and an A260/230 ratio between 2.0–2.2. Significantly lower 260/230 ratios indicate contamination by salts or other chemicals that can inhibit enzymatic reactions [67] [1].
- Size and Integrity Verification: For fragments >10 kb, standard agarose gel electrophoresis is insufficient. Use pulsed-field gel electrophoresis or an Agilent Femto Pulse System to accurately assess the molecular weight and confirm the absence of shearing [1]. Visually, intact HMW DNA should appear as a tight, high-molecular-weight band, while degraded DNA will form a smear of lower molecular weight fragments [1].
Research Reagent Solutions
The table below lists key reagents and their critical functions in the optimized elution workflow for large DNA fragments.
Table 2: Essential research reagents for optimized large fragment elution
| Reagent | Function in Protocol | Key Consideration |
|---|---|---|
| Low-EDTA TE Buffer (pH 8.5) | Ideal elution buffer for DNA stability and storage [67] [11]. | Avoids DNA degradation and is compatible with downstream enzymatic steps. |
| Silica Spin Columns (e.g., Monarch) | Solid matrix for DNA binding and purification [67]. | Do not exceed the binding capacity (e.g., 5 µg). |
| Magnetic Silica Beads (e.g., for SHIFT-SP) | Alternative solid phase for rapid, high-yield extraction [24]. | Enables automation and can provide superior yield for large DNA. |
| Chelex-100 Resin | Cost-effective matrix for rapid boiling extraction methods [68]. | Ideal for specific sample types like DBS, though purity may be lower. |
The successful recovery of large DNA fragments is a pivotal step in modern molecular biology, directly influencing the quality of data produced in genomic and drug development research. By systematically optimizing elution conditions—primarily through the use of pre-warmed buffer (50–60°C) and extended incubation times (≥5 minutes)—researchers can dramatically improve the yield and integrity of these valuable molecules. Adherence to strict post-elution QC measures further ensures that the DNA is of sufficient quality for demanding downstream applications. The protocols and data summarized in this application note provide a reliable framework for scientists to maximize the return from their template DNA preparation efforts, thereby enhancing the overall reliability and efficiency of their research pipelines.
Preventing PCR Inhibition and Sequencing Artifacts from Sample Prep
The integrity of molecular biology analyses, particularly in drug development and clinical research, is fundamentally dependent on the quality of the starting genetic material. The processes of Polymerase Chain Reaction (PCR) and Next-Generation Sequencing (NGS) are highly sensitive to the presence of interfering substances and suboptimal preparation techniques. PCR inhibition and sequencing artifacts can compromise data accuracy, leading to false negatives, erroneous variant calls, and ultimately, unreliable scientific conclusions [69] [70]. These challenges are particularly pronounced when working with complex or low-input samples such as trace forensic evidence, formalin-fixed paraffin-embedded (FFPE) tissues, or microbiological specimens from inhibitory environments [71] [69]. This application note details a comprehensive framework of protocols and quality control measures designed to mitigate these risks at the sample preparation stage, ensuring the generation of robust and reproducible data for downstream applications.
Core Challenges and Underlying Mechanisms
PCR Inhibition
PCR inhibitors are organic or inorganic molecules that co-purify with nucleic acids and disrupt the amplification process [69]. Their mechanisms of action are varied:
- Binding to Polymerase: Molecules such as polyphenolics and humic acids can bind directly to the DNA polymerase enzyme, preventing its activity and halting elongation [69].
- Cofactor Sequestration: Inhibitors like EDTA and tannins chelate essential cofactors such as Mg²⁺ ions, which are critical for polymerase function, thereby decreasing or completely inactivating the reaction [69].
- Template Interaction: Certain inhibitors can crosslink with the DNA template itself, preventing the denaturation step and making the template unavailable for primer binding [69]. Common sources of inhibitors include heme in blood, indigo dyes from fabrics, collagen in tissues, humic acid from soil, and melanin [71] [69].
Sequencing Artifacts
Sequencing artifacts, especially in targeted sequencing approaches, introduce non-biological errors into the data. Key sources include:
- Primer-Driven Artifacts: The continuous evolution of viruses like SARS-CoV-2 poses a significant challenge for targeted amplification. Mutations in primer-binding sites can lead to amplicon drop-out, biased amplification, or the incorporation of primer-derived sequences into the final assembly, resulting in base-calling errors [70] [72].
- PCR Amplification Errors: The amplification step itself can introduce chimeras, template-switching, and amplification biases, especially when dealing with complex mixtures or low-copy-number templates [70] [50].
- Bioinformatic Misalignment: The choice of an inappropriate reference genome during read mapping can cause misalignments and partially mapped reads, leading to ambiguous base calls and the omission of true mutations from the final consensus sequence [70] [72].
Material and Methods: Best Practices for Prevention and Quality Control
Optimal Nucleic Acid Extraction and Purification
The selection of an extraction method must be tailored to the sample type to maximize yield and minimize co-purification of inhibitors.
- Silica Column-Based Extraction: This method is favored for its speed, simplicity, and ability to yield PCR-ready DNA. The silica membranes bind DNA in the presence of chaotropic salts, allowing for effective purification from contaminants [71]. Kits like the InviSorb Spin Forensic Kit are purpose-built for challenging, low-yield forensic samples [71].
- Magnetic Bead-Based Purification: This technique is robust for high-throughput workflows and effective inhibitor removal through rigorous washing steps [71].
- Specialized Inhibitor Removal Technologies: For samples rich in complex inhibitors like polyphenolics (e.g., from plants or soil), dedicated technologies are required. Kits such as the OneStep PCR Inhibitor Removal Kit employ a unique column matrix that binds these inhibitors without significant nucleic acid loss [69].
Table 1: Recommended DNA Extraction Methods by Sample Type
| Sample Type | Recommended Method | Key Considerations |
|---|---|---|
| Blood & Body Fluids | Silica Column / Magnetic Beads | Remove PCR inhibitors like hemoglobin and immunoglobulins via dedicated purification [71] [69]. |
| Bones & Teeth | Organic Extraction or specialized Silica Kits | Requires decalcification and powerful lysis to access mineralized DNA; protocols designed for fragmented DNA are best [71]. |
| Touch DNA (Trace Evidence) | Silica Column (High-Efficiency) | Ultra-sensitive methods and concentration of eluate are needed; work in contamination-controlled conditions [71]. |
| Plant, Soil, Feces | Kits with dedicated inhibitor removal (e.g., CTAB, OneStep technology) | Efficient removal of polysaccharides, polyphenolics, and humic acids is critical [69]. |
| Inhibitor-Rich Fabric | Silica Column with enhanced wash steps | Remove dyes like indigo that are potent PCR inhibitors [71] [69]. |
Comprehensive DNA Quality Control (QC) Assessment
Rigorous QC of extracted nucleic acids is non-negotiable prior to any downstream application. The following metrics should be assessed.
- Quantification: Use fluorometric methods (e.g., Qubit fluorometer) for accurate DNA mass measurement. Spectrophotometric methods (e.g., NanoDrop) are unreliable for quantifying DNA in the presence of common contaminants like RNA or free nucleotides [1].
- Purity Assessment: Utilize spectrophotometry to determine the presence of contaminants. Acceptable purity ratios are OD 260/280 ~1.8 and OD 260/230 of 2.0–2.2. Significantly lower 260/230 ratios indicate contaminating salts or organics that require additional purification [1].
- Size and Integrity Analysis: For long-read sequencing or assays sensitive to fragmentation, assess DNA integrity using gel electrophoresis (e.g., pulsed-field for HMW DNA) or fragment analyzers (e.g., Agilent Bioanalyzer/TapeStation) [1].
Inhibition Detection and Validation Protocols
- Dilution Test: The simplest method to detect inhibition is to perform a dilution series of the sample. In qPCR, if a 1:10 dilution of the sample results in a lower Ct value (implying more efficient amplification) or significantly higher quantitation, it indicates the presence of PCR inhibitors in the undiluted sample [69].
- Internal Amplification Controls (IACs): Include a known quantity of a non-target control sequence in the PCR reaction. A higher-than-expected Ct value for the IAC signals the presence of inhibitors in the reaction mix [71].
Experimental Workflow for Robust NGS Library Preparation
The following workflow diagram outlines a protocol designed to minimize artifacts from sample to sequence.
Mitigating Targeted Sequencing Artifacts
For amplicon-based sequencing (e.g., for pathogen surveillance):
- Primer Scheme Monitoring: Continuously monitor circulating strains for mutations in primer-binding sites and update primer schemes or employ "spike-in" primers as needed to maintain amplification efficiency [70] [72].
- Reference Genome Suitability: Regularly evaluate and update the reference genome used for mapping to ensure it is phylogenetically close to the samples being sequenced, thus reducing misalignment artifacts [70] [72].
Results and Data Interpretation: Quantitative Guidelines
Adherence to the above protocols yields nucleic acid material that meets stringent quality thresholds for advanced applications. The following tables summarize critical quantitative benchmarks.
Table 2: DNA Quality Control Standards and Interpretation [1]
| QC Metric | Recommended Equipment | Optimal Value / Profile | Indication of Problem |
|---|---|---|---|
| Mass (Quantity) | Qubit Fluorometer | Dependent on application | Over/under-estimation by spectrophotometer |
| Purity (260/280) | NanoDrop Spectrophotometer | ~1.8 | Ratio <1.8: Protein/phenol contamination\nRatio >1.8: RNA contamination |
| Purity (260/230) | NanoDrop Spectrophotometer | 2.0 - 2.2 | Ratio <2.0: Salt, EDTA, or organic contaminant |
| Size/Integrity | Bioanalyzer, Femto Pulse, Gel Electrophoresis | Sharp peak at desired size | Smear or low molecular weight band: Degradation |
Table 3: Recommended DNA Input for Nanopore Ligation Sequencing Kit (SQK-LSK114) [1]
| DNA Fragment Size | Recommended Starting Input (Mass) | Recommended Starting Input (Molarity) |
|---|---|---|
| <10 kb (Short Fragments) | - | 100 - 200 fmol |
| >10 kb (Long Fragments, e.g., gDNA) | 1 µg | - |
The Scientist's Toolkit: Essential Research Reagents and Materials
Table 4: Key Reagent Solutions for Preventing Inhibition and Artifacts
| Item | Function/Application | Example Products / Methods |
|---|---|---|
| Inhibitor Removal Columns | Selective binding and removal of polyphenolics, humic acids, tannins, and melanins from purified DNA/RNA. | OneStep PCR Inhibitor Removal Kit [69]; Components in Quick-DNA Fecal/Soil Microbe Kits [69]. |
| Silica-Membrane Spin Kits | Reliable DNA purification for a wide range of sample types, removing salts, proteins, and other contaminants. | InviSorb Spin Forensic Kit [71]; Other commercial silica kits. |
| Magnetic Bead Kits | High-throughput, automatable purification effective for inhibitor removal. | Various commercial magnetic bead-based nucleic acid extraction kits. |
| High-Fidelity Polymerase | PCR enzyme with proofreading activity to minimize amplification errors during library prep or target enrichment. | Not specified in results, but standard for high-fidelity PCR. |
| Standard Curve qPCR Assay | Accurate DNA quantification and detection of inhibition via dilution series or internal controls. | Methods described in forensic and biotechnology qPCR [73] [74]. |
| Fragment Analyzer | Precise assessment of DNA size distribution and integrity before library preparation. | Agilent 2100 Bioanalyzer, Femto Pulse System [1]. |
Preventing PCR inhibition and sequencing artifacts is an active process that begins at sample collection and extends through data analysis. By adopting a sample-specific extraction strategy, implementing rigorous quality control checkpoints, utilizing specialized inhibitor removal tools, and maintaining updated wet-lab and bioinformatic protocols, researchers can significantly enhance the reliability of their molecular data. The frameworks and protocols detailed herein provide a actionable pathway for scientists in drug development and clinical research to safeguard their experiments against these pervasive technical challenges, thereby ensuring the integrity of their genetic analyses.
Quality Assurance and Validation Frameworks for DNA Analysis
Within the critical workflow of template DNA preparation, comprehensive quality control (QC) is a foundational step that dictates the success of all downstream applications, from basic research to drug development. Incorrectly quantified or contaminated DNA can significantly impact processes such as next-generation sequencing (NGS) and polymerase chain reaction (PCR), leading to unreliable data and compromised results [1]. Establishing rigorous, reproducible QC metrics is therefore essential for research integrity. This application note details a tripartite QC framework focusing on the purity, size, and mass analysis of DNA, providing validated protocols and clear metrics to ensure the integrity of starting material for critical scientific and therapeutic development workflows.
Essential QC Metrics for Template DNA
A robust assessment of template DNA quality rests on three pillars: purity, size, and mass. The following sections break down each metric, their significance, and the standardized methods for their evaluation.
Purity Analysis
Purity analysis ensures that the DNA sample is free from contaminants that can inhibit enzymatic reactions during library preparation or amplification. These contaminants include proteins, organic solvents, salts, and residual extraction reagents [1].
Primary Method: UV-Vis Spectrophotometry This technique measures the absorption of ultraviolet light by a sample. Nucleic acids absorb maximally at 260 nm, proteins at 280 nm, and common contaminants like phenolic compounds or salts at 230 nm [75]. By calculating absorbance ratios, researchers can quickly assess sample purity.
Table 1: Key Absorbance Ratios for DNA Purity Assessment
| Absorbance Ratio | Target Value for Pure DNA | Significance of Deviation |
|---|---|---|
| A260/A280 | ~1.8 [75] [1] | A lower ratio indicates protein or phenol contamination [1]. A higher ratio may suggest RNA contamination [75]. |
| A260/A230 | 2.0 – 2.2 [1] | A ratio significantly lower than 2.0 indicates contamination by salts, guanidine, or ethanol [75] [1]. |
It is important to note that while UV-Vis spectrophotometry is simple and quick, it is non-specific and cannot differentiate between DNA, RNA, and free nucleotides. It is also less reliable for very low or high concentrations [75].
Size Analysis
Determining the size and integrity of DNA fragments is critical for applications like long-read sequencing or cloning, where the goal is to recover high-molecular-weight (HMW) DNA.
Primary Methods: Electrophoretic Techniques
- Gel Electrophoresis: Agarose gel electrophoresis separates DNA molecules based on size, allowing for visual assessment of integrity and the detection of degradation or shearing [75] [1]. Conventional gels are suitable for fragments up to 15–20 kb, while pulsed-field gel electrophoresis is required for larger fragments [1].
- Capillary Electrophoresis (CE): Instruments like the Agilent Bioanalyzer or Femto Pulse System provide high-resolution, automated sizing and quantification. CE is highly accurate and suitable for high-throughput analysis, offering both sizing and quantification data [75] [1]. The Agilent 2100 Bioanalyzer is recommended for fragments <10 kb, while the Femto Pulse System is better suited for fragments >10 kb [1].
Mass Analysis
Accurate quantification of DNA concentration is fundamental to ensure consistency and optimal performance in downstream applications.
Primary Methods: Fluorometry vs. UV-Vis Spectrophotometry
- Fluorometry: This method uses fluorescent dyes (e.g., Qubit dsDNA BR Assay) that bind specifically to double-stranded DNA. It is highly specific and sensitive, reducing interference from contaminants, RNA, or free nucleotides, making it the recommended method for accurate concentration measurement before critical steps like library preparation [75] [1].
- UV-Vis Spectrophotometry: While useful for purity checks, methods like NanoDrop are less reliable for mass determination as they cannot distinguish between DNA, RNA, and free nucleotides, which can lead to overestimation of concentration [75] [1].
Table 2: Comparison of DNA Quantification Methods
| Method | Strengths | Limitations | Ideal Use Case |
|---|---|---|---|
| UV-Vis Spectrophotometry (e.g., NanoDrop) | Simple, quick, provides purity ratios [75]. | Non-specific; inaccuracies from contaminants; not reliable for very high/low concentrations [75]. | Initial, rapid assessment of sample quality and purity. |
| Fluorometry (e.g., Qubit) | Highly specific to nucleic acids; more sensitive than UV-Vis; reduces contaminant interference [75] [1]. | More complex preparation; requires specific dye assays [75]. | Accurate quantification of DNA mass for sensitive downstream applications (e.g., NGS library prep). |
| Capillary Electrophoresis (e.g., Bioanalyzer) | Highly accurate; provides both sizing and quantification; high-throughput [75]. | Expensive; requires specialized instrumentation and expertise [75]. | Precise sizing and quantification of DNA fragments, especially for NGS library QC. |
Detailed Experimental Protocols
Comprehensive QC Workflow for Template DNA
The following integrated protocol ensures a systematic assessment of DNA quality prior to library preparation or other enzymatic steps.
Step-by-Step Protocol
Materials:
- Purified DNA sample
- NanoDrop 2000 Spectrophotometer (or equivalent) [1]
- Qubit Fluorometer and Qubit dsDNA BR Assay Kit [1]
- Agilent 2100 Bioanalyzer and DNA-specific kit (e.g., DNA 12000) [1] or
- Agarose gel electrophoresis system
Procedure:
Purity Assessment via UV-Vis Spectrophotometry
- Blank the spectrophotometer using the same buffer as the DNA sample (e.g., TE buffer) [75].
- Apply 1-2 µL of the DNA sample to the measurement pedestal.
- Record the concentration (ng/µL), A260/A280, and A260/A230 ratios.
- Interpretation: Proceed only if A260/A280 is ~1.8 and A260/A230 is between 2.0–2.2. If not, perform additional purification (e.g., column-based clean-up) and repeat this step [1].
Mass Quantification via Fluorometry
- Prepare the Qubit working solution by diluting the Qubit dsDNA BR reagent in the provided buffer according to the kit protocol.
- Prepare standards and add your DNA samples to separate assay tubes containing the working solution.
- Vortex briefly and incubate at room temperature for 2 minutes.
- Read the tubes in the Qubit Fluorometer and record the concentration.
- Note: For high molecular weight DNA, ensure the sample is homogeneous by gently diluting and rotating in TE buffer. Avoid vortexing or pipetting that can cause shearing [1].
Size and Integrity Assessment Option A: Capillary Electrophoresis (Recommended)
- Follow the manufacturer's protocol for the Agilent Bioanalyzer and the appropriate DNA kit.
- Load the gel-dye mix, wells, ladder, and samples.
- Run the assay and analyze the electrophoregram. A single, sharp peak at the expected size indicates high-quality, intact DNA. A smear or multiple peaks suggest degradation or fragmentation [1]. Option B: Agarose Gel Electrophoresis
- Prepare a low-percentage agarose gel (e.g., 0.8%) in an appropriate buffer.
- Mix the DNA sample with loading dye and load onto the gel alongside a molecular weight ladder.
- Run the gel at an appropriate voltage until sufficient separation is achieved.
- Image the gel. Intact, high-molecular-weight DNA should appear as a tight, high-mass band with minimal smearing downward [1].
The Scientist's Toolkit: Essential Research Reagents and Equipment
A successful QC pipeline relies on specific, validated tools and reagents. The following table details essential items for establishing comprehensive DNA QC metrics.
Table 3: Essential Reagents and Equipment for DNA QC
| Item Name | Function/Application | Key Characteristics |
|---|---|---|
| NanoDrop 2000 Spectrophotometer [1] | Rapid assessment of DNA concentration and purity (A260/A280 & A260/A230 ratios). | Requires small sample volume (1-2 µL); provides quick results for purity screening. |
| Qubit Fluorometer & dsDNA BR Assay [1] | Accurate, specific quantification of double-stranded DNA mass. | Dye is specific to dsDNA; resistant to interference from RNA, salts, and free nucleotides; essential for precise input measurement. |
| Agilent 2100 Bioanalyzer [1] | Automated sizing, quantification, and integrity assessment of DNA fragments. | Provides a digital electrophoregram; high sensitivity; ideal for analyzing NGS libraries and checking genomic DNA integrity. |
| Agilent Femto Pulse System [1] | Analysis of very long DNA fragments (>10 kb). | Capable of resolving high molecular weight DNA; used for verifying fragment size in long-read sequencing workflows. |
| TE Buffer [1] | Storage and dilution buffer for DNA. | Stabilizes DNA for long-term storage; appropriate pH and ionic strength for accurate NanoDrop blanking [75]. |
| RNeasy Mini Kit / Magnetic Bead Kits [76] [77] | Purification of nucleic acids to remove contaminants after extraction. | Silica-based membrane or bead technology removes enzymes, salts, and other impurities that affect purity ratios and downstream efficiency. |
The establishment of rigorous, multi-faceted QC metrics for template DNA is non-negotiable in modern life sciences research and drug development. By systematically evaluating purity, size, and mass using the recommended instruments and protocols, researchers can significantly de-risk their experimental workflows. This structured approach to quality assurance ensures that downstream applications—from qPCR and cloning to cutting-edge sequencing technologies—are built upon a foundation of high-quality, well-characterized genetic material, thereby guaranteeing the reliability, reproducibility, and success of the research.
Meeting FBI Quality Assurance Standards for Forensic DNA Testing
The integrity of forensic DNA analysis is fundamentally dependent on the quality and quantity of the input template DNA. Suboptimal template DNA preparation can compromise downstream analyses, including Short Tandem Repeat (STR) profiling and emerging Next-Generation Sequencing (NGS) applications, leading to potential data loss, inconclusive results, or erroneous interpretations. Adherence to the FBI's Quality Assurance Standards (QAS) is therefore paramount for forensic laboratories to ensure the reliability, accuracy, and reproducibility of their DNA testing procedures.
The recent revision of the FBI QAS, effective July 1, 2025, introduces specific modifications that reflect the evolution of forensic DNA technologies. A significant update accommodates newer methodologies, such as permitting DNA quantification during or after STR amplification when validated, a change that facilitates the use of Rapid DNA technologies and streamlines workflows for certain sample types [78]. This evolving regulatory landscape underscores the need for robust, validated, and well-documented protocols for template DNA preparation and quality control, forming the foundation of all subsequent forensic genetic analyses.
DNA Quality Control (QC) Assessment Methods
A comprehensive DNA QC strategy involves multiple complementary techniques to assess the quantity, purity, and integrity of extracted DNA. This multi-parametric approach is critical for determining a sample's suitability for downstream forensic applications.
Quantitative and Qualitative Assessment Techniques
The following table summarizes the common methods used for DNA QC in forensic and clinical settings:
Table 1: DNA Quality Control Assessment Methods
| Method | Measurement Principle | Parameters Assessed | Key Advantages | Key Limitations |
|---|---|---|---|---|
| Spectrophotometry (e.g., NanoDrop) | UV Light Absorbance [79] | Quantity (via A260), Purity (A260/A280 & A260/A230 ratios) [31] | Fast; requires minimal sample volume | Detects all UV-absorbing substances (e.g., RNA, protein, phenol); not specific for dsDNA [79] |
| Fluorometry (e.g., Qubit, PicoGreen) | Fluorescent dye binding to dsDNA [79] | Accurate dsDNA Quantity [79] [31] | Highly specific for dsDNA; more sensitive than spectrophotometry | Does not assess DNA degradation or provide size information [79] |
| qPCR (TaqMan or SYBR Green) | Amplification efficiency of target sequences [79] | Quantifiable human DNA; Quality assessment via amplification of different sized amplicons [79] | Highly sensitive; human-specific; provides a "degradation score" | More complex and time-consuming than fluorometry or spectrophotometry |
| Automated Electrophoresis (e.g., Bioanalyzer, TapeStation) | Electrokinetic separation and fluorescence detection [79] [31] | DNA Quantity, Integrity (Degradation), and Fragment Size Distribution [31] | Provides direct visual assessment of DNA integrity and size | Higher cost per sample; requires more specialized equipment [79] |
| Gel Electrophoresis | Separation by molecular weight | DNA Integrity and Approximate Quantity [31] | Low-cost; simple to perform | Semi-quantitative; lower resolution; not easily automated |
The Critical Importance of DNA Integrity
For forensic samples, which are often compromised, assessing DNA integrity is as crucial as determining quantity. Degraded DNA, characterized by fragmentation, can lead to preferential amplification of smaller STR alleles and complete dropout of larger ones, creating an imbalanced or partial DNA profile.
Gel electrophoresis or automated electrophoresis systems are used to visualize intact genomic DNA. A high-quality, high-molecular-weight DNA sample will appear as a tight, high-intensity band, whereas a degraded sample will manifest as a smear of lower molecular weight fragments [31]. The Dscore (degradation score) derived from qPCR assays that co-amplify short and long DNA targets provides a quantitative measure of degradation, enabling labs to optimize downstream library preparation for challenging samples [79].
Experimental Protocols for DNA Preparation and QC
Protocol 1: Rapid DNA Template Preparation Using a Potassium Hydroxide-Based Method
This protocol is adapted from a recently published, simple, and cost-effective technique suitable for a wide range of microorganisms and potentially applicable to other biological samples for initial PCR screening [80].
- Principle: Potassium hydroxide (KOH) at high temperature chemically breaks down cell walls and membranes, releasing cellular DNA. The resulting mixture, after centrifugation, provides a crude but effective PCR template.
- Key Advantage: This method avoids complex extraction steps and commercial kits, enabling high-throughput batch processing [80].
Materials & Reagents:
- KOH Solution (0.1 M)
- Thermal block or water bath (100°C)
- Microcentrifuge
- PCR tubes and reagents
- Biological sample (e.g., microbial culture, tissue)
Procedure:
- Cell Lysis: Transfer a small aliquot of the sample (e.g., 10 µL of microbial culture) to a PCR tube. Add an equal volume of 0.1 M KOH. Vortex briefly to mix.
- Heat Treatment: Incubate the tube at 100°C for 10 minutes.
- Centrifugation: Centrifuge the tube at >12,000 × g for 5 minutes. This pellets cell debris.
- Template Collection: Carefully collect the supernatant. This supernatant contains the DNA template and is ready for direct use in PCR.
- PCR Amplification: Use 1-2 µL of the supernatant in a standard 25-50 µL PCR reaction. Optimization of the template volume may be required.
Validation Notes: This technique has been demonstrated to work for bacteria, fungi, and oomycetes, with amplification efficiencies comparable to commercial kits [80]. Forensic validation is required before implementing this method for casework.
Protocol 2: SYBR Green-based qPCR for DNA Quantity and Quality (Dscore)
This protocol, based on research by [79], provides a robust method for simultaneously assessing DNA quantity and quality (degradation), which is critical for NGS library preparation.
- Principle: A duplexed SYBR Green qPCR assay is designed with two sets of primers amplifying targets of different lengths (e.g., a short ≤96 bp amplicon and a longer <190 bp amplicon). The comparison of quantification results from both amplicons yields a degradation score (Dscore).
Materials & Reagents:
- SYBR Green qPCR Master Mix
- Primer sets for short and long amplicons (designed in conserved, stable genomic regions) [79]
- qPCR instrument
- DNA standards (e.g., serially diluted human genomic DNA of known concentration)
- Test DNA samples
Procedure:
- Assay Design: Design and validate primer pairs for a short (~80 bp) and a long (~150-190 bp) amplicon. Ensure specificity and similar amplification efficiency.
- Reaction Setup: Prepare separate qPCR reactions for the short and long amplicons for each standard and unknown sample. Use a final reaction volume of 20-25 µL.
- qPCR Run: Perform qPCR with standard cycling conditions: initial denaturation (95°C for 10 min), followed by 40 cycles of denaturation (95°C for 15 sec) and annealing/extension (60°C for 1 min), concluding with a melt curve analysis.
- Data Analysis:
- Quantity: Determine the DNA concentration (ng/µL) of each unknown sample by interpolating from the standard curve for the short amplicon. This provides the most accurate quantitation for degraded samples.
- Quality/Dscore: Calculate the ratio of the concentration derived from the long amplicon to the concentration derived from the short amplicon (Long Amplicon Conc. / Short Amplicon Conc.). A ratio close to 1 indicates intact DNA, while a lower ratio indicates degradation.
Research Reagent Solutions Toolkit
The following table catalogues essential reagents and kits used in DNA preparation and quality control processes.
Table 2: Essential Research Reagents for DNA Preparation and QC
| Reagent / Kit Name | Primary Function | Key Features / Rationale for Use |
|---|---|---|
| Qiagen Plasmid Kits (QiaPrep) [49] | High-quality plasmid DNA purification | Consistently yields DNA suitable for sequencing; recommended for reliable template preparation [49]. |
| PicoGreen / Qubit dsDNA Assay [79] [31] | Fluorometric dsDNA quantification | High specificity for dsDNA; more accurate than spectrophotometry for assessing functional DNA concentration [79]. |
| SYBR Green qPCR Master Mix [79] | DNA quantification and quality assessment | Enables design of cost-effective, high-throughput qPCR assays for DNA quantity and Dscore calculation [79]. |
| Automated Electrophoresis Kits (e.g., Agilent Bioanalyzer) [79] [31] | DNA integrity and size distribution analysis | Provides objective, high-resolution data on DNA fragmentation, crucial for NGS library QC [31]. |
| Potassium Hydroxide (KOH) [80] | Rapid chemical cell lysis | Key component of simple, rapid, and cost-effective PCR template preparation protocols [80]. |
Workflow Visualization
The following diagram illustrates the logical workflow for template DNA preparation and quality control aligned with forensic standards.
DNA QC Workflow for Forensic Analysis
Rigorous template DNA preparation and quality control are not merely preliminary steps but are integral to the success and reliability of any forensic DNA analysis pipeline. The implementation of the updated 2025 FBI QAS provides a framework for incorporating robust QC measures, including the use of human-specific DNA quantification and quality assessment methods like qPCR-based Dscoring. By adopting a multi-faceted QC strategy that combines fluorometry, qPCR, and integrity analysis, forensic laboratories can confidently characterize their DNA templates, optimize downstream processes for challenging samples, and ultimately ensure the generation of data that meets the highest standards of quality and reliability for judicial proceedings.
The accuracy of molecular biology analyses, particularly in next-generation sequencing (NGS) and polymerase chain reaction (PCR), is fundamentally dependent on the precise quantification and qualification of nucleic acid samples. In the context of template DNA preparation, researchers commonly rely on three principal instrumentation platforms: the Qubit Fluorometer, NanoDrop Spectrophotometer, and Agilent Bioanalyzer systems. Each platform operates on distinct physicochemical principles—fluorescence, ultraviolet (UV) absorbance, and capillary electrophoresis, respectively—offering complementary insights into sample quality and quantity. The strategic implementation of these quality control (QC) tools throughout the experimental workflow is critical for generating reliable, reproducible genomic data, especially when working with challenging sample types such as formalin-fixed paraffin-embedded (FFPE) tissues or plasma-derived nucleic acids [9] [81] [82]. This application note provides a detailed comparative framework and standardized protocols to guide researchers in selecting and implementing the appropriate QC instrumentation for their specific applications.
Comparative Instrument Performance Data
Quantitative Performance Metrics
Table 1: Comparative performance metrics for nucleic acid quantification methods
| Parameter | Qubit Fluorometer | NanoDrop Spectrophotometer | Agilent Bioanalyzer |
|---|---|---|---|
| Principle | Fluorometric dye binding | UV absorbance at 260 nm | Microcapillary electrophoresis |
| Sample Volume | 1-20 µL [33] [82] | 0.5-2 µL [35] | 1-2 µL [83] |
| DNA Sensitivity | dsDNA HS Assay: 0.2-100 ng [33] | ~2-15 ng/µL [35] | Varies by kit; pg-ng level |
| RNA Sensitivity | miRNA assay: accurate at 2 µg/mL [84] | ~1.5 µg/mL total RNA [84] | Varies by kit |
| Selectivity | High; distinguishes dsDNA from RNA [33] [84] | Low; cannot distinguish DNA from RNA [33] | High; separates by size |
| Precision (CV) | 2-5% for DNA assays [84] | ≤2% [35] | Varies by system |
| Key Strength | Specific quantification of target molecules | Rapid purity assessment (A260/280, A260/230) | Size distribution and integrity assessment |
Performance in Challenging Sample Types
Table 2: Instrument performance with degraded or complex samples
| Sample Type | Qubit Performance | NanoDrop Performance | Bioanalyzer Performance |
|---|---|---|---|
| FFPE DNA | Quantifies dsDNA but may overestimate amplifiable template [82] | Overestimates due to ssDNA/RNA contamination [82] | Accurately profiles fragmentation pattern [9] |
| Plasma miRNA | Most reliable quantification (% CV 5.47) [81] | Higher variation (% CV 7.01) and inflated values [81] | Highest variation (% CV 59.21) and frequent detection failures [81] |
| Degraded DNA | Reflects dsDNA content but not amplifiability [82] | Overestimates functional DNA due to contaminants | Visualizes degradation profile effectively |
| Contaminated Samples | Resistant to protein/salt contamination [33] | Sensitive to contaminants; purity ratios indicate issues [33] [35] | Quality indicators for contamination |
Operational Principles and Workflow Integration
Technology Fundamentals
The Qubit Fluorometer employs fluorescent dyes that emit signals only when bound to specific target molecules (dsDNA, RNA, or protein), providing highly specific quantification even in the presence of contaminants [33]. This binding-specific fluorescence enables distinction between dsDNA and single-stranded DNA (ssDNA) or intact versus degraded RNA, making it particularly valuable for assessing sample quality for downstream applications.
The NanoDrop Spectrophotometer utilizes UV absorbance measurements, primarily at 260 nm, where nucleic acids demonstrate peak absorption. While it rapidly assesses concentration and purity through ratios (A260/280 for protein contamination, A260/230 for solvent/organic compound contamination), it cannot distinguish between dsDNA, ssDNA, and RNA, and is sensitive to various contaminants that also absorb at these wavelengths [33] [35].
Agilent Automated Electrophoresis Systems (including the 2100 Bioanalyzer, Fragment Analyzer, and Femto Pulse systems) separate nucleic acids by size using microcapillary or pulsed-field electrophoresis, providing detailed information about size distribution, integrity, and contamination. These systems are particularly valuable for assessing RNA Integrity Numbers (RIN), DNA Integrity Numbers (DIN), and verifying library preparation quality for NGS [83].
Integrated QC Workflow for Template DNA Preparation
The following workflow diagram illustrates a recommended integrated approach for template DNA quality control:
Experimental Protocols
Protocol 1: DNA Quantification Using Qubit Fluorometer
Purpose: Accurate, specific quantification of double-stranded DNA concentration, particularly for dilute or contaminated samples [33] [84].
Materials:
- Qubit Fluorometer (Qubit 4 or Qubit Flex)
- Qubit dsDNA HS Assay Kit or BR Assay Kit
- Qubit assay tubes
- Pipettes and tips
- DNA samples
Procedure:
- Prepare Working Solution: Use the onboard reagent calculator to determine volumes. Prepare 200 µL of working solution per sample by diluting Qubit dsDNA reagent 1:200 in Qubit buffer [33].
- Prepare Standards: Add 190 µL of working solution to each of two assay tubes. Add 10 µL of standard #1 to the first tube and 10 µL of standard #2 to the second tube. Mix by vortexing 2-3 seconds.
- Prepare Samples: Add 198 µL of working solution and 2 µL of sample to each assay tube (for HS assay) or 190 µL working solution and 10 µL sample (for BR assay). Mix by vortexing [82].
- Incubate: Incubate all tubes at room temperature for 2 minutes.
- Read Samples: From the home screen, select "dsDNA" and the appropriate assay. Follow prompts to read standards first, then samples.
- Record Results: Document concentration values. For Qubit Flex, use molarity calculator for downstream NGS normalization if needed [33].
Technical Notes:
- Ensure salt concentration >1 mM in DNA solution for accurate quantification [82].
- For FFPE DNA, note that Qubit measures dsDNA but may not reflect amplifiable template; qPCR may be required for quality assessment [82].
- Use HS assay for samples 0.2-100 ng, BR assay for 2-1000 ng [33] [82].
Protocol 2: Nucleic Acid Quantification and Purity Assessment Using NanoDrop
Purpose: Rapid quantification of nucleic acids and assessment of sample purity through absorbance ratios [35].
Materials:
- NanoDrop Spectrophotometer
- Nucleic acid samples
- Deionized water or TE buffer
- Lint-free wipes
Procedure:
- Initialize Instrument: Open NanoDrop software and select "Nucleic Acid" measurement mode.
- Blank Measurement: Pipet 1-1.5 µL of appropriate blanking solution onto the measurement pedestal. Close the arm and select "Blank" in the software.
- Sample Measurement: Wipe clean with lint-free wipe. Pipet 1-1.5 µL of sample onto the pedestal. Close the arm and measure.
- Record Data: Document concentration (ng/µL), A260/280 ratio, and A260/230 ratio. Acceptable purity ranges: A260/280 ~1.8 for DNA, ~2.0 for RNA; A260/230 >2.0 [35].
- Clean: Wipe pedestal thoroughly between samples.
Technical Notes:
- A260/280 ratios below 1.8 may indicate protein contamination.
- A260/230 ratios below 2.0 may indicate guanidine or phenol contamination.
- Values may be inflated for degraded samples or those with RNA contamination [33] [82].
- Method validation shows linearity with R ≥ 0.9950 and precision ≤2% CV when properly calibrated [35].
Protocol 3: DNA Integrity Analysis Using Agilent Bioanalyzer
Purpose: Assessment of DNA size distribution and integrity for quality control prior to downstream applications [9] [83].
Materials:
- Agilent 2100 Bioanalyzer or Fragment Analyzer system
- Appropriate DNA assay kit (e.g., Genomic DNA ScreenTape, High Sensitivity DNA Kit)
- Chip priming station
- Vortex mixer
- Magnetic spin stand
- Heating block
Procedure:
- Prepare Gel-Dye Mix: Pipet 550 µL of filtered gel into a spin filter. Centrifuge at 2240 × g for 10 minutes. Add 5 µL of dye to the filtered gel, vortex, and centrifuge at 2240 × g for 10 minutes.
- Prime Chip: Pipet 9 µL of gel-dye mix into the well marked with "G" symbol. Position plunger at 1 mL and close chip priming station. Press plunger until held by clip. Wait exactly 30 seconds. Release clip, wait 5 seconds, then slowly pull back plunger to 1 mL position.
- Load Gel-Dye Mix: Pipet remaining gel-dye mix into the other wells marked "G" (total of 3 wells).
- Load Ladder and Samples: Pipet 5 µL of ladder into the well marked ladder. Pipet 5 µL of each sample into sample wells. Pipet 5 µL of marker into all sample and ladder wells.
- Run Analysis: Vortex chip for 1 minute. Place chip in Bioanalyzer and run within 5 minutes.
- Interpret Results: Assess electropherogram for DNA integrity. Intact genomic DNA shows a high molecular weight peak, while degraded DNA shows a smear toward lower molecular weights.
Technical Notes:
- For FFPE samples, expect fragmented profiles; degree of fragmentation correlates with amplification efficiency [9].
- Use Femto Pulse system for low-concentration, high molecular weight DNA with femtogram sensitivity [83].
- Integrate with Qubit data for comprehensive sample assessment.
Application-Specific Method Selection
Decision Pathway for Method Selection
The following diagram provides a guided pathway for selecting the appropriate QC method based on sample type and application requirements:
Specific Application Guidelines
FFPE DNA Samples: Implement the nanoscale QC framework incorporating gel electrophoresis, qPCR, and fluorometric quantification [9]. DNA integrity inversely correlates with amplification efficiency. Enzymatic repair using PreCR repair mix can reduce artifacts and improve amplification of underrepresented genomic sites [9].
NGS Library Preparation: Require multiple QC checkpoints. Use Qubit for accurate quantification of dsDNA, NanoDrop for purity assessment, and Bioanalyzer/Fragment Analyzer for size distribution analysis [33] [83]. For NGS of histopathological samples, Simbolo et al. recommend assessing contaminants with NanoDrop first, then quantifying dsDNA with Qubit [33] [82].
miRNA Analysis from Plasma/Sera: Qubit microRNA assay demonstrates superior performance with least variation (% CV 5.47) compared to NanoDrop (% CV 7.01) and Bioanalyzer (% CV 59.21) [81]. Optimal extraction kits vary by sample type; validate for specific applications.
PCR-Based Applications: For standard PCR with intact DNA, NanoDrop quantification may be sufficient. For quantitative PCR, particularly with degraded templates, use Qubit quantification combined with qPCR amplification efficiency assessment, as Qubit values may not correlate with amplifiable DNA content in degraded samples [82].
Research Reagent Solutions
Table 3: Essential reagents and materials for nucleic acid quality control
| Category | Specific Product/Kit | Application | Key Features |
|---|---|---|---|
| Fluorometric Assays | Qubit dsDNA HS Assay Kit | Quantification of low-abundance dsDNA (0.2-100 ng) | Highly selective for dsDNA, minimal RNA interference [33] [84] |
| Qubit dsDNA BR Assay Kit | Broad-range dsDNA quantification (2-1000 ng) | Optimized for higher concentrations [33] | |
| Qubit microRNA Assay | Specific quantification of microRNA | Accurate detection at 2 µg/mL even with rRNA present [81] [84] | |
| DNA Repair Kits | PreCR Repair Mix (NEB) | Repair of damaged DNA from FFPE tissues | Addresses base damage, deaminated cytosines, improves amplification [9] |
| Extraction Kits | QIAamp DNA FFPE Tissue Kit | DNA extraction from FFPE samples | Optimized for crosslinked, damaged DNA [9] |
| Electrophoresis Kits | Agilent Genomic DNA ScreenTape | DNA integrity analysis | Size distribution assessment for gDNA [82] |
| Agilent High Sensitivity DNA Kit | Analysis of low-concentration DNA | Ideal for NGS library QC [83] | |
| Sample Preparation | Qubit Flex Pyrogen Free Assay Tube Strips | Endotoxin detection | Compatible with Qubit Flex Fluorometer [84] |
The strategic integration of Qubit, NanoDrop, and Bioanalyzer systems provides a comprehensive quality control framework for template DNA preparation. Each platform delivers unique and complementary information: Qubit offers sensitive, specific quantification; NanoDrop provides rapid purity assessment; and Bioanalyzer systems deliver critical size distribution and integrity data. For challenging samples such as FFPE-derived DNA or plasma miRNA, employing multiple QC methods is essential for generating reliable downstream results. The protocols and decision pathways presented herein enable researchers to implement an optimized QC strategy that ensures sample quality while conserving precious materials, ultimately enhancing the reproducibility and accuracy of genomic analyses in both basic research and drug development applications.
Documentation and Proficiency Testing for Regulatory Compliance
Within the broader research on template DNA preparation and quality control methods, ensuring regulatory compliance is not merely an administrative exercise but a fundamental component of scientific rigor. Adherence to established Quality Assurance Standards (QAS) and participation in structured proficiency testing (PT) are critical for validating DNA analysis methods, proving the consistency and accuracy of results, and maintaining credibility with regulatory bodies, collaborators, and the public [85] [86]. This document outlines the current regulatory landscape, details the mechanisms of proficiency testing, and provides standardized protocols to ensure compliance in forensic and research settings, framed within the context of a comprehensive thesis on DNA preparation.
The integrity of DNA analysis in fields such as forensic genetics, clinical diagnostics, and pharmaceutical development is underpinned by a robust quality management framework. This framework is especially critical as new technologies like Rapid DNA analysis are implemented and require standardized guidance [87]. This application note synthesizes the essential elements of this framework, providing researchers and drug development professionals with actionable protocols and a clear path to demonstrating compliance.
Regulatory Framework and Quality Assurance Standards
The cornerstone of forensic DNA analysis in the United States is the FBI's Quality Assurance Standards (QAS). Recently, these standards have been updated, with the 2025 revisions taking effect on July 1, 2025 [87] [86]. These standards apply to both Forensic DNA Testing Laboratories and DNA Databasing Laboratories.
The Scientific Working Group on DNA Analysis Methods (SWGDAM) is instrumental in the development and revision of these standards. Composed of scientists from federal, state, and local forensic DNA laboratories, SWGDAM recommends revisions to the QAS and develops supplementary guidance documents for the community [86]. The key changes in the 2025 QAS include:
- Implementation of Rapid DNA: The revisions provide a plan and clarification for the use of Rapid DNA analysis, both on forensic samples and for qualifying arrestees at booking stations. This is further detailed in supporting documents like the Standards for the Operation of Rapid DNA Booking Systems by Laboratory Agencies [87].
- Ongoing Development: SWGDAM continues to gather feedback for future QAS enhancements through an open survey, indicating that the standards are living documents that evolve with technological and operational needs [86].
Compliance with these standards is a requirement for laboratories participating in the National DNA Index System (NDIS). Furthermore, international quality standards such as ISO/IEC 17025 and ISO 15189 are increasingly relevant for laboratories seeking global credibility and alignment [85].
The Role and Mechanisms of Proficiency Testing
Proficiency Testing (PT) is an essential external quality assessment tool that allows laboratories to verify the precision and accuracy of their testing methods and the efficiency of their processing protocols [85]. Participation in PT schemes is typically mandated by the QAS and other accreditation bodies.
Objectives and Benefits of Proficiency Testing
- Performance Benchmarking: Compare your laboratory's results against those of other laboratories worldwide [85].
- Compliance Demonstration: Fulfill normative requirements for certifications and accreditations such as ISO 17025, ISO 15189, ISO 20387, CLIA, and CAP [85].
- Process Improvement: Identify potential problems in analytical workflows and motivate staff through independent performance assessment [85].
- Credibility Enhancement: Assure customers, funding agencies, and regulatory bodies of the validity of your results, thereby building a reputation for quality [85].
Prominent Proficiency Testing Programs
Several international organizations offer recognized PT schemes for DNA analysis:
- ISBER Biospecimen Proficiency Testing Program: Endorsed by the International Society for Biological and Environmental Repositories (ISBER), this program offers a wide array of testing and processing schemes relevant to DNA workflows [85].
- GEDNAP (German DNA Profiling): One of the largest international PT schemes for forensic DNA labs, with two tests per year and participation from over 200 laboratories across 42 countries [88].
- GHEP-ISFG Proficiency Test: An annual collaborative exercise for DNA polymorphism research that includes both basic (accredited under ISO/IEC 17043:2010) and advanced levels, with modules focusing on kinship and forensic analysis [89].
The following diagram illustrates the typical cyclical workflow of a proficiency testing program, from registration to performance assessment.
Key Proficiency Testing Schemes for DNA Analysis (2025)
Table 1: Selected Proficiency Testing Schemes from the ISBER 2025 Program [85]
| Scheme Name | Code | Fee (EUR, with ISBER discount) |
|---|---|---|
| Testing Schemes | ||
| DNA Quantification and Purity | DNAQ25 | €579 |
| DNA Integrity | DNAI25 | €579 |
| RNA Quantification and Purity | RNAQ25 | €579 |
| Processing Schemes | ||
| DNA Extraction from Whole Blood | DNABLD25 | €359 |
| DNA Extraction from FFPE Material | DNAFFC25 | €359 |
| DNA Extraction from Frozen Tissue | DNAFRT25 | €359 |
| Microbial DNA Extraction from Stool | DNASTL25 | €359 |
| Cell Free DNA Extraction from Whole Blood | cfDNA25 | €359 |
| Dual DNA/RNA Extraction from Frozen Tissue | DUAFRT25 | €359 |
Experimental Protocols for Compliant DNA Preparation and QC
This section provides detailed methodologies for key steps in DNA preparation, emphasizing critical quality control points to ensure regulatory compliance and optimal performance in downstream applications like sequencing.
Protocol: Input DNA Quality Control
1. Principle: Accurately quantifying DNA mass, assessing purity, and determining molecular weight are crucial steps before library preparation. Contaminants or inaccurate quantification can significantly impact sequencing throughput and data reliability [1].
2. Materials and Equipment:
- Fluorometer (e.g., Qubit Fluorometer with Qubit dsDNA BR Assay Kit) for specific DNA mass quantification [1] [11].
- Spectrophotometer (e.g., NanoDrop 2000) for assessing sample purity via absorbance ratios [1].
- Fragment Analyzer (e.g., Agilent 2100 Bioanalyzer, Agilent Femto Pulse System, or equipment for pulsed-field gel electrophoresis) for determining DNA size and integrity [1].
3. Procedure:
3.1. DNA Quantification (Mass)
- Use a fluorometric method (Qubit) for all quantification following clean-up steps. Fluorometers are specific for double-stranded DNA and are not affected by common contaminants like RNA, salts, or solvents, which can interfere with spectrophotometric measurements [1] [11].
- For high-concentration or high molecular weight (HMW) DNA, ensure the sample is homogeneous. Gently rotate the tube in TE buffer; avoid vortexing or pipetting that can cause shearing [1].
3.2. Purity Assessment
- Use a spectrophotometer (NanoDrop) for samples with concentrations >20 ng/µL.
- Measure absorbance at 230, 260, and 280 nm.
- Acceptance Criteria: The A260/A280 ratio should be approximately 1.8. The A260/A230 ratio should be between 2.0 and 2.2 [1] [11].
- Troubleshooting:
- A260/A280 < 1.8: Suggests protein or phenol contamination.
- A260/A280 > 1.8: Suggests RNA contamination.
- A260/A230 < 2.0: Suggests contamination by salts, guanidine, humic acids, or peptides [1].
3.3. Molecular Weight and Integrity Assessment
- For DNA fragments <10 kb, use an Agilent 2100 Bioanalyzer or equivalent.
- For DNA fragments >10 kb (HMW DNA), use pulsed-field gel electrophoresis or the Agilent Femto Pulse System. The Agilent 2100 Bioanalyzer is not suitable for fragments >10 kb [1].
- Visually inspect gels or electropherograms for a tight, high molecular weight band. A smear or low molecular weight band indicates degradation or shearing [1].
4. Quality Control and Data Interpretation:
- Heavily degraded samples or those with significant impurity are not suitable for large-insert library construction and require additional purification [11].
- For sequencing, the ideal starting input depends on fragment size. For the Ligation Sequencing Kit V14, use 100-200 fmol for fragments <10 kb and 1 µg for fragments >10 kb [1].
Protocol: Sample-Specific DNA Extraction
DNA extraction efficiency varies significantly by sample type. The table below outlines common challenges and recommended solutions.
Table 2: DNA Extraction Challenges and Solutions by Sample Type [58]
| Sample Type | Key Challenges | Recommended Solutions & Kits |
|---|---|---|
| Blood & Bodily Fluids | Presence of inhibitors (heme, mucin). | Forceful lysis with digestion. Magnetic bead workflows (e.g., MagMAX DNA Multi-Sample Ultra 2.0) for high throughput and consistency. |
| Tissue Samples | Fibrous, tough cell walls; degradation. | Mechanical homogenization (e.g., Fisherbrand 850 Homogenizer). RNase A treatment to reduce RNA contamination. |
| Buccal/Dry Swabs | High bacterial load, contaminants. | Use two swabs per isolation. Extend lysis incubation. Use magnetic bead methods with optimized inhibitor-removal chemistry. |
| Plant Material | Tough cell walls; polysaccharides & polyphenols. | Use specialized kits with PVP (e.g., GeneJET Plant Genomic DNA Purification Kit, MagMAX Plant DNA Isolation Kit). |
| FFPE Samples | Cross-linking, DNA fragmentation, paraffin. | Automated deparaffinization (e.g., AutoLys M Tubes). Proteinase K digestion. Use kits designed for FFPE (e.g., MagMAX FFPE DNA/RNA Isolation). |
| Stool & Saliva | Complex microbiome, inhibitors. | Use of stabilization media. Flexibility in sample input volume to meet yield requirements. Mechanical homogenization for raw stool. |
The Scientist's Toolkit: Essential Research Reagent Solutions
Table 3: Key Reagents and Kits for DNA Extraction and QC
| Item Name | Function / Application | Specific Example(s) |
|---|---|---|
| Magnetic Bead-Based Kits | High-throughput, automated purification of DNA from various sample types; effective inhibitor removal. | MagMAX DNA Multi-Sample Ultra 2.0 Kit [58] |
| Specialized Plant DNA Kits | Isolate DNA from tough plant cell walls while removing contaminating polysaccharides and polyphenols. | GeneJET Plant Genomic DNA Purification Kit, MagMAX Plant DNA Isolation Kit [58] |
| FFPE DNA/RNA Isolation Kits | Streamlined workflow for challenging FFPE samples, replacing hazardous xylene/ethanol deparaffinization. | MagMAX FFPE DNA/RNA Isolation chemistry [58] |
| Qubit dsDNA BR Assay Kit | Fluorometric quantification of double-stranded DNA mass; highly specific and resistant to common contaminants. | From Thermo Fisher Scientific [1] |
| Agilent 2100 Bioanalyzer Kits | Microfluidic electrophoretic analysis of DNA fragment size and quality for fragments <10 kb. | From Agilent Technologies [1] |
| TE Buffer (Low EDTA) | Long-term storage and dilution of HMW DNA; maintains DNA integrity and prevents shearing. | 10 mM Tris, pH 7.5-8.0, 0.1 mM EDTA [1] [11] |
Adherence to evolving regulatory standards like the 2025 FBI QAS and active participation in internationally recognized proficiency testing programs are non-negotiable for laboratories committed to quality and compliance. Integrating the detailed protocols for DNA quality control and sample-specific extraction outlined in this document provides a solid foundation for generating reliable, reproducible data. As the field advances with technologies like Rapid DNA and more complex sample types, a proactive approach to quality management—combining rigorous internal protocols with external assessment—will remain paramount for success in research, forensic, and drug development applications.
Validation Procedures for Instrument Performance and Analyst Competency
Within the critical framework of template DNA preparation and quality control, the reliability of analytical results is paramount. This reliability rests on two fundamental pillars: the demonstrated performance of analytical instruments and the verified competency of the personnel operating them. Regulatory guidance from bodies like the US Food and Drug Administration (FDA) emphasizes that instrument qualification and analyst competency are not merely regulatory checkboxes but are essential for ensuring data integrity and the validity of scientific conclusions drawn from experimental data [90]. In the context of DNA-related analyses, where results directly impact drug development pipelines and diagnostic applications, a rigorous, documented approach to both instrument and analyst validation is non-negotiable. This document outlines detailed application notes and protocols to establish and maintain this rigor.
Regulatory and Theoretical Framework
Foundational Principles
The overarching principle in regulated laboratories is that "Instruments are qualified, and software is validated" [90]. This distinction is crucial. Instrument Qualification is the process of demonstrating that an instrument is suitable for its intended purpose and that it is properly installed, functions correctly, and continues to perform as expected over time [90] [91]. Computer System Validation (CSV), often required for the software controlling these instruments, focuses on confirming that the software consistently produces results that meet predetermined acceptance criteria, ensuring data are reliable, accurate, and secure [90].
For analyst competency, the key principles are validity and reliability. Validity refers to the relationship between performance on an assessment and performance on the job, ensuring that what is being measured is actually relevant to the task. Reliability refers to the consistency of the assessment scores when the same applicants are reexamined under near-identical conditions [92].
Relevant Guidelines and Standards
Several key guidelines govern these processes:
- USP General Chapter <1058>: Provides the standard approach for Analytical Instrument Qualification (AIQ), outlining the four-stage lifecycle (DQ, IQ, OQ, PQ) [90] [93]. A significant update, proposed in 2025, emphasizes a risk-based lifecycle approach, integrating initial qualification with ongoing performance verification and renaming the chapter to "Analytical Instrument and System Qualification (AISQ)" to reflect a more holistic view [93].
- FDA 21 CFR Part 11 & General Principles of Software Validation: Sets requirements for electronic records and signatures and provides guidance on software validation to ensure regulatory compliance [90].
- ICH Q12: Emphasizes managing post-approval changes through a well-defined quality system, which aligns with the lifecycle approach now advocated for instrumentation [93].
Instrument Performance Validation
The qualification of analytical instruments is a foundational activity in any quality control laboratory. The following sections detail the established and emerging protocols.
The Traditional 4Qs Model of Qualification
The USP <1058> model segments instrument qualification into four sequential stages, providing a structured framework for ensuring instrument fitness [90] [91].
Table 1: Stages of Analytical Instrument Qualification (AIQ) according to the 4Qs Model
| Stage | Description | Key Documentation |
|---|---|---|
| Design Qualification (DQ) | Defines the functional and operational specifications of the instrument based on user requirements. It confirms the instrument's design meets the lab's needs before purchase. | User Requirement Specifications (URS) |
| Installation Qualification (IQ) | Verifies the instrument is received as designed, properly installed in a suitable environment, and meets manufacturer specifications. | Installation checklist, environmental records |
| Operational Qualification (OQ) | Demonstrates the instrument will function according to its operational specifications in the selected environment. | Test scripts against functional specifications |
| Performance Qualification (PQ) | Demonstrates the instrument consistently performs as needed for its actual application in the routine lab environment. | Performance test records using actual methods/protocols |
Evolving Lifecycle and Risk-Based Approaches
The regulatory landscape is evolving from the rigid 4Qs model toward a more integrated, risk-based lifecycle approach [91] [93]. The proposed update to USP <1058> introduces a three-stage lifecycle model that runs from instrument specification to retirement, emphasizing continuous assurance over one-time checks [93]. This approach advocates for a risk assessment to determine the extent of qualification activities, allowing laboratories to focus resources on the most critical systems and parameters [93]. The following workflow diagram illustrates this integrated lifecycle for analytical instrument and system qualification.
Experimental Protocol: Performance Qualification (PQ) for a Spectrophotometer
This protocol provides a detailed methodology for establishing the ongoing performance of a spectrophotometer used for quantifying nucleic acid concentration and purity (A260/A280 ratio).
1.0 Purpose: To verify that the UV-Vis spectrophotometer consistently produces accurate and precise absorbance measurements for DNA analysis within predefined acceptance criteria.
2.0 Scope: This procedure applies to the performance qualification of the [Instrument Model/ID] spectrophotometer used in the Quality Control laboratory for template DNA analysis.
3.0 Materials and Reagents:
- Certified reference standard of Potassium Dichromate (or other applicable NIST-traceable standard)
- DNA standard solutions of known concentration (e.g., λ-DNA)
- Appropriate quartz cuvettes
- Volumetric flasks and pipettes of verified accuracy
4.0 Procedure: 1. Instrument Warm-up: Power on the spectrophotometer and allow it to warm up for the manufacturer-specified time, typically 30 minutes. 2. Wavelength Accuracy Check: - Scan a Holmium Oxide or Didymium filter across the specified range. - Alternatively, measure the absorbance peak of a Potassium Dichromate solution in 0.005M H₂SO₄ at 350 nm. - Acceptance Criteria: The measured peak wavelength must be within ±1 nm of the certified value. 3. Photometric Accuracy Check: - Prepare a Potassium Dichromate solution of known concentration in 0.005M H₂SO₄. - Measure the absorbance at 235, 257, 313, and 350 nm using a defined pathlength cuvette (e.g., 10 mm). - Calculate the measured absorptivity and compare against the certified values. - Acceptance Criteria: Absorptivity values must be within ±1.0% of the certified values. 4. Stray Light Check: - Measure the absorbance of a Potassium Chloride solution (12 g/L) at 198 nm using a 1 cm pathlength quartz cuvette, with water as a blank. - Acceptance Criteria: Absorbance must be greater than 2.0 AU. 5. Method-Specific Performance (for DNA Quantitation): - Measure the absorbance of a DNA standard solution at 260 nm and 280 nm. - Calculate the concentration and the A260/A280 ratio. - Acceptance Criteria: The calculated concentration must be within ±5% of the known value, and the A260/A280 ratio must be 1.8 ± 0.1.
5.0 Documentation: All data, including raw readings, calculations, and a clear statement of pass/fail against each acceptance criterion, must be recorded in the instrument logbook or electronic validation report.
Analyst Competency Validation
Ensuring that personnel are competent to perform specific tasks is as critical as instrument qualification. A structured approach to competency assessment is required.
Core Components of a Competency Assessment System
A robust system for validating analyst competency includes several key elements, which can be effectively managed through a modern Competency Management System (CMS) [94].
Table 2: Core Components of an Analyst Competency Assessment System
| Component | Description | Application in the Laboratory |
|---|---|---|
| Competency Framework | A structured catalog of required skills and knowledge, often with a proficiency scale (e.g., Novice to Master). | Defines core, technical, and compliance-critical competencies for roles like "DNA QC Analyst" [94]. |
| Assessment Engine | Tools and methods for collecting evidence of competency. | Utilizes a mix of method performance tests, direct observation, data review, and theoretical exams [95] [92]. |
| Validation & Reliability | Ensuring assessments are valid (measure relevant skills) and reliable (produce consistent results). | Achieved through job analysis, structured assessment design, and multiple evaluation methods [92]. |
| Progress Tracking | Systems to document and monitor competency achievements and gaps. | Implemented via digital dashboards in a CMS, tracking progress against required competencies [94] [96]. |
Establishing Validity and Reliability
For an analyst competency assessment to be defensible, it must demonstrate both validity and reliability [92].
- Validity can be established by ensuring the assessment's content convincingly matches the tasks of the job (content validity), often defined through a formal job analysis. For predictive validity, a correlation between assessment scores and subsequent job performance can be measured [92].
- Reliability is achieved by minimizing random errors in assessment. This involves standardizing administration, measurement conditions, and scoring procedures to ensure consistent evaluation across different analysts and raters [92].
Research into competency assessments indicates that structured approaches have higher validity. The table below summarizes the predictive validity of various assessment methods.
Table 3: Validity of Common Assessment Methods for Predicting Job Performance (adapted from [92])
| Assessment Method | Validity Coefficient (when used alone) | Key Consideration |
|---|---|---|
| Work Sample Tests | .54 | Highly effective for simulating practical lab tasks. |
| Structured Interviews | .51 | Useful for assessing problem-solving and theoretical knowledge. |
| Job Knowledge Tests | .48 | Validates understanding of underlying principles. |
| Unstructured Interviews | .38 | Less reliable and valid than structured formats. |
| Years of Experience | .18 | A poor standalone predictor of competency. |
Experimental Protocol: Competency Assessment for DNA Quantitation and Purity Analysis
This protocol outlines a structured process for initial competency validation of an analyst for the critical task of DNA analysis using a spectrophotometer.
1.0 Purpose: To objectively demonstrate and document an analyst's competency in performing accurate and precise DNA concentration and purity measurements.
2.0 Scope: Applies to all new analysts or existing analysts being qualified on the DNA quantitation procedure in the QC lab.
3.0 Prerequisites: Successful completion of theoretical training on the principles of UV spectrophotometry and the specific SOP for instrument operation and DNA analysis.
4.0 Assessment Procedure: The assessment is a combination of a structured oral interview and a practical demonstration. 1. Theoretical Knowledge (Structured Oral Interview): - The assessor will ask the analyst to explain the principle of measuring DNA concentration at 260 nm. - The analyst must describe the significance of the A260/A280 ratio and interpret typical values for pure DNA, RNA, and protein contamination. - The analyst must list at least three critical factors that can affect the accuracy of the measurement. 2. Practical Demonstration (Work Sample Test): - Sample Preparation: The analyst will independently prepare a DNA standard solution from a stock of known concentration using correct dilution techniques and volumetric equipment. - Instrument Operation: The analyst will demonstrate proper instrument initialization, blanking, and measurement of the standard and one unknown sample in duplicate. - Data Analysis & Documentation: The analyst will correctly calculate the concentration of the unknown sample and its A260/A280 ratio. They must complete the analysis record according to Good Documentation Practices (GDP). 3. Data Integrity and Troubleshooting: - The assessor will present a hypothetical scenario where the A260/A280 ratio is outside the expected range. The analyst must propose a logical investigation path.
5.0 Scoring and Acceptance Criteria: Competency is achieved when the analyst meets all the following criteria:
- Provides >90% correct answers in the theoretical assessment.
- Performs all practical steps in accordance with the relevant SOPs.
- Calculates the concentration of the unknown sample within ±3% of the expected value.
- Completes all documentation legibly, contemporaneously, and without errors.
The Scientist's Toolkit: Essential Research Reagent Solutions
The following reagents and materials are critical for the experiments and validation procedures described in this document, particularly in the context of DNA preparation and quality control.
Table 4: Essential Research Reagents for DNA Quality Control and Method Validation
| Reagent/Material | Function and Role in Validation |
|---|---|
| Certified Reference Materials (CRMs) | Provides an unbroken chain of traceability to national standards (e.g., NIST). Used for calibration and verification of instrument photometric and wavelength accuracy [91]. |
| Nucleic Acid Standards (e.g., λ-DNA) | Serves as a known, stable control material for method-specific Performance Qualification (PQ) and for assessing analyst competency in DNA quantitation. |
| Spectrophotometric Cuvettes | High-quality quartz cuvettes are essential for accurate UV absorbance measurements. Their pathlength must be verified, as it is a critical parameter in concentration calculations. |
| Enzymes & Buffers for DNA Manipulation | Restriction enzymes, ligases, and PCR master mixes are used in the development of analytical procedures. Their performance must be qualified upon receipt and monitored during use. |
| Holmium Oxide Filters | A solid-state wavelength standard used for the rapid and routine verification of a spectrophotometer's wavelength accuracy, a key parameter during Operational Qualification (OQ). |
Integrated Workflow for DNA QC
Bringing together the validation of instruments and analysts, the following diagram illustrates a holistic workflow for ensuring data integrity in the DNA quality control process, from sample receipt to final authorization.
Conclusion
Robust DNA template preparation and quality control are foundational to success across diverse applications from basic research to clinical diagnostics. Implementing standardized protocols for extraction, rigorous QC verification using multiple metrics, and adherence to established quality assurance frameworks significantly reduces experimental variability. Future directions point toward increased automation to enhance reproducibility, development of specialized methods for challenging sample types, and evolution of quality standards to keep pace with emerging technologies like Rapid DNA analysis. By prioritizing DNA quality at the earliest stages of experimental design, researchers can ensure reliable, reproducible results that accelerate discovery and development in biomedical science.
References
- 1. Input DNA /RNA QC | Oxford Nanopore Technologies [https://nanoporetech.com/document/input-dna-rna-qc]
- 2. Genomic DNA Purification and Assessment [https://www.sigmaaldrich.com/US/en/technical-documents/technical-article/genomics/dna-and-rna-purification/sample-purification-and-quality-assessment?srsltid=AfmBOoq62p7a_4GkcI14-abK2OICGOMHUMkzKSf-LCzloWlGroKz0ZFD]
- 3. How do I determine the concentration, yield and purity of ... [https://www.promega.com/resources/pubhub/enotes/how-do-i-determine-the-concentration-yield-and-purity-of-a-dna-sample/]
- 4. The Nanodrop Spectrophotometer: Quantification Made Easy [https://bitesizebio.com/25329/nanodrop-spectrophotometer-pros-and-cons-2/]
- 5. Rapid quantitative analysis of double-stranded plasmid ... [https://www.nature.com/articles/s41598-025-85132-w]
- 6. PCR-generated DNA templates enable efficient, rapid, and ... [https://www.sciencedirect.com/science/article/abs/pii/S1046202325001811]
- 7. Improving STR typing for low template DNA by abasic-site- ... [https://www.nature.com/articles/s41598-025-19847-1]
- 8. How to Work with Challenging or Limited Genomic ... [https://blog.omni-inc.com/blog/how-to-work-with-challenging-or-limited-genomic-samples-updated-for-2025]
- 9. A nanoscale quality control framework for assessing FFPE ... [https://pubs.rsc.org/en/content/articlehtml/2025/nh/d5nh00176e]
- 10. Determining factors for obtaining DNA profiles in biological ... [https://pubmed.ncbi.nlm.nih.gov/41225186/?utm_source=FeedFetcher&utm_medium=rss&utm_campaign=None&utm_content=0HrvDJDlNuooP-WUj89s4o-KdPalycMDQvjbxTgCWLs&fc=None&ff=20251114171513&v=2.18.0.post22+67771e2]
- 11. DNA Preparation Guidelines - Archive - Department of Energy [https://archive.jgi.doe.gov/user-programs/pmo-overview/project-materials-submission-overview/dna-sample-submission-guidelines/]
- 12. DNA/RNA Sample Preparation and Quality Control [https://www.rockefeller.edu/genomics/sampleprepqc/]
- 13. DNA Source Selection for Downstream Applications Based ... [https://pmc.ncbi.nlm.nih.gov/articles/PMC4991598/]
- 14. Wet Lab Protocols Matter: Choice of DNA Extraction and ... [https://pmc.ncbi.nlm.nih.gov/articles/PMC12550470/]
- 15. Functional Characterization and a Real-World Clinical ... [https://pubmed.ncbi.nlm.nih.gov/41197083/]
- 16. Best Practices for Quantification of Residual Host Cell DNA ... [https://www.biopharminternational.com/view/best-practices-for-quantification-of-residual-host-cell-dna-with-real-time-pcr]
- 17. Recent Progress in DNA-Based Approaches for ... [https://www.sciencedirect.com/science/article/abs/pii/S2214786125000439]
- 18. Preparing Single-Stranded DNA Templates [https://www.thermofisher.com/us/en/home/life-science/dna-rna-purification-analysis/napamisc/capture-of-biotinylated-targets/preparing-single-stranded-dna-templates.html]
- 19. Best practices for DNA template preparation towards ... [https://www.nist.gov/publications/best-practices-dna-template-preparation-towards-improved-reproducibility-cell-free]
- 20. Cell-Free Protein Synthesis Reactor Formats [https://www.mdpi.com/2674-0583/3/3/10]
- 21. Effective Use of Linear DNA in Cell-Free Expression Systems [https://pmc.ncbi.nlm.nih.gov/articles/PMC8329657/]
- 22. Nondestructive automated DNA extraction method from the ... [https://www.sciencedirect.com/science/article/pii/S0379073825002580]
- 23. High-Throughput DNA Extraction Using Robotic ... [https://www.mdpi.com/2223-7747/14/15/2263]
- 24. A rapid and high-yield method for nucleic acid extraction [https://www.nature.com/articles/s41598-025-95226-0]
- 25. Optimization and comparison of genomic DNA extraction ... [https://pubmed.ncbi.nlm.nih.gov/41109964/]
- 26. Best Practices for DNA Template Preparation Toward ... [https://pubmed.ncbi.nlm.nih.gov/34985735/]
- 27. Forensic DNA Recovery from FFPE Tissue Using the ... [https://pmc.ncbi.nlm.nih.gov/articles/PMC12469798/]
- 28. How DNA Purification Works — In One Simple Flow (2025) [https://www.linkedin.com/pulse/how-dna-purification-works-one-simple-flow-2025-bnoye]
- 29. Optimization for Sequencing and Analysis of Degraded ... [https://pmc.ncbi.nlm.nih.gov/articles/PMC8815082/]
- 30. How-to: NGS Quality Control [https://frontlinegenomics.com/how-to-ngs-quality-control/]
- 31. Why quality control (QC) is performed for NGS testing [https://3billion.io/blog/why-quality-control-qc-is-performed-for-ngs-testing]
- 32. Performance of Spectrophotometric and Fluorometric DNA ... [https://www.mdpi.com/2673-4532/3/3/25]
- 33. Qubit Fluorometric Quantification System Features [https://www.thermofisher.com/us/en/home/industrial/spectroscopy-elemental-isotope-analysis/molecular-spectroscopy/fluorometers/qubit/features.html]
- 34. Spectrophotometric measurement of DNA concentration [https://www.qiagen.com/us/knowledge-and-support/knowledge-hub/bench-guide/dna/analysing-dna/spectrophotometric-measurement-of-dna-concentration]
- 35. Quantification of DNA through the NanoDrop Spectrophotometer [https://pmc.ncbi.nlm.nih.gov/articles/PMC7719535/]
- 36. Comparison of Fluorometric and UV Spectrophotometric ... [https://pmc.ncbi.nlm.nih.gov/articles/PMC8672151/]
- 37. Comparison of fluorometric and spectrophotometric DNA ... [https://www.sciencedirect.com/science/article/abs/pii/S0956713508001837]
- 38. Comparison of Fluorometric and Spectrophotometric DNA ... [https://www.nist.gov/publications/comparison-fluorometric-and-spectrophotometric-dna-quantification-real-time]
- 39. DNA Quantification using the Qubit Fluorometer [https://www.protocols.io/view/dna-quantification-using-the-qubit-fluorometer-bi8dkhs6]
- 40. Preserving biological specimens for DNA analysis just got easier [https://news.northeastern.edu/2025/10/14/dna-preservation-breakthrough-sample-storage/]
- 41. Statistical design approach enables optimised mechanical ... [https://www.nature.com/articles/s41598-024-80584-y]
- 42. Comparative pilot study of three commercial kits for ... [https://pmc.ncbi.nlm.nih.gov/articles/PMC12372513/]
- 43. Comparison of rapid bacterial separation techniques from ... [https://link.springer.com/article/10.1007/s44411-025-00257-8]
- 44. DNA Specimen Preservation Using DESS and DNA Extraction ... [https://pmc.ncbi.nlm.nih.gov/articles/PMC12189647/]
- 45. Long-Term DNA Storage of Challenging Forensic ... [https://www.mdpi.com/2673-8856/5/2/29]
- 46. Comparative evaluation of DNA extraction protocols for ... [https://www.sciencedirect.com/science/article/pii/S2950194625001669]
- 47. PCR Setup—Six Critical Components to Consider [https://www.thermofisher.com/us/en/home/life-science/cloning/cloning-learning-center/invitrogen-school-of-molecular-biology/pcr-education/pcr-reagents-enzymes/pcr-component-considerations.html]
- 48. Development of real-time PCR methods for quality control ... [https://pmc.ncbi.nlm.nih.gov/articles/PMC12058689/]
- 49. Plasmid DNA template preparation | Yale Research [https://research.yale.edu/plasmid-dna-template-preparation]
- 50. Sample Preparation for NGS – A Comprehensive Guide [https://frontlinegenomics.com/sample-preparation-for-ngs-a-comprehensive-guide/]
- 51. Plasmid Prep Protocols: Guide to Key Steps & Materials [https://www.thermofisher.com/blog/life-in-the-lab/plasmid-prep-protocol-guide-to-key-steps-and-materials/]
- 52. 11 Reasons Why Your Plasmid Yield is Low & Easy Fixes [https://bitesizebio.com/13514/boost-plasmid-yield/]
- 53. Principles and Troubleshooting of Plasmid Extraction - Yeasen [https://www.yeasenbio.com/blogs/molecular-biology/principles-and-troubleshooting-of-plasmid-extraction]
- 54. A universal, high-quality, and high-yield DNA purification ... [https://pmc.ncbi.nlm.nih.gov/articles/PMC12584714/]
- 55. An overview of DNA degradation and its implications in ... [https://ejfs.springeropen.com/articles/10.1186/s41935-024-00389-y]
- 56. Analysis of Human Degraded DNA in Forensic Genetics [https://www.mdpi.com/2073-4425/16/11/1375]
- 57. DNA Degradation - an overview [https://www.sciencedirect.com/topics/biochemistry-genetics-and-molecular-biology/dna-degradation]
- 58. DNA Extraction Guide: Mastering 7 Essential Sample Types [https://www.thermofisher.com/blog/life-in-the-lab/dna-extraction-guide-mastering-7-essential-sample-types/]
- 59. Effective use of the degradation index from human DNA ... [https://www.sciencedirect.com/science/article/pii/S187249732500122X]
- 60. Comparative evaluation of various DNA extraction methods ... [https://pmc.ncbi.nlm.nih.gov/articles/PMC11748555/]
- 61. Clean up your act: DNA and RNA purity [https://www.bioecho.com/blog/clean-up-your-act-dna-and-rna-purity]
- 62. what is the function of edta in dna extraction [https://www.irochelating.com/news/what-is-the-function-of-edta-in-dna-extraction.html]
- 63. DNA, RNA, and Protein Extraction: The Past and The Present [https://pmc.ncbi.nlm.nih.gov/articles/PMC2789530/]
- 64. DNA Purification | DNA Extraction Methods [https://www.promega.com/resources/guides/nucleic-acid-analysis/dna-purification/]
- 65. High Performance DNA Purification using a Novel Ion ... - PMC [https://pmc.ncbi.nlm.nih.gov/articles/PMC2563929/]
- 66. I bound an 11 kb DNA fragment to a QIAquick column [https://www.qiagen.com/us/resources/faq/756]
- 67. Essential Tips for PCR & DNA Cleanup: Maximize Your ... [https://www.neb.com/en-us/nebinspired-blog/essential-tips-for-pcr-and-dna-cleanup-maximize-your-dna-purity-and-yield?srsltid=AfmBOoof6L89hwOYf3K1rwexViuG3IK9Sf2qYCZdXSZ-oRUeHz8-j9iY]
- 68. Comparison and Optimization of DNA Extraction Methods ... [https://www.mdpi.com/2036-7503/17/2/30]
- 69. What Are PCR ? | ZYMO RESEARCH Inhibitors [https://www.zymoresearch.com/blogs/blog/what-are-pcr-inhibitors]
- 70. SARS-CoV-2 sequencing artifacts associated with targeted ... [https://journals.plos.org/plosone/article?id=10.1371/journal.pone.0334009]
- 71. Optimizing Forensic DNA : Best Practices for Trace and... Extraction [https://blog.invitek.com/articles/lifescience/optimizing-forensic-dna-extraction-best-practices-for-trace-and-degraded-evidence]
- 72. SARS-CoV-2 sequencing artifacts associated with targeted ... [https://pmc.ncbi.nlm.nih.gov/articles/PMC12530606/]
- 73. Using Standard to Estimate Curve Quantity - Forensic Focus #4 DNA [https://www.thermofisher.com/blog/behindthebench/using-standard-curve-to-estimate-dna-quantity-forensic-focus-4/]
- 74. Influence of DNA , extraction and... methods PCR inhibitors [https://pubmed.ncbi.nlm.nih.gov/19789856/]
- 75. A Guide to DNA and RNA Quantification and... | Technology Networks [https://www.technologynetworks.com/genomics/articles/a-guide-to-dna-and-rna-quantification-and-quality-392900]
- 76. Quantitative Real-Time PCR (qRT-PCR): 3K-SNCA cells [https://www.protocols.io/view/protocol-quantitative-real-time-pcr-qrt-pcr-3k-snc-hcieb2ubf.html]
- 77. and RNA Extraction and DNA | Thermo Fisher Scientific - RU Analysis [https://www.thermofisher.com/ru/ru/home/life-science/dna-rna-purification-analysis.html]
- 78. What's New in the 2025 FBI Quality Assurance Standards? Notes ... [https://www.dnaidservices.com/blog/from-the-makeshift-desk-my-thoughts-on-the-2025-swgdam-qas]
- 79. Development of a robust DNA quality and quantity ... [https://pmc.ncbi.nlm.nih.gov/articles/PMC5021246/]
- 80. A simple and rapid technique of template preparation for PCR [https://pmc.ncbi.nlm.nih.gov/articles/PMC9686307/]
- 81. Comparison of methods for miRNA isolation and ... [https://pmc.ncbi.nlm.nih.gov/articles/PMC6972740/]
- 82. Pitfalls of DNA Quantification Using DNA-Binding ... [https://pmc.ncbi.nlm.nih.gov/articles/PMC4777359/]
- 83. mRNA [https://www.agilent.com/en/product/automated-electrophoresis/paths-to-ngs-mrna?srsltid=AfmBOooINSebkX61KWrNBChommvNd7PSiPatXpGhghRdvubc_5p1w45i]
- 84. Qubit Fluorometric Quantification System Sample Data [https://www.thermofisher.com/us/en/home/industrial/spectroscopy-elemental-isotope-analysis/molecular-spectroscopy/fluorometers/qubit/sample-data.html]
- 85. Proficiency Testing General Information [https://www.isber.org/page/PTGI/Proficiency-Testing-General-Information.htm]
- 86. HOME [https://www.swgdam.org/#!faq/cqu4]
- 87. 2025 FBI Quality Assurance Standards [https://a2la.org/2025-fbi-quality-assurance-standards/]
- 88. GEDNAP – Proficiency Tests for forensic DNA labs » GEDNAP ... [https://www.gednap.org/]
- 89. Proficiency Tests & Challenges [https://ghep-isfg.org/en/proficiency/]
- 90. Instrument Qualification and Software Validation Are ... [https://www.labmanager.com/instrument-qualification-and-software-validation-are-critical-compliance-steps-33450]
- 91. Analytical Instrument Qualification and System Validation [https://www.gmp-journal.com/current-articles/details/analytical-instrument-qualification-and-system-validation.html]
- 92. Designing an Assessment Strategy [https://www.opm.gov/policy-data-oversight/assessment-and-selection/assessment-strategy/]
- 93. Proposed Update to USP <1058> on Analytical Instrument ... [https://www.lachmanconsultants.com/2025/04/proposed-update-to-usp-on-analytical-instrument-qualification/]
- 94. Competency Management Systems: 2025 Implementation Guide [https://www.eleapsoftware.com/competency-management-systems-2025-implementation-guide/]
- 95. How can organizations ensure the validity and reliability of ... [https://vorecol.com/blogs/blog-how-can-organizations-ensure-the-validity-and-reliability-of-competency-evaluation-tools-14399]
- 96. Competency Based Learning & Assessment (Complete ... [https://www.verifyed.io/blog/competency-learning-assessment-guide]