Supertree vs. Supermatrix Methods for Prokaryotic Phylogeny: A Comprehensive Guide for Biomedical Research
The reconstruction of accurate prokaryotic phylogenies is fundamental for understanding microbial evolution, tracing pathogen outbreaks, and identifying new drug targets.
Supertree vs. Supermatrix Methods for Prokaryotic Phylogeny: A Comprehensive Guide for Biomedical Research
Abstract
The reconstruction of accurate prokaryotic phylogenies is fundamental for understanding microbial evolution, tracing pathogen outbreaks, and identifying new drug targets. This article provides a systematic comparison of two primary phylogenetic approaches: the supertree method, which combines pre-calculated gene trees, and the supermatrix method (combined analysis), which concatenates multiple sequence alignments. We explore the foundational principles, methodological workflows, and specific applications of both strategies for analyzing prokaryotic genomes, which are often complicated by horizontal gene transfer. Drawing on current literature and simulation studies, we evaluate their relative performance in accuracy, computational efficiency, and robustness to systematic error. This guide is tailored for researchers and drug development professionals seeking to select and optimize phylogenetic methods for genomic studies, pathogen evolution tracking, and the discovery of novel antimicrobial agents.
The Foundations of Prokaryotic Phylogeny: Why Genomic Data Poses Unique Challenges
The Shift from Phenotype to Genotype in Prokaryotic Classification
The classification of prokaryotes has undergone a profound transformation, shifting from a foundation based on observable phenotypic characteristics to one rooted in genomic data. This paradigm shift has moved microbial taxonomy from a system heavily reliant on morphological, biochemical, and physiological traits to one that utilizes conserved, information-bearing macromolecules to reveal evolutionary relationships [1]. The early classification system, exemplified by Bergey's Manual of Determinative Bacteriology, initially categorized bacteria into nested hierarchical classifications based on keys and tables of distinguishing characteristics [1]. However, phenotypic properties provided little insight into deep evolutionary relationships, creating a classification impasse that persisted for decades [1].
The breakthrough came with the recognition that informational macromolecules could act as molecular clocks, inspired by the work of Zuckerkandl and Pauling [1]. Carl Woese's pioneering use of small subunit ribosomal RNA (16S/18S rRNA) as a molecular chronometer provided the first objective evolutionary framework across the tree of life, leading to the revolutionary discovery of Archaea as a distinct domain [1]. The 16S rRNA gene became instrumental not only in revealing deep phylogenetic relationships but also in highlighting the enormous microbial diversity missed by traditional culturing methods [1]. We now stand at a turning point where genome sequences form the basis of a robust phylogenetic framework, enabling a comprehensive classification of prokaryotes that reflects their evolutionary history with unprecedented resolution [1].
Methodological Framework: Supermatrix vs. Supertree Approaches
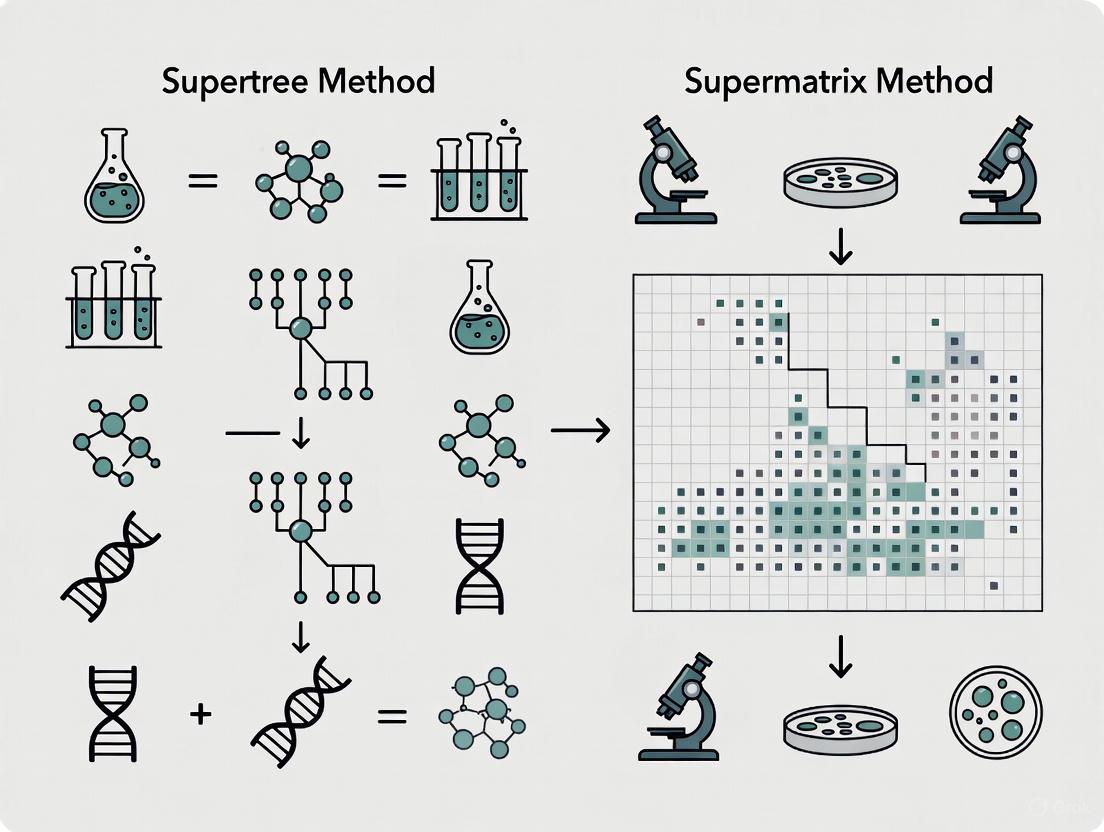
In the genomic era, two primary computational approaches have emerged for reconstructing evolutionary relationships from large gene collections: the supermatrix (SM) and supertree (ST) methods [2]. Both represent distinct philosophical and methodological frameworks for handling the complex data generated by modern genomics.
The supermatrix approach, also known as the concatenation approach, involves combining multiple gene sequences into a single aligned data matrix [3]. This method reduces stochastic errors by combining weak phylogenetic signals from different genes, effectively generating a large, unified dataset for phylogenetic analysis [2]. The supermatrix method typically employs heuristic tree searches on the combined dataset, often producing significantly shorter trees under the parsimony criterion compared to supertree approaches [4].
The supertree approach takes a different strategy, first inferring phylogenetic trees from individual genes and then deriving an optimal consensus tree from these individual phylogenies [3] [2]. This method prevents the combination of genes with incompatible phylogenetic histories and can be easily parallelized in practice, requiring less memory than the supermatrix approach [2]. However, supertree methods can suffer from limitations including the misinterpretation of secondary phylogenetic signals and unclear logical basis for node robustness measures [3].
Table 1: Comparison of Supermatrix and Supertree Methodological Approaches
| Feature | Supermatrix (SM) | Supertree (ST) |
|---|---|---|
| Data Handling | Concatenates genes into single alignment | Analyzes genes separately then combines trees |
| Computational Demand | Higher memory requirements | Lower memory needs, easily parallelized |
| Handling Conflicting Signals | May combine genes with incompatible histories | Prevents combination of incompatible phylogenetic histories |
| Primary Advantage | Reduces stochastic errors by combining weak signals | Does not require all genes to be present in every genome |
| Typical Tree Search Method | Heuristic search on combined dataset (e.g., TNT) | Consensus tree from individual gene trees |
| Reported Tree Length | Significantly shorter trees under parsimony criterion [4] | Longer trees under parsimony criterion [4] |
Experimental Comparisons: Performance and Accuracy Metrics
Several empirical studies have directly compared the performance of supermatrix and supertree methods using both simulated and organismal datasets. These comparisons have evaluated multiple criteria including topological accuracy, computational efficiency, and sensitivity to different phylogenetic methods.
In one significant study using twenty multilocus datasets, supermatrix searches produced significantly shorter trees than either supertree approach (SuperFine or SuperTriplets; p < 0.0002 in both cases) when using the parsimony criterion [4]. Moreover, the processing time of supermatrix search was significantly lower than SuperFine combined with locus-specific search (p < 0.01) but roughly equivalent to that of SuperTriplets with locus-specific search (p > 0.4, not significant) [4]. This research concluded that for real organismal data rather than simulated data, there was no basis in either time tractability or tree length for using supertrees over heuristic tree search with a supermatrix for phylogenomics [4].
The SuperTRI approach, a supertree method that incorporates branch support analyses of independent datasets, has shown less sensitivity to different phylogenetic methods (Bayesian inference, maximum likelihood, and unweighted and weighted maximum parsimony) compared to supermatrix approaches [3]. This method assesses node reliability using three measures: the supertree Bootstrap percentage, mean branch support from separate analyses, and a reproducibility index [3]. When applied to a data matrix including seven genes for 82 taxa of the family Bovidae, SuperTRI proved more accurate for interpreting relationships among taxa and provided insights into introgression and radiation phenomena [3].
Table 2: Performance Comparison of Supermatrix vs. Supertree Methods
| Performance Metric | Supermatrix | Supertree | Research Context |
|---|---|---|---|
| Tree Length (Parsimony) | Significantly shorter [4] | Longer [4] | 20 multilocus datasets |
| Computational Time | Significantly faster than SuperFine [4] | Slower (SuperFine) [4] | Real organismal data |
| Method Sensitivity | Higher sensitivity to phylogenetic methods [3] | Lower sensitivity (SuperTRI) [3] | Bovidae family (82 taxa, 7 genes) |
| Handling Incomplete Data | Requires complete data or imputation | Naturally handles missing data [2] | Prokaryotic phylogenomics |
| Topological Accuracy | High with dominant species-tree signal [3] | More accurate with conflicting signals (SuperTRI) [3] | Simulation and empirical studies |
Experimental Protocols and Workflows
Core Gene Identification and Alignment (EasyCGTree Pipeline)
The EasyCGTree pipeline provides a standardized workflow for prokaryotic phylogenomic analysis based on core gene sets [2]. The protocol begins with input preparation, requiring FASTA or multi-FASTA-formatted amino acid sequences from prokaryotic genomes as input [2]. The pipeline then performs gene calling using profile hidden Markov models (HMMs) of core gene sets, with several pre-prepared HMM databases available including bac120 (120 ubiquitous bacterial genes), ar122 (122 archaeal genes), UBCG (92 up-to-date bacterial core genes), and essential (107 essential single-copy bacterial core genes) [2].
Homolog searching is conducted using hmmsearch from the HMMER package with a default E-value threshold of 1e-10 [2]. The top hit for each gene is screened based on the E-value threshold, followed by filtration to exclude genomes with insufficient detected genes and genes with low prevalence [2]. Multiple sequence alignment is then performed using MUSCLE (Windows) or Clustal Omega (Linux), followed by alignment trimming using trimAl with automatic methods (gappyout, strict, or strictplus) for conserved segment selection [2].
Supermatrix Construction and Analysis
For supermatrix inference, the EasyCGTree pipeline generates a concatenation of each trimmed alignment, which is then used to reconstruct a maximum-likelihood phylogeny using either FastTree or IQ-TREE [2]. FastTree is recommended for initial analysis due to its faster speed and lower memory requirements, while IQ-TREE is preferred for accuracy when computational resources permit [2]. The supermatrix approach allows the combination of weak phylogenetic signals from different genes, reducing stochastic errors through concatenation [2].
Supertree Construction Methods
For supertree construction, EasyCGTree employs wASTRAL to derive an optimal tree from individual gene trees [2]. This approach does not require all genes to be present in every genome, making it particularly suitable for datasets with uneven gene representation [2]. The supertree method prevents the combination of genes with incompatible phylogenetic histories, which is valuable when analyzing genomes with different evolutionary histories due to horizontal gene transfer [2].
Alternative supertree methods like the BUILD algorithm, used by the Open Tree of Life (OToL) project, determine compatibility of different phylogenetic groupings through iterative assessment [5]. The BUILD algorithm is a recursive approach that determines if a set of rooted triplets or splits are jointly compatible by creating cluster graphs at each recursive level [5]. Recent optimizations include an incrementalized version (BuildInc) that shares work between successive calls, providing up to 550-fold speedup for supertree algorithms [5].
Table 3: Essential Research Reagents and Computational Tools for Prokaryotic Phylogenomics
| Tool/Resource | Type | Function | Application Context |
|---|---|---|---|
| EasyCGTree [2] | Software Pipeline | Infers genome-scale maximum-likelihood phylogenetic trees using SM and ST | User-friendly, cross-platform prokaryotic phylogenomics |
| HMMER [2] | Software Package | Homolog searching using profile hidden Markov models | Identifying core genes in genomic datasets |
| IQ-TREE [2] | Phylogenetic Software | Maximum-likelihood tree inference | High-accuracy phylogeny reconstruction from supermatrix |
| FastTree [2] | Phylogenetic Software | Approximately maximum-likelihood tree inference | Rapid phylogeny reconstruction for large datasets |
| trimAl [2] | Alignment Tool | Automated alignment trimming and conserved segment selection | Preprocessing alignments for phylogenetic analysis |
| wASTRAL [2] | Supertree Software | Consensus tree construction from individual gene trees | Supertree inference in EasyCGTree pipeline |
| Bac120/Ar122 [2] | HMM Profile Database | Core gene sets for Bacteria and Archaea | Phylogenomic analysis across prokaryotic domains |
| UBCG [2] | HMM Profile Database | 92 up-to-date bacterial core genes | Standardized bacterial phylogenomics |
| BUILD/BuildInc [5] | Algorithm | Determines compatibility of phylogenetic groupings | Supertree construction in Open Tree of Life project |
Implications for Drug Discovery and Biomedical Research
The shift to genotype-based prokaryotic classification has profound implications for drug discovery and biomedical research. Genomic approaches enable the identification and targeting of specific microbial pathogens with unprecedented precision, facilitating the development of highly specific therapeutic agents [6]. phage display technology, which allows the selection of peptides that bind to biologically relevant sites on target proteins, has become a powerful tool for identifying receptor agonists and antagonists [6] [7].
Membrane receptors, which comprise more than 60% of drug targets, are particularly amenable to phage display approaches [6]. The technique enables the screening of combinatorial peptide libraries against membrane receptors to discover novel pharmacologically active compounds, even without previous knowledge of the target structure [6]. Peptides derived from phage display screenings often modulate target protein activity and can serve as lead compounds in drug design [6]. Furthermore, the identification of tumor antigens through phage display has advanced cancer diagnosis and therapeutic targeting [7].
Antibody phage display has revolutionized antibody drug discovery, enabling the rapid selection and evolution of human antibodies for therapeutic applications [7]. This approach has led to the development of fully human antibodies like adalimumab, which achieved annual sales exceeding $1 billion, demonstrating the commercial and therapeutic impact of these technologies [7]. The combination of precise prokaryotic classification and targeted therapeutic development represents a powerful synergy for addressing microbial pathogenesis and other disease processes.
The shift from phenotype to genotype in prokaryotic classification has fundamentally transformed microbial taxonomy, enabling a comprehensive evolutionary framework that reflects the true relationships between organisms. Both supermatrix and supertree approaches offer distinct advantages for different research contexts, with supermatrix methods generally providing greater computational efficiency and supertree approaches offering better handling of conflicting phylogenetic signals and incomplete datasets.
For researchers and drug development professionals, the choice between these methods should be guided by specific research questions, data characteristics, and computational resources. Supermatrix approaches may be preferable for standardized analyses with complete datasets, while supertree methods offer flexibility for integrating diverse data types and handling genomic complexity. As computational methods continue to advance, particularly with optimized algorithms like BuildInc providing orders-of-magnitude speed improvements, the integration of these approaches will likely yield even more powerful tools for unraveling prokaryotic evolutionary history and leveraging this knowledge for therapeutic development.
Horizontal Gene Transfer (HGT), the non-vertical transmission of genetic material between organisms, presents a fundamental challenge to accurate phylogenetic tree reconstruction, particularly in prokaryotes. Unlike vertical inheritance, which follows a tree-like pattern of descent, HGT creates complex networks of evolutionary relationships that can obscure the true evolutionary history of species. When significant HGT occurs between lineages, different genomic regions can exhibit conflicting phylogenetic histories, making it difficult to infer a single, representative species tree. This challenge is especially acute in microbiology, where HGT is pervasive and serves as a major mechanism for niche adaptation and phenotypic innovation, such as the acquisition of antibiotic resistance and pathogenicity determinants [8]. Consequently, phylogenetic methods must effectively reconcile these conflicting signals to produce accurate evolutionary frameworks.
The two predominant approaches for large-scale phylogenetic inference—supertree (ST) and supermatrix (SM) methods—differ fundamentally in how they handle data and, by extension, how they cope with the discordance caused by HGT. The supermatrix approach concatenates multiple gene alignments into a single large matrix from which a phylogeny is inferred, effectively combining weak phylogenetic signals across genes. In contrast, the supertree approach first infers trees from individual genes or data sets and then combines these source trees into a consensus supertree [3] [2]. This critical difference in methodology leads to varying performance and suitability when facing data sets characterized by extensive HGT.
Performance Comparison: How Supertree and Supermatrix Methods Handle HGT
Theoretical and empirical studies reveal distinct performance characteristics for supertree and supermatrix methods under conditions of gene tree discordance, including that caused by HGT. The table below summarizes the key attributes of each approach relevant to managing HGT-induced conflict.
Table 1: Comparative Performance of Supertree and Supermatrix Methods in the Context of HGT
| Feature | Supertree (ST) Methods | Supermatrix (SM) Methods |
|---|---|---|
| Core Approach | Combines independent gene trees into a consensus species tree [2]. | Concatenates gene alignments into a single matrix before tree inference [2]. |
| Handling Gene Discordance | Does not force a single history on all genes; can reveal conflicting signals [3]. | Assumes a dominant, single tree signal for all concatenated genes [3]. |
| Theoretical Robustness | Quartet-based methods (e.g., ASTRAL) are statistically consistent under both ILS and bounded HGT models [9]. | Concatenation can be inconsistent under multi-species coalescent models with ILS; less robust to high HGT rates [9]. |
| Key Advantage | Prevents combining genes with incompatible phylogenetic histories [2]. | Reduces stochastic errors by combining weak phylogenetic signals [2]. |
| Key Limitation | Early methods often ignored secondary phylogenetic signals [3]. | Can be misleading if the species-tree signal is not dominant after data combination [3]. |
| Computational Memory | Generally requires less memory than SM approaches [2]. | Often requires more memory, especially with large concatenated alignments [2]. |
A significant theoretical advantage of some modern supertree methods, particularly quartet-based approaches like ASTRAL, is their proven statistical consistency not only under the Multi-Species Coalescent (MSC) model of Incomplete Lineage Sorting (ILS) but also under models of phylogenomics that include bounded amounts of HGT [9]. This means that as more data is added, the method will converge on the correct species tree even when HGT is present, provided the rate of transfer is not unlimited. In contrast, concatenation-based supermatrix analyses, while often accurate under low HGT rates, have been shown to be less robust and can produce misleading results when HGT rates are high [9].
Experimental Data: Benchmarking Methods with Simulated and Empirical Data
Benchmarking studies using simulated and empirical datasets provide quantitative evidence for the performance of these methods under realistic evolutionary scenarios. The following table compiles key findings from such evaluations, offering a data-driven perspective.
Table 2: Experimental Accuracy of Phylogenetic Methods Under HGT and ILS
| Study Focus | Test Conditions | Method(s) | Performance Findings |
|---|---|---|---|
| Phylogenomics with HGT/ILS [9] | Simulated data with moderate ILS & varying HGT. | ASTRAL-2, wQMC | "Highly accurate, even on datasets with high rates of HGT." |
| NJst, Concatenation (ML) | "Highly accurate under low HGT," but "less robust to high HGT rates." | ||
| SuperTRI Assessment [3] | 7 genes, 82 Bovidae taxa. | SuperTRI (ST-based) | Showed "less sensitivity" to four phylogenetic methods (Bayesian, ML, MP). More accurate for taxon relationships. Enabled conclusions on introgression/radiation. |
| Chrono-STA [10] | Input trees with minimal species overlap. | ASTRAL-III, ASTRID, FastRFS | Could not recover true topology due to "minimal taxonomic overlap." |
| Chrono-STA (time-based ST) | Successfully produced correct supertree using divergence times. |
The experimental data underscores that no single method is universally superior, but the context is critical. For datasets where HGT is a major factor, quartet-based supertree methods demonstrate a clear advantage in robustness. Furthermore, novel supertree approaches like SuperTRI, which incorporates branch support analyses from multiple independent datasets, provide a more nuanced framework for assessing node reliability and identifying evolutionary processes like introgression that cause gene tree conflict [3].
Protocols for Phylogenetic Comparison and HGT Detection
To objectively compare supertree and supermatrix methods or to investigate HGT, researchers can follow established experimental workflows. The diagram below outlines a generalized protocol for a comparative phylogenomic study.
Figure 1: A general workflow for comparing supertree and supermatrix methods.
Detailed Experimental Protocols
- Core Gene Identification: Input proteomes (FASTA-formatted amino acid sequences) are searched against a Profile HMM Database (PHD) using
hmmsearchfrom the HMMER suite. Common bacterial core gene sets includebac120(120 genes) orUBCG(92 genes) [2]. An E-value threshold (e.g.,1e-10) is used to identify significant hits, and the top hit for each gene per genome is retained. - Multiple Sequence Alignment & Trimming: Homologous sequences for each core gene are aligned using tools like MUSCLE or Clustal Omega. The resulting multiple sequence alignments (MSAs) are then trimmed to remove poorly aligned regions using trimAl. The
strictplusalgorithm is often recommended as it automatically selects conserved blocks based on the MSA's features, improving phylogenetic signal [2]. - Phylogenetic Inference:
- Supermatrix Pathway: The individual, trimmed gene alignments are concatenated into a single supermatrix. A maximum-likelihood tree is then inferred from this matrix using programs like IQ-TREE (recommended for accuracy) or FastTree (recommended for speed on very large datasets) [2].
- Supertree Pathway: A maximum-likelihood tree is inferred from each individual, trimmed gene alignment. These gene trees are then used as input to a consensus supertree method. wASTRAL is a commonly used implementation for this purpose [2].
- HGT Detection Protocol: To identify HGT events that cause the discordance assessed above, a phylogenetic approach is robust. This involves reconstructing a trusted species tree (e.g., using a quartet-based method) and then comparing it to the phylogenies of individual genes. Genes whose trees show a statistically significant conflict with the species tree (e.g., assessed using likelihood-based tests) are considered HGT candidates [8]. Parametric methods, which scan for deviations in genomic signatures like GC content, can complement this by identifying recent transfers without the need for a reference species tree [8].
The Scientist's Toolkit: Essential Reagents and Software
Successful phylogenomic analysis relies on a suite of computational tools and databases. The following table lists key resources for implementing the protocols described above.
Table 3: Essential Research Reagents and Software for Phylogenomics
| Item Name | Type/Category | Function in Analysis |
|---|---|---|
| Core Gene Sets (bac120, UBCG) [2] | Profile HMM Database | Pre-defined sets of conserved, single-copy genes used as phylogenetic markers for initial homolog searching. |
| HMMER [2] | Software Suite | Contains hmmsearch, used to identify homologous sequences in proteomes against a Profile HMM Database. |
| trimAl [2] | Bioinformatics Tool | Trims multiple sequence alignments to remove poorly aligned positions and select conserved blocks, improving phylogenetic signal. |
| IQ-TREE [2] | Phylogenetic Software | Infers maximum-likelihood phylogenetic trees from alignments; noted for high accuracy and model selection. |
| ASTRAL/wASTRAL [9] [2] | Supertree Software | Estimates a species tree from a set of input gene trees using quartet coalescent methods. Robust to ILS and some HGT. |
| EasyCGTree [2] | Integrated Pipeline | An all-in-one pipeline that automates the workflow from proteome input to both supermatrix and supertree inference. |
| Reference Timetrees (TimeTree) [10] | Data Resource | Databases of published divergence times; can be used for calibration or as input for chronological supertree methods like Chrono-STA. |
The central challenge of HGT in tree reconstruction has significantly shaped the development and evaluation of phylogenetic methods. While the supermatrix approach remains a powerful and widely used tool, evidence from theoretical proofs and empirical benchmarks indicates that supertree methods, particularly quartet-based approaches like ASTRAL, offer superior robustness in the face of gene tree discordance caused by HGT and ILS [9]. The choice between methods should be informed by the biological context—specifically the expected rate of HGT in the taxa under study.
Future progress will likely come from enhanced supertree algorithms that more explicitly model the processes causing discordance, such as the SuperTRI framework which integrates branch support to better assess node reliability [3]. Furthermore, the integration of chronological data, as seen in Chrono-STA, offers a promising avenue for building comprehensive trees of life from datasets with limited taxonomic overlap [10]. As phylogenomics continues to mature, the synergy between sophisticated supertree methods and scalable, automated pipelines like EasyCGTree [2] will empower researchers to reconstruct increasingly accurate and meaningful evolutionary histories, even in the complex web of life woven by horizontal gene transfer.
Single-gene phylogenies, which reconstruct evolutionary relationships based on one genetic locus, present fundamental limitations for understanding prokaryotic evolution. These phylogenies often yield conflicting topologies due to factors like horizontal gene transfer (HGT), incomplete lineage sorting, and differential evolutionary rates across genes [11]. The inherent conflict between individual gene histories and the organismal lineage creates a central challenge for reconstructing a coherent evolutionary history, particularly in prokaryotic systems where HGT is prevalent [11].
The inadequacy of single-gene approaches has driven the development of methods that incorporate information from multiple genetic loci. Two primary methodologies have emerged: the supermatrix approach (concatenating multiple gene sequences into a single alignment) and the supertree approach (combining individual gene trees into a comprehensive phylogeny) [12] [11]. This article objectively compares the performance of these two methods within prokaryotic phylogeny research, providing experimental data and analytical frameworks to guide researchers in selecting appropriate methodologies for their specific research contexts.
Supermatrix vs. Supertree Methods: A Systematic Comparison
Core Conceptual Differences
The supermatrix and supertree methods represent philosophically distinct approaches to reconciling gene tree discordance. Supermatrix methods involve concatenating multiple gene alignments into a single large alignment from which a species tree is directly inferred, effectively averaging phylogenetic signals across all included loci [11]. In contrast, supertree methods first infer individual trees from each gene or locus separately, then use various algorithms to combine these separate trees into a comprehensive species tree [12].
Each approach carries different implications for handling genomic data. Supermatrix approaches typically require complete or nearly complete data across all taxa, which can limit dataset size, while supertree methods can accommodate datasets with missing sequences for some genes in some taxa [12]. However, this flexibility comes with potential costs to accuracy, as the initial separate analyses may propagate errors into the final combined tree.
Performance Comparison with Organismal Datasets
Empirical comparisons using real organismal datasets provide critical insights into the relative performance of these methods. A systematic evaluation of 20 multilocus datasets compared tree length under the parsimony criterion and computational time for supertree (SuperFine and SuperTriplets) and supermatrix (heuristic search in TNT) approaches [12].
Table 1: Performance Comparison of Supermatrix and Supertree Methods on 20 Multilocus Datasets
| Method | Tree Length (Parsimony) | Processing Time | Statistical Significance |
|---|---|---|---|
| Supermatrix (TNT) | Significantly shorter trees | Lower than SuperFine + locus-specific search | P < 0.0002 for tree length superiority |
| SuperFine | Longer trees | Higher than supermatrix | P < 0.01 for time difference |
| SuperTriplets | Longer trees | Roughly equivalent to supermatrix | Not significant for time difference |
The results demonstrated that supermatrix searches produced significantly shorter trees than either supertree approach, with strong statistical support (P < 0.0002) [12]. In terms of computational tractability, supermatrix processing time was significantly lower than SuperFine with locus-specific search but roughly equivalent to SuperTriplets with locus-specific search [12]. These findings challenge the assertion that supertree approaches offer superior computational tractability for large multilocus datasets.
Experimental Protocols and Workflows
Supermatrix Construction and Analysis Protocol
The supermatrix approach begins with identifying orthologous genes across the target prokaryotic taxa. The following protocol ensures methodological rigor:
Gene Family Identification: Use tools like PGAP2, which employs fine-grained feature analysis within constrained regions to rapidly and accurately identify orthologous and paralogous genes [13]. PGAP2 organizes data into gene identity networks (edges represent similarity between genes) and gene synteny networks (edges denote adjacent genes) [13].
Sequence Alignment: Align sequences for each orthologous gene family using robust alignment algorithms (e.g., MAFFT, Muscle). Manually inspect alignments for quality and remove ambiguous regions [14].
Concatenation: Concatenate aligned sequences into a supermatrix, ensuring proper positional homology across taxa. Use appropriate partitioning strategies to account for different evolutionary models for different genes.
Model Selection: Select best-fit evolutionary models for each partition using tools like ModelFinder or jModelTest [14].
Tree Inference: Perform heuristic tree search under maximum likelihood or Bayesian inference criteria using software such as RAxML, IQ-TREE, or MrBayes [14].
Support Assessment: Assess statistical support using bootstrap resampling (for maximum likelihood) or posterior probabilities (for Bayesian inference) [14].
Supertree Construction Protocol
Supertree methods employ a different workflow that emphasizes individual gene tree analysis prior to combination:
Locus-Specific Tree Inference: Infer separate phylogenetic trees for each gene or locus using appropriate evolutionary models. This step parallels single-gene phylogeny reconstruction.
Tree Combination: Apply supertree algorithms (e.g., Matrix Representation with Parsimony (MRP), SuperTriplets, or SuperFine) to combine individual gene trees into a comprehensive species tree [12].
Topology Refinement: Resolve conflicts between gene trees using various consensus or optimization criteria.
Support Evaluation: Assess support for bipartitions in the supertree through specific supertree support measures or by examining congruence among source trees.
The Ribosomal Tree Scaffold: A Reference-Based Framework
A hybrid approach that addresses the limitations of both single-gene phylogenies and purely algorithmic combinations is the Rooted Net of Life (RNoL) framework, which uses a ribosomal tree scaffold [11]. This method constructs a well-resolved and rooted tree scaffold inferred from a supermatrix of combined ribosomal RNA and protein sequences, then superimposes unrooted phylogenies of other gene families over this scaffold [11].
Ribosomal genes provide an ideal scaffold because they exhibit high sequence conservation with infrequent horizontal transfer between distantly related groups, offering a robust vertical evolutionary signal [11]. When conflicts between gene trees and the scaffold are sufficiently supported, reticulations are formed in the network, representing potential horizontal transfer events or other evolutionary processes causing discordance [11].
Table 2: Ribosomal Scaffold Approach for Reconstructing Prokaryotic Evolutionary History
| Component | Description | Rationale |
|---|---|---|
| Ribosomal Supermatrix | Concatenated ribosomal RNA and protein sequences | Provides robust, conserved vertical signal with minimal HGT |
| Scaffold Tree | Well-resolved, rooted phylogeny from ribosomal data | Serves as reference framework for additional gene families |
| Gene Family Trees | Unrooted phylogenies for all other gene families | Captures individual gene histories |
| Reticulations | Network connections formed at incongruent nodes | Represents HGT, endosymbiosis, or other non-vertical events |
This approach acknowledges that organisms consist of discrete evolutionary units (open reading frames, operons, plasmids, chromosomes) with potentially different histories, while providing a structured framework for integrating these multiple histories into a coherent representation [11].
Research Reagent Solutions for Prokaryotic Phylogenomics
Table 3: Essential Bioinformatics Tools for Prokaryotic Phylogenetic Analysis
| Tool/Resource | Function | Application Context |
|---|---|---|
| PGAP2 | Pan-genome analysis pipeline identifying orthologs/paralogs via fine-grained feature networks | Handles thousands of prokaryotic genomes; quantitative cluster characterization [13] |
| RAxML/IQ-TREE | Maximum Likelihood phylogenetic inference | Supermatrix analysis; single-gene tree inference for supertrees [14] |
| MrBayes | Bayesian phylogenetic inference | Supermatrix analysis with complex evolutionary models [14] |
| FigTree | Phylogenetic tree visualization | Visualization and annotation of final trees; publication-ready figures [15] |
| MAFFT/Muscle | Multiple sequence alignment | Alignment of orthologous sequences for supermatrix construction [14] |
| Roary/Panaroo | Pan-genome analysis | Alternative pan-genome analysis for identifying core and accessory genes [13] |
The inadequacy of single-gene phylogenies necessitates sophisticated multilocus approaches for reconstructing prokaryotic evolutionary history. Empirical evidence from organismal datasets indicates that supermatrix methods generally produce superior trees (shorter under parsimony criterion) with comparable or better computational efficiency than supertree approaches [12]. However, the rooted network approach incorporating a ribosomal scaffold offers a promising framework for acknowledging the complex evolutionary histories of prokaryotic genomes while maintaining a structured analytical approach [11].
For researchers navigating these methodological choices, the decision between supermatrix and supertree approaches should be guided by dataset characteristics, research questions, and computational resources. Supermatrix methods appear preferable for achieving optimal tree quality with manageable computational requirements, while supertree approaches may offer advantages for certain dataset structures with extensive missing data. Future methodological developments will likely continue to bridge the gap between these approaches, providing more powerful tools for unraveling the complex evolutionary history of prokaryotes.
The Limitations of 16S rRNA and the Rise of Whole-Genome Methods
For decades, the 16S ribosomal RNA (rRNA) gene has served as the cornerstone of microbial phylogeny and classification. Its utility stems from its universal presence in prokaryotes, functional constancy, and a structure featuring highly conserved regions interspersed with variable segments that serve as molecular clocks [1]. This gene single-handedly revealed the existence of the three domains of life—Archaea, Bacteria, and Eukaryota—and enabled the first large-scale surveys of uncultured microbial diversity [1]. However, technological advances have revealed fundamental limitations that constrain its resolution and accuracy. The 16S rRNA gene represents only about 0.05% of a typical prokaryotic genome, providing limited phylogenetic signal compared to approaches utilizing complete genomic information [1]. Furthermore, different variable regions of the 16S gene provide substantially different taxonomic resolution and exhibit distinct taxonomic biases [16]. For instance, the V4 region fails to confidently classify approximately 56% of sequences at the species level, while the V1-V3 region performs poorly for Proteobacteria [16]. Perhaps most critically, many bacterial genomes contain multiple polymorphic copies of the 16S gene that vary within a single genome, complicating strain-level discrimination [16].
Whole-genome approaches overcome these limitations by utilizing significantly more genetic information, providing greater resolution for both ancient and recent evolutionary relationships [1]. These methods can be broadly categorized into supermatrix approaches (which concatenate genes into a single alignment for tree inference) and supertree approaches (which combine independent gene trees into a consensus tree) [1]. The transition to whole-genome sequencing has been facilitated by dramatic improvements in sequencing technologies and computational power, enabling researchers to move beyond a single gene to comprehensive genome-level analysis [1] [17].
Core Whole-Genome Methodologies: Supermatrix vs. Supertree Approaches
The Supermatrix Approach
The supermatrix method involves concatenating multiple aligned gene sequences from a set of organisms into a single combined alignment matrix, from which a phylogenetic tree is then inferred [1]. This approach effectively increases the amount of data available for phylogenetic reconstruction, potentially improving statistical support for branching patterns. The supermatrix approach has been successfully used to infer phylogenies across the tree of life, with studies demonstrating high taxonomic congruence between supermatrix and supertree methods despite utilizing different sets of marker genes [1].
Key Advantages:
- Maximizes the use of sequence data in a single analysis
- Generally provides higher resolution for closely related taxa
- Allows application of complex evolutionary models to the entire dataset
Common Implementation Challenges:
- Requires complete or nearly complete data for all selected genes across all taxa
- Vulnerable to missing data, which can lead to systematic errors
- Computationally intensive for large datasets
The Supertree Approach
The supertree method involves constructing separate phylogenetic trees for individual genes or gene families and then combining these independent trees into a single consensus tree that represents the overall evolutionary relationships [1]. This approach provides a framework for integrating phylogenetic information from diverse sources, including datasets with different taxonomic samplings.
Key Advantages:
- Can incorporate data from partially overlapping gene sets
- Allows different evolutionary models for different genes
- More flexible for combining published phylogenetic trees
Common Implementation Challenges:
- Potential loss of information from individual gene sequences during the combination process
- Complex relationships between genes can be difficult to reconcile
- May produce less resolved trees compared to supermatrix approaches
Table 1: Comparative Analysis of Supermatrix vs. Supertree Methods
| Feature | Supermatrix Approach | Supertree Approach |
|---|---|---|
| Data Structure | Concatenated gene alignments | Multiple individual gene trees |
| Data Requirements | Requires complete data for all genes | Can work with partially overlapping data |
| Computational Demand | High for alignment and tree building | Moderate for individual trees, high for combination |
| Handling Missing Data | Problematic, can introduce bias | More robust to missing data |
| Resolution | Generally higher resolution | May have lower resolution in consensus tree |
| Common Software | RAxML, IQ-TREE, MrBayes | ASTRAL, MRP, Clann |
Methodological Workflow Comparison
The following diagram illustrates the key procedural differences between supermatrix and supertree construction methods:
Performance Comparison: Whole-Genome vs. 16S rRNA Approaches
Taxonomic Resolution and Accuracy
Whole-genome approaches demonstrate superior performance across multiple metrics compared to single-gene methods. The following table summarizes key comparative findings from empirical studies:
Table 2: Resolution and Accuracy Comparison of Phylogenetic Methods
| Method | Species-Level Resolution | Strain-Level Resolution | Reference Standard | Limitations |
|---|---|---|---|---|
| Full-Length 16S rRNA | Moderate (varies by region) | Limited due to intragenomic variation | 16S rRNA database | Different variable regions have taxonomic biases [16] |
| 16S Sub-regions (V4) | Poor (∼44% accurate species assignment) | Not achievable | Greengenes database | Fails to discriminate closely related taxa [16] |
| Feature Frequency Profile (FFP) | High | Moderate | NCBI taxonomy | Requires optimal feature length selection [18] |
| 20 Validated Bacterial Core Genes (VBCG) | High (validated fidelity) | High | 16S rRNA tree congruence | Requires complete genomes [19] |
| 92 Universal Bacterial Core Genes (UBCG) | High | Moderate | Presence/single-copy ratio | Some genes may have discordant evolutionary signals [19] |
A critical evaluation of 16S rRNA sequencing demonstrated that targeting sub-regions represents a historical compromise due to technological limitations. The V4 region performs particularly poorly, with 56% of in-silico amplicons failing to confidently match their sequence of origin at the species level. By contrast, full-length 16S sequences could correctly classify nearly all sequences to their correct species [16]. Whole-proteome phylogeny using Feature Frequency Profiles (FFP) clearly separates the three domains of life (Archaea, Bacteria, Eukaryota) and positions Planctomycetes at the basal position of the Bacteria domain [18].
Phylogenomic Core Gene Sets
Various core gene sets have been developed for bacterial phylogenomic analysis, with differing performance characteristics:
Table 3: Comparison of Bacterial Core Gene Sets for Phylogenomic Analysis
| Gene Set | Number of Genes | Selection Criteria | Phylogenetic Fidelity Assessment | Key Applications |
|---|---|---|---|---|
| VBCG (Validated Bacterial Core Genes) | 20 | Presence ratio >95%, single-copy ratio >95%, high phylogenetic fidelity | Explicitly evaluated using Robinson Foulds distance against 16S trees | High-fidelity strain tracking and evolution studies [19] |
| UBCG2 (Universal Bacterial Core Genes) | 81 | Presence ratio >95%, single-copy ratio >95% | Not evaluated for individual gene fidelity | Broad taxonomic applications [19] |
| bcgTree | 107 | Single-copy in >95% of bacterial genomes | Not evaluated for individual gene fidelity | Automated phylogenomic pipeline [19] |
| AMPHORA | 31 | Functional conservation | Not evaluated for individual gene fidelity | Phylogenomic analysis of genomes and metagenomes [19] |
The 20-gene VBCG set represents a significant advancement as it incorporates phylogenetic fidelity as a selection criterion in addition to presence and single-copy ratios. This validation against 16S rRNA tree congruence ensures the selected genes provide congruent evolutionary signals, resulting in phylogenies with higher topological accuracy [19].
Experimental Protocols for Whole-Genome Phylogenetics
Feature Frequency Profile (FFP) Protocol
The FFP method represents an alignment-free approach to whole-proteome phylogeny construction [18]:
Proteome Preparation: Obtain whole proteome sequences (WPS) consisting of all predicted protein sequences from an organism's chromosome(s)
Feature Extraction:
- Represent each WPS as a profile of feature frequencies
- Features are l-mers (subsequences) of amino acids
- Critical step: identify optimal feature lengths for phylogeny inference
Distance Matrix Construction: Calculate distances between organisms based on their feature frequency profiles
Tree Building: Construct phylogenetic trees from the distance matrix using standard algorithms (BIONJ or neighbor-joining)
This method has been applied to 884 prokaryotes, 16 unicellular eukaryotes, and random sequence outgroups, successfully separating the three domains of life and providing well-supported branch arrangements [18].
Validated Bacterial Core Genes (VBCG) Pipeline
The VBCG pipeline provides a validated approach for high-fidelity phylogenomic analysis [19]:
Genome Selection and Preparation:
- Input complete bacterial genomes
- Extract protein sequences and 16S rRNA genes
Core Gene Annotation:
- Use HMMER hmmscan to identify and annotate core genes
- Apply trusted score cutoffs for gene assignment
Gene Selection and Validation:
- Calculate presence ratio and single-copy ratio for each candidate gene
- Select genes with both ratios >95%
- Evaluate phylogenetic fidelity using Robinson Foulds distance comparison with 16S rRNA trees
Phylogenomic Tree Construction:
- Align core gene sequences using MUSCLE
- Trim alignments to remove terminal gaps
- Select conserved blocks using Gblocks
- Concatenate alignments, removing taxa with >1 missing gene
- Reconstruct tree using maximum likelihood methods
This protocol has been validated on 30,522 complete genomes covering 11,262 species and demonstrates superior performance for strain-level tracking of bacterial pathogens [19].
Advanced Techniques: Strain-Level Resolution and Population Genetics
Leveraging Intragenomic Variation for Strain Discrimination
Many bacterial genomes contain multiple polymorphic copies of the 16S gene that vary within a single genome. Modern sequencing platforms (PacBio CCS and Oxford Nanopore) can resolve these subtle nucleotide substitutions, enabling strain-level discrimination [16]. The RoC-ITS method combines full-length 16S sequencing with the neighboring internally transcribed spacer (ITS) region, providing both species-level information (from 16S) and strain-level information (from the more variable ITS) [20]. This approach enables monitoring of subtle shifts in microbial community composition that would be missed by conventional 16S sequencing.
Phylogenetic and Population Genetic Analysis with RoC-ITS
The RoC-ITS protocol utilizes rolling-circle amplification and nanopore sequencing to generate high-fidelity circular consensus sequences [20]:
PCR Amplification: Amplify the 16S-ITS region using primers targeting conserved regions of the 16S and 23S genes
Molecular Barcoding: Add unique barcodes to both ends of the amplicon through sequential PCR steps
Circularization: Circularize linear products using splint oligonucleotides that match the unique primer sequences
Rolling Circle Amplification: Generate concatenated repeats of the circular template
Nanopore Sequencing and Analysis: Sequence long concateners and computationally derive circular consensus sequences
This method provides unprecedented resolution for tracking microbial population dynamics and has been validated on artificial communities with comparison to Illumina sequencing results [20].
Table 4: Key Research Reagent Solutions for Whole-Genome Phylogenetics
| Resource Category | Specific Tools/Reagents | Function/Application | Key Features |
|---|---|---|---|
| Sequencing Platforms | PacBio HiFi, Oxford Nanopore Q20+ | Full-length 16S and whole-genome sequencing | Long reads (>15 kb), high accuracy (≥99%) [21] [16] |
| Primer Systems | 27F-II degenerate primer set | Full-length 16S rRNA gene amplification | Improved coverage of diverse bacterial communities [21] |
| Reference Databases | Greengenes, RDP, NCBI Genome | Taxonomic classification and reference | Curated collections of 16S and whole-genome sequences [16] [19] |
| Alignment Tools | MUSCLE, MAFFT | Multiple sequence alignment | Essential for supermatrix construction [19] |
| Tree Building Software | FastTree, RAxML, ASTRAL | Phylogenetic inference | Implements maximum likelihood and supertree methods [19] |
| Core Gene Sets | VBCG, UBCG2, bcgTree 107 genes | Phylogenomic analysis | Validated marker genes for different applications [19] |
| Computational Pipelines | VBCG Python pipeline, bcgTree | Automated phylogenomic analysis | Streamlined workflow from genomes to trees [19] |
Whole-genome approaches have fundamentally transformed prokaryotic phylogenetics by providing unprecedented resolution and evolutionary context. The supermatrix and supertree methods offer complementary strengths—the former providing maximum sequence utilization and resolution, while the latter offers flexibility in combining diverse datasets. As sequencing technologies continue to advance and computational methods become more sophisticated, the integration of these approaches will further refine our understanding of microbial evolution and diversity. The development of validated core gene sets like VBCG represents a significant step toward standardized, high-fidelity phylogenomic analysis that can be widely adopted across research communities studying bacterial evolution, ecology, and pathogenesis.
A Practical Guide to Supertree and Supermatrix Methodologies
The supermatrix approach to phylogenomics involves concatenating multiple sequence alignments from numerous genes into a single data matrix, which is then used to infer a species tree [22]. This method often provides greater phylogenetic accuracy by leveraging a larger number of sites compared to single-gene analyses [22]. The process can be broken down into several key stages, from data preparation to final tree inference, and can be automated by various software tools.
The diagram below illustrates the logical sequence of this workflow, highlighting the two primary analysis paths (gene trees and the supermatrix) that lead to the final species tree.
Detailed Experimental Protocols
Data Preparation and Orthologous Group Selection
The initial phase requires gathering sequences into Orthologous Groups (OGs), where each species is ideally represented by a single sequence per OG [23]. This is typically defined in a tab-delimited text file. The set of target species is automatically determined from the sequences, but can be manually curated [23]. A critical step is OG selection, which filters OGs based on species coverage (e.g., cog_100 uses only OGs containing sequences from all species, while cog_90 uses OGs with at least 90% species coverage) [23]. This ensures the concatenated matrix is derived from genes with sufficient phylogenetic information.
Sequence Alignment and Trimming
Sequences within each OG must be aligned. Any standard multiple sequence alignment tool can be used via a selected gene-tree workflow [23]. For example, a workflow like clustalo_default-trimal01-none-none specifies alignment with Clustal Omega, followed by trimming with trimAl [23]. If the gene-tree workflow includes a trimming step, the trimmed alignment is used for concatenation, which helps remove poorly aligned regions and improves phylogenetic signal [23].
Alignment Concatenation and Partitioning
Aligned OGs are concatenated into a single supermatrix. Tools like PhyKIT can automate this process [24]. The command pk_create_concat -a alignments.txt -p concat generates three key files [24]:
concat.fa: The concatenated supermatrix in FASTA format.concat.partition: A RAxML-style partition file defining the position and length of each gene within the supermatrix.concat.charset: A file describing the character sets.
The partition file is crucial for allowing different models of sequence evolution to be applied to different gene regions in subsequent steps [24].
Model Testing and Partition Scheme Optimization
Determining the best-fit model of sequence evolution is vital for accurate tree inference. IQ-TREE2 is widely used for this purpose [24]. Two key strategies are:
TESTMERGEONLY: Tests and potentially merges partitions that share a similar best-fit model, simplifying the partition scheme. The best-fit model is selected using criteria like BIC, AIC, or AICc [24].MF+MERGE: Uses the ModelFinderPlus scheme to find the best partition model, which can be more computationally intensive but may identify more complex models like free-rate models (LG+R3) [24].
For a simpler approach, testing a single model for the entire supermatrix with -m TESTONLY is also possible [24].
Species Tree Inference
The final step is inferring the species tree from the concatenated supermatrix. This is typically done with maximum likelihood programs like IQ-TREE2 or FastTree [23] [24]. The command specifies the supermatrix, the partition file, and the selected model. For example, using a pre-determined model looks like iqtree2 -s concat.fa -spp concat.partition.nex -m LG+I+G4 -pre concat_final_tree [24].
Comparative Analysis of Supermatrix Tools
Various software tools automate the supermatrix construction pipeline, each with different capabilities regarding alignment and handling of missing data.
Table 1: Comparison of phylogenomic tools supporting supermatrix construction
| Tool | Primary Approach | Last Update | Automates Alignment? | Handles Missing Data? | Key Features and Limitations |
|---|---|---|---|---|---|
| SPLACE [22] | Supermatrix | Aug 2022 | Yes | Yes | Fully automated split-align-concatenate pipeline; uses Docker for dependency management; open-source. |
| ROADIES [25] | Discordance-aware (Reference-free) | 2025 | N/A | Yes | Does not rely on pre-defined genes; randomly samples genomic loci; uses ASTRAL-Pro3 on multicopy genes; annotation-free and orthology-free. |
| ETE3 Build [23] | Supermatrix & Gene Trees | Active | Yes | Via OG selection | Highly configurable workflow system; allows detailed control over OG selection and alignment/trimming steps. |
| TREEasy [22] | Supermatrix & Supertree | Jul 2020 | Yes | No | Provides both supermatrix and supertree outputs; requires installation of numerous dependencies. |
| SequenceMatrix [22] | Supermatrix | May 2021 | No | No | GUI-based concatenation of pre-aligned files; susceptible to manual error during file preparation. |
| Phyutility [22] | Supermatrix | Sep 2012 | No | Yes | Manages trees, sequences, and alignments; can trim regions with high missing data. |
| TaxMan [22] | Supermatrix | Sep 2006 | Yes | No | Deprecated; automated sequence acquisition and alignment required multiple prerequisites. |
The Scientist's Toolkit: Essential Research Reagents and Materials
Table 2: Key software and data components for supermatrix analysis
| Item Name | Category | Function / Purpose | Example Tools / Formats |
|---|---|---|---|
| Orthologous Groups (OGs) | Input Data | Defines sets of genes shared across species descended from a common ancestral gene; the fundamental unit for concatenation. | COGs (Clusters of Orthologous Groups) [23] |
| Multiple Sequence Aligner | Software | Aligns nucleotide or amino acid sequences within each OG to identify homologous positions. | Clustal Omega, MAFFT [23] |
| Alignment Trimmer | Software | Removes poorly aligned or gappy regions from multiple sequence alignments to improve phylogenetic signal. | trimAl [23] |
| Sequence Concatenator | Software | Merges individual gene alignments into a single supermatrix file. | PhyKIT, SPLACE, ETE3 Build [23] [24] [22] |
| Partition File | Data File | Defines the boundaries and locations of each gene within the concatenated supermatrix. | RAxML format, NEXUS format [24] |
| Model Testing Software | Software | Identifies the best-fit model of sequence evolution for the entire supermatrix or for specific partitions. | IQ-TREE2 (ModelFinder) [24] |
| Maximum Likelihood Phylogenetic Inferencer | Software | Infers the final species tree from the concatenated supermatrix under the selected model of evolution. | IQ-TREE2, RAxML, FastTree [23] [24] |
Matrix Representation with Parsimony (MRP) is a foundational supertree technique designed to reconstruct a comprehensive phylogeny from multiple smaller, overlapping source trees. Developed independently by Baum (1992) and Ragan (1992), MRP has become one of the most widely used supertree methods in systematics [26] [27]. In the context of prokaryotic phylogeny research, where achieving complete taxonomic sampling across all genetic markers remains challenging, MRP offers a pragmatic solution for integrating phylogenetic information from diverse gene trees into a unified species tree. The method operates by encoding the topological information from source trees into a binary matrix representation, which is subsequently analyzed using parsimony algorithms to generate a supertree containing the complete set of taxa [28]. This approach stands in contrast to supermatrix (or total evidence) methods, which concatenate sequence alignments prior to phylogenetic analysis. The ongoing methodological debate between these two paradigms centers on their relative abilities to accurately reconstruct evolutionary relationships, particularly when dealing with complex evolutionary processes like horizontal gene transfer that frequently complicate prokaryotic phylogenetics [28] [29].
Methodological Framework: How MRP Works
Core Algorithm and Computational Process
The MRP algorithm transforms a collection of input trees with partially overlapping taxon sets into a single comprehensive supertree through a multi-step process. First, each internal branch within every source tree is encoded as a partial binary character in a matrix. For a given split in a source tree, taxa in one partition are assigned '1', those in the other partition receive '0', and taxa missing from that source tree are coded as '?' to indicate missing data [27]. This matrix representation effectively captures the hierarchical information contained across all source trees.
The resulting matrix is then analyzed using maximum parsimony criteria to find the tree (or trees) that requires the fewest evolutionary steps to explain the distribution of these binary characters. This optimization problem is typically solved using heuristic search algorithms due to the computational complexity of finding the most parsimonious tree for large datasets [27]. The computational implementation of MRP is available in various software packages, including the mrp.supertree function in the R package phytools, which offers options for optimization using either pratchet or optim.parsimony algorithms [27].
Variants and Extensions
Several methodological variants of MRP have been developed to enhance its performance:
Weighted MRP: This extension incorporates branch support values from source trees by weighting the matrix elements according to bootstrap frequencies or posterior probabilities [30]. This approach gives greater influence to more robustly supported nodes during the parsimony analysis.
Matrix Representation with Compatibility (MRC): An alternative approach that seeks to maximize the number of compatible source tree splits in the supertree, though it is less frequently implemented than MRP [31].
The following diagram illustrates the complete MRP workflow from source trees to supertree estimation:
Performance Comparison: MRP Versus Alternative Approaches
Comparative Accuracy Under Simulation Studies
Multiple simulation studies have evaluated the topological accuracy of MRP against supermatrix methods and other supertree approaches. The evidence consistently demonstrates that while MRP provides a reasonable approximation of the true phylogeny, it generally underperforms compared to supermatrix (total evidence) approaches, especially when maximum likelihood is used for the combined analysis [30].
A key simulation study using the SMIDGen methodology, which incorporates more biologically realistic conditions including gene birth-death processes and varied taxonomic sampling strategies, found that "combined analysis based upon maximum likelihood outperforms MRP and weighted MRP, giving especially big improvements when the largest subtree does not contain most of the taxa" [30]. This pattern held across datasets ranging from 100 to 1000 taxa, indicating the robustness of the results across different tree sizes.
Table 1: Comparative Accuracy of MRP Against Alternative Methods Under Simulation Conditions
| Method | Taxa Number | Data Partitions | Accuracy Rate (Homogeneous) | Accuracy Rate (Heterogeneous) | Key Study |
|---|---|---|---|---|---|
| Total Evidence (ML) | 10 | 10 | 78.7% | 76.8% | [26] |
| Average Consensus | 10 | 10 | 76.1% | 75.1% | [26] |
| MRP | 10 | 10 | 66.8% | 65.5% | [26] |
| Total Evidence (ML) | 30 | 10 | 33.3% | 31.7% | [26] |
| Average Consensus | 30 | 10 | 26.5% | 26.1% | [26] |
| MRP | 30 | 10 | 11.8% | 12.5% | [26] |
| Combined Analysis (ML) | 100-1000 | Mixed | Significantly higher than MRP | - | [30] |
| Weighted MRP | 100-1000 | Mixed | Intermediate between MRP and Combined | - | [30] |
Impact of Data Characteristics on Performance
The performance of MRP relative to alternative methods is influenced by several data characteristics:
Taxonomic Overlap: MRP performance degrades significantly when source trees have limited taxonomic overlap. One study found that "when source studies were even moderately nonoverlapping (i.e., sharing only three-quarters of the taxa), the high proportion of missing data caused a loss in resolution that severely degraded the performance for all methods" [32].
Number of Partitions: All methods, including MRP, show improved accuracy with increasing numbers of data partitions, though the performance gap between MRP and total evidence persists [26].
Data Heterogeneity: MRP is particularly sensitive to heterogeneous data, with performance dropping more significantly compared to total evidence methods when source trees conflict due to different evolutionary histories [26].
Taxon Sampling Strategy: MRP performs better when source trees include a scaffold tree with broad taxonomic sampling alongside clade-focused trees with dense sampling [33].
Experimental Protocols and Assessment Methodologies
Standard Simulation Framework
Simulation studies comparing phylogenetic methods typically follow a standardized protocol to ensure reproducible and biologically meaningful results:
Model Tree Generation: Trees are generated under a pure birth (Yule) process, with branch lengths modified to deviate from ultrametricity, reflecting realistic evolutionary scenarios [30].
Sequence Evolution: DNA sequences are evolved along model trees using programs like Seq-Gen under substitution models such as GTR+Γ, with site-specific rate variation [26].
Data Partitioning: Sequences are partitioned to mimic biological realities, with different genes potentially having distinct evolutionary histories or rates [26].
Tree Estimation: Source trees are estimated from individual partitions using methods like maximum likelihood or parsimony, followed by supertree construction using MRP and its variants [26].
Accuracy Assessment: Reconstructed trees are compared to the known model tree using topological distance measures, such as the Robinson-Foulds distance, to quantify accuracy [26].
Novel Simulation Approaches
Recent advances in simulation methodology have introduced more biologically realistic elements:
SMIDGen (Super-Method Input Data Generator): This approach incorporates gene birth-death processes to determine presence/absence patterns and uses clade-based taxon sampling strategies that reflect systematists' practices [30].
Heterogeneous Data Simulation: Some studies explicitly model heterogeneous data by evolving sequences on trees with identical topologies but different branch lengths [26].
Emerging Alternatives and Methodological Innovations
Quartet-Based Methods
Quartet-based supertree methods have emerged as promising alternatives to MRP. These methods operate by decomposing source trees into their constituent quartet trees (four-taxon subtrees) and then assembling these quartets into a comprehensive supertree. The Quartets MaxCut (QMC) method has shown particular promise, with simulation studies indicating that it "usually outperform[s] MRP and five other supertree methods... under many realistic model conditions" [33]. However, QMC methods face scalability challenges with large datasets, potentially limiting their utility in prokaryotic phylogenomics with extensive taxonomic sampling.
Majority-Rule Supertrees
Majority-rule supertree methods generalize the familiar majority-rule consensus to the supertree setting. These methods aim to find trees that contain splits present in a majority of the source trees, minimizing the Robinson-Foulds distance to the input trees. Variants include:
- MR(-) supertrees: Compare the pruned supertree to each input tree [31]
- MR(+) supertrees: Extend input trees to include missing taxa before comparison [31]
Studies have shown that MR(-) supertrees "performed well" when combining incompatible input trees, suggesting potential advantages over MRP in certain challenging phylogenetic contexts [31].
Integrated Approaches
Novel approaches that combine strengths from different methodologies are emerging. The SuperTRI method incorporates branch support analyses from independent datasets and assesses node reliability using multiple measures: "supertree Bootstrap percentage... the mean branch support... and the reproducibility index" [3]. This approach demonstrates "less sensitivity to different phylogenetic methods" and provides "more accurate interpretation of the relationships among taxa" compared to standard supermatrix approaches [3].
Table 2: Key Supertree Methods and Their Characteristics
| Method | Core Principle | Advantages | Limitations | Representative Studies |
|---|---|---|---|---|
| MRP | Matrix representation with parsimony | Widely implemented; handles incompatible trees | Lower accuracy than supermatrix; potential bias | [26] [30] |
| Weighted MRP | MRP with branch support weighting | Incorporates node confidence measures | Still underperforms vs. likelihood supermatrix | [30] [32] |
| QMC | Quartet amalgamation | High accuracy under many conditions | Scalability issues with large taxon sets | [33] |
| Majority-Rule | Generalization of majority-rule consensus | Theoretically appealing properties | Multiple variants with different behaviors | [31] |
| SuperTRI | Branch support integration | Robust across analysis methods; assesses reliability | Complex implementation | [3] |
Successful implementation of MRP and related supertree methods requires familiarity with both conceptual frameworks and practical computational tools. The following table outlines key resources mentioned in methodological studies:
Table 3: Essential Computational Tools for Supertree Research
| Tool/Resource | Function | Application Context | Key Features | Implementation |
|---|---|---|---|---|
| PAUP* | Phylogenetic analysis | Source tree estimation; parsimony analysis | Industry standard; multiple algorithms | Commercial software |
| RAxML | Maximum likelihood analysis | Source tree estimation; combined analysis | Efficient likelihood implementation; handles large datasets | [30] |
| PHYLIP | Phylogenetic package | Distance-based tree estimation | Comprehensive suite; includes FITCH algorithm | [26] |
| phytools | R package | MRP supertree estimation | mrp.supertree function; multiple optimization options |
[27] |
| Seq-Gen | Sequence simulation | Data simulation under evolutionary models | Implements various substitution models | [26] |
| PluMiST | Python program | Majority-rule supertree computation | Implements MR(-) and related methods | [31] |
The extensive comparative studies on MRP and alternative phylogenetic methods yield several strategic insights for prokaryotic phylogeny research. First, when sequence data are available and computationally manageable, supermatrix approaches using maximum likelihood generally provide superior topological accuracy compared to MRP supertrees [30]. This advantage appears particularly pronounced in prokaryotic systems where heterogeneous evolutionary processes like horizontal gene transfer can create substantial conflict between gene trees.
However, MRP and its weighted variant remain valuable approaches in several scenarios: when analyzing very large taxon sets that exceed computational limits of supermatrix methods; when combining trees derived from different data types (e.g., morphological and molecular); or when working with published phylogenies where original sequence data may be unavailable [30]. Weighted MRP, which incorporates branch support values, consistently outperforms unweighted MRP and in some studies has been shown to "usually out-perform total evidence slightly" under specific conditions [32].
For researchers pursuing MRP supertree construction, methodological best practices include: (1) utilizing weighted MRP whenever possible to incorporate branch support information; (2) ensuring adequate taxonomic overlap between source trees, potentially through strategic inclusion of scaffold trees with broad sampling; and (3) applying multiple supertree methods as a robustness check when analytical circumstances permit [30] [32]. As supertree methodology continues to evolve, methods like QMC and SuperTRI show promise for addressing specific limitations of MRP, particularly in handling topological conflict and providing more nuanced assessments of node reliability [33] [3].
The ongoing methodological development in this field suggests that while MRP established a foundational framework for supertree construction, next-generation methods incorporating more sophisticated statistical frameworks and efficient algorithms will likely shape the future of comprehensive phylogenetic synthesis in prokaryotic systems and beyond.
Reconstructing the evolutionary history of prokaryotes is fundamental to microbiology, with applications ranging from tracing the emergence of pathogenic strains to understanding the diversification of early life. However, this task is profoundly complicated by Horizontal Gene Transfer (HGT), a process where genes are transferred between organisms outside of vertical descent. HGT is not a mere nuisance; it is a major evolutionary force that can obscure the vertical phylogenetic signal, leading some to question whether a single, tree-like representation of prokaryotic evolution is even possible [34]. Within this challenging context, two primary computational strategies have been developed for building phylogenies from genome-scale data: the supermatrix and supertree approaches. This guide provides an objective comparison of these methods, focusing on their application in prokaryotic phylogeny and their capacity to handle the pervasive influence of HGT, with a specific case study on core gene set-based phylogeny (CGCPhy).
The fundamental difference between these approaches lies in how they combine data from multiple genes.
The Supermatrix (Concatenation) Approach: This method involves concatenating multiple sequence alignments from numerous genes into a single, large alignment [35]. This supermatrix is then used to infer a phylogenetic tree in a simultaneous analysis. Its main strength is that it combines phylogenetic signals directly from every character site across all genes, which can help overcome stochastic error and reveal emergent support for relationships that are weakly supported in individual gene analyses [35] [36]. A significant practical advantage is the relative simplicity of estimating branch lengths and assessing confidence using standard bootstrapping techniques.
The Supertree Approach: This method first infers individual phylogenetic trees for each gene or dataset separately. These source trees are then combined using a specific algorithm to create a summary "supertree" [37] [3]. A key advantage is its ability to incorporate data from genes that are not present in all taxa, thus potentially utilizing a broader range of genomic data. However, a major limitation is that most supertree methods lose information from the primary sequence data during the synthesis process and can be sensitive to the way conflicts between source trees are resolved [3].
The Critical Workflow: From Genomes to Phylogeny
The process of building a genome-scale phylogeny, whether supermatrix or supertree, involves several key steps. The workflow below illustrates the shared and divergent paths these methods take, from raw genomic data to a final reconstructed phylogeny.
Case Study: Core Gene Sets for Phylogeny (CGCPhy) in Practice
The use of Core Gene Sets for Phylogeny (CGCPhy) is a widely adopted strategy to mitigate the challenges of HGT. The underlying principle is that a carefully selected set of universal, single-copy genes is less likely to have been horizontally transferred and thus retains a stronger vertical signal [37] [38]. Several standardized core gene sets have been developed, and pipelines like EasyCGTree have been created to automate the process of identifying these genes, building alignments, and inferring both supermatrix and supertree phylogenies [2].
Experimental Protocol: Benchmarking CGCPhy Pipelines
To objectively compare the performance of phylogenetic methods, a typical experiment involves benchmarking different pipelines or data sets on a common set of genomes. The following protocol outlines the key steps, using a published analysis of the EasyCGTree pipeline as an example [2].
- Genome Selection and Input: A defined set of prokaryotic genomes is selected. For instance, a study might use 43 genomes from the genus Paracoccus to compare methods at the genus level. The input data is the proteome (all amino acid sequences) of each genome in FASTA format.
- Core Gene Identification with Profile HMMs: A profile Hidden Markov Model (HMM) database is used to search each proteome for homologs of core genes. Standardized gene sets like bac120 (120 bacterial genes), UBCG (92 bacterial core genes), or essential (107 essential genes) are typically employed [2]. Homologs are identified using
hmmsearch(from the HMMER package) with a strict E-value cutoff (e.g., 1e-10). - Sequence Alignment and Trimming: For each core gene, homologous sequences are aligned using tools like Clustal Omega or MUSCLE. The resulting multiple sequence alignments (MSAs) are then trimmed with a tool like trimAl (using methods such as "gappyout" or "strict") to remove poorly aligned regions and select conserved blocks [2].
- Phylogenetic Inference (Supermatrix vs. Supertree):
- Supermatrix: The trimmed alignments for all core genes are concatenated into a single supermatrix. A Maximum Likelihood (ML) tree is then inferred from this matrix using programs like IQ-TREE or FastTree [2] [38].
- Supertree: An ML tree is inferred from each individual trimmed gene alignment. These gene trees are then synthesized into a single supertree using a method like BUCKy (for Bayesian Concordance Analysis) or ASTRAL [2] [38].
- Performance Evaluation: The resulting phylogenies are compared using topological metrics. Common measures include:
- Robinson-Foulds (RF) distance: Measures the topological distance between two trees. A lower RF distance indicates more similar topologies.
- Cophenetic Correlation Coefficient (CCC): Assesses how well branch lengths in the tree represent the original evolutionary distances in the data. A value closer to 1.0 indicates higher accuracy [2].
Quantitative Comparison of Method Performance
The table below summarizes experimental data from benchmark studies that have compared supermatrix and supertree approaches in prokaryotic phylogenomics.
Table 1: Performance comparison of supermatrix and supertree methods based on experimental benchmarks
| Study & Data Set | Comparison Metric | Supermatrix Performance | Supertree Performance | Key Finding |
|---|---|---|---|---|
| EasyCGTree Pipeline [2](43 Paracoccus genomes) | Topological Distance (RF) | Nearly identical (distance < 0.1) to reference trees from UBCG/bcgTree | Not specified for supertree | Supermatrix approach produced highly consistent and accurate topologies |
| Tree Accuracy (CCC) | High accuracy (CCC > 0.99) | Not specified for supertree | Concatenation reliably reproduced expected evolutionary relationships | |
| Lang et al., 2013 [38](3,000+ bacterial/archaeal genomes) | Topological Similarity | Similar results to BUCKy concordance tree | Similar results to supermatrix tree (BUCKy) | Both methods produced largely congruent dominant topologies |
| Methodological Conclusion | Recommended as the current best approach for a single reference phylogeny | Valuable for capturing discordance, but not primary recommendation | Concatenation of conserved genes is the most robust method for a species tree framework | |
| Ropiquet et al., 2009 [3](82 Bovidae taxa, 7 genes) | Sensitivity to Phylogenetic Methods | Higher sensitivity to different tree inference methods | Lower sensitivity to different tree inference methods (SuperTRI) | Supertree approach (SuperTRI) was more stable and accurate for interpreting complex relationships |
The HGT Factor: Impact and Handling in Phylogenetic Methods
Horizontal Gene Transfer is a primary source of incongruence between gene trees and the species tree. The choice of core genes is therefore critical, as different functional categories of genes are transferred at different rates and retain the vertical signal to varying degrees.
Functional Categories and Vertical Signal Strength
Experimental data has revealed clear patterns in how different gene functions resist or succumb to HGT, which directly impacts their utility for phylogenetics.
Table 2: Impact of gene functional category on phylogenetic signal and susceptibility to HGT
| Functional Category | Performance in Recovering Vertical Signal | Susceptibility to HGT | Notes and Experimental Evidence |
|---|---|---|---|
| Informational Genes(e.g., Transcription, Translation) | Better performance [37] | Lower susceptibility [39] | The "Transcription" category performed best in one study. Translation genes (ribosomal proteins) are also strongly vertical but can be transferred [37] [39]. |
| Operational Genes(e.g., Metabolism) | Poorer performance [37] | Higher susceptibility [39] | Metabolic genes are frequently transferred to facilitate adaptation to new environments [39]. |
| Essential / Minimal Genome Genes | Better performance than universal genes [37] | Not explicitly stated | Genes suspected to be essential for cellular life harbor a stronger vertical signal, though significant incongruence remains [37]. |
| Poorly Characterized Genes | Surprisingly good performance [37] | Not specified | Suggests unannotated genes may play an underappreciated role in vertical inheritance [37]. |
How Methods Cope with HGT-Driven Incongruence
The supermatrix and supertree approaches handle the inherent conflict caused by HGT in fundamentally different ways, leading to distinct strengths and weaknesses.
- Supermatrix Approach: This method assumes a dominant, underlying vertical signal exists across the majority of the concatenated genes. It effectively averages the phylogenetic signal from all included partitions. While this works well when the dominant signal is vertical, it can be misleading if HGT is pervasive and creates a strong, conflicting signal that becomes dominant in the concatenated dataset [3] [35]. The result can be a highly supported but incorrect tree.
- Supertree Approach: Methods like BUCKy are designed to be agnostic about the cause of incongruence. Instead of averaging, they aim to identify the primary concordance tree—the topology that is most frequently supported by the individual gene trees [38]. This allows for the explicit quantification of conflict (the "discordance") at each node, which can be a valuable indicator of potential HGT or other biological processes. This makes supertrees particularly useful for exploring evolutionary signals from a different perspective and identifying genomic regions with conflicting histories [2].
The Scientist's Toolkit: Essential Research Reagents and Software
Successful prokaryotic phylogenomics relies on a suite of bioinformatics tools and curated data resources. The following table details key solutions used in the field.
Table 3: Essential research reagents and software for prokaryotic phylogenomics
| Tool / Resource Name | Type | Primary Function in Phylogenomics | Key Feature |
|---|---|---|---|
| EasyCGTree [2] | Software Pipeline | All-in-one automatic pipeline from genomes to phylogeny (SM & ST) | User-friendly, cross-platform (Linux/Windows), includes pre-compiled tools and HMM databases |
| IQ-TREE [2] | Software Tool | Maximum Likelihood phylogenetic inference from sequence alignments | High accuracy, efficient for large datasets, implements many evolutionary models |
| RAxML [38] | Software Tool | Maximum Likelihood phylogenetic inference | Highly optimized for performance on large supermatrices |
| BUCKy [38] | Software Tool | Bayesian Concordance Analysis; infers a supertree from gene trees | Accounts for uncertainty in gene trees, agnostic to causes of incongruence (e.g., HGT) |
| HMMER (hmmsearch) [2] | Software Tool | Homolog identification in proteomes using Profile HMMs | Sensitive and precise detection of core genes based on statistical models |
| trimAl [2] | Software Tool | Automated alignment trimming and curation | Improves alignment quality by removing poorly aligned positions ("gappyout", "strict") |
| bac120 / ar122 [2] | Profile HMM Database | Curated set of 120 bacterial / 122 archaeal core genes for homolog searching | Provides a standardized, ubiquitous set of markers for domain-level phylogeny |
| UBCG [2] | Profile HMM Database | Up-to-date Bacterial Core Gene set (92 genes) | Specifically designed for robust bacterial phylogeny |
| Clustal Omega / MUSCLE [2] | Software Tool | Multiple Sequence Alignment of homologous sequences | Generates the primary alignments used for phylogenetic inference |
Both the supermatrix and supertree approaches have a critical role in modern prokaryotic phylogenomics. The choice between them depends heavily on the specific biological question and the nature of the genomic data.
- For Inferring a Robust Species Tree Framework: The supermatrix approach is currently the most effective and widely recommended method [38]. When applied to a curated set of conserved, single-copy core genes (e.g., bac120, UBCG), it provides a strongly supported phylogenetic framework that best represents the vertical inheritance of the sampled genomes. Its performance has been consistently validated in benchmarking studies [2].
- For Exploring Incongruence and Detecting HGT: The supertree approach, particularly using sophisticated methods like BUCKy, is a powerful complementary tool. It is less sensitive to methodological variations and explicitly models the discordance between genes, providing a more nuanced view of evolutionary history that includes the impact of HGT [3] [38].
In practice, a combined strategy is often most powerful: using a supermatrix of carefully selected, vertically-informative genes to establish a reference species tree, and then leveraging supertree-style analyses to quantify discordance and identify specific genes whose histories deviate from this dominant pattern, potentially as a result of horizontal transfer.
In the field of prokaryotic phylogeny, reconstructing the evolutionary history of organisms is fundamental to understanding microbial diversity, evolution, and function. Two primary computational strategies have emerged for building comprehensive phylogenies from molecular data: the supermatrix (or combined analysis) approach and the supertree approach [40] [30]. The supermatrix method concatenates aligned sequence data from multiple genes into a single large matrix from which a phylogeny is inferred [30] [41]. In contrast, the supertree method estimates phylogenetic trees for individual genes or datasets first and then combines these source trees into a single supertree that encompasses all taxa [30] [42]. The choice between these methodologies can significantly impact phylogenetic inference, especially for prokaryotes where horizontal gene transfer and complex evolutionary histories are common. This guide provides an objective comparison of current software tools and pipelines implementing these methods, focusing on their application in prokaryotic phylogenomic research.
Supermatrix Approach
The supermatrix method involves concatenating multiple sequence alignments from different genes into a single large alignment, which is then used to infer a phylogenetic tree [40] [36]. This approach reduces stochastic errors by combining weak phylogenetic signals across different genes and typically uses maximum likelihood or Bayesian inference for tree reconstruction [43]. A key challenge is assembling large datasets from databases with significant missing data, which can affect phylogenetic accuracy [36].
Supertree Approach
Supertree methods construct a comprehensive phylogeny by combining multiple smaller source trees with partially overlapping taxa [36] [42]. Popular techniques include Matrix Representation with Parsimony (MRP) and its weighted variant (wMRP), which encode source trees as a matrix of partial binary characters analyzed using parsimony heuristics [30] [41]. These methods are particularly valuable when dealing with data types that cannot be easily concatenated or when source trees are derived from published studies [30].
Integrated and Emerging Methods
Recent approaches have sought to combine strengths of both methods. The mega-phylogeny approach uses database sequences and taxonomic hierarchies to build extremely large trees with denser matrices than traditional supermatrices [36]. Chrono-STA represents a novel algorithm that integrates phylogenies with divergence time data, using node ages from published molecular timetrees to build supertrees even with minimal species overlap [10].
Table 1: Core Concepts in Phylogenomic Reconstruction
| Concept | Description | Typical Use Cases |
|---|---|---|
| Supermatrix | Concatenates multiple gene alignments into a single matrix for phylogenetic analysis [40] [43] | Phylogenomic studies with complete genomic data; reduces stochastic error [43] |
| Supertree | Combines multiple source trees with overlapping taxa into a comprehensive phylogeny [30] [42] | Integrating published phylogenies; datasets with incompatible histories [40] [43] |
| Mega-Phylogeny | Modified supermatrix approach using profile alignments and taxonomic hierarchies [36] | Building very large trees (thousands of taxa) from database sequences [36] |
| Chrono-STA | Supertree method using node ages and divergence times [10] | Integrating timetrees with limited taxonomic overlap [10] |
Comparative Performance Analysis
Empirical Comparisons of Methodological Performance
Several studies have quantitatively compared the performance of supertree and supermatrix approaches. A simulation study using the SMIDGen methodology found that combined analysis (supermatrix) based on maximum likelihood consistently outperformed MRP and weighted MRP supertree methods in topological accuracy, particularly when the largest subtree did not contain most taxa [30] [41]. The supermatrix approach demonstrated lower false negative and false positive rates across datasets of 100 to 1000 taxa [41].
In contrast, the SuperTRI approach, which incorporates branch support analyses from independent datasets, showed less sensitivity to different phylogenetic methods (Bayesian inference, maximum likelihood, weighted and unweighted parsimony) compared to supermatrix analysis when studying Bovidae [3]. This suggests that supertree methods may offer advantages in handling conflicting signals between datasets.
Prokaryotic-Specific Tool Performance
For prokaryotic phylogenomics, EasyCGTree has emerged as a comprehensive pipeline that implements both supermatrix and supertree approaches [43]. In tests with 43 Paracoccus genomes, EasyCGTree's supermatrix trees showed nearly identical topology (Robinson-Foulds distance < 0.1) and accuracy (cophenetic correlation coefficients > 0.99) to those inferred by established pipelines UBCG and bcgTree [43]. The supertree implementation in EasyCGTree provides an alternative for exploring evolutionary signals from a different perspective, though specific accuracy metrics for its supertree function were not provided in the available literature.
Table 2: Performance Comparison of Phylogenomic Methods from Empirical Studies
| Method/Approach | Topological Accuracy | Strengths | Limitations |
|---|---|---|---|
| Supermatrix (ML) | Higher accuracy compared to MRP/wMRP in simulations [30] [41] | Combines weak phylogenetic signals; reduces stochastic error [43] | Requires sequence alignment; sensitive to model misspecification [40] |
| MRP Supertree | Lower accuracy compared to combined analysis in large simulations [30] [41] | Can combine diverse data types; does not require sequence alignment [30] | May produce spurious novel clades; signal enhancement issues [36] [42] |
| Chrono-STA | Accurate with limited species overlap [10] | Uses divergence times; no phylogenetic backbone required [10] | New method; limited testing on prokaryotic datasets [10] |
| EasyCGTree Supermatrix | Nearly identical to UBCG/bcgTree (CCC > 0.99) [43] | User-friendly; cross-platform; all-in-one pipeline [43] | Limited performance data for supertree function [43] |
Implementation with Popular Packages and Pipelines
EasyCGTree: An All-in-One Solution
EasyCGTree is a user-friendly, cross-platform pipeline for reconstructing genome-scale maximum likelihood phylogenetic trees using both supermatrix and supertree approaches [43]. Implemented in Perl, it comes as a self-contained package with precompiled executable files for various bioinformatics tools.
Workflow Process:
- Input: Uses FASTA-formatted amino acid sequences from prokaryotic proteomes
- Gene Calling: Identifies homologs using profile hidden Markov models (HMMs) from a built-in database
- Alignment: Employs MUSCLE (Windows) or Clustal Omega (Linux) for multiple sequence alignment
- Trimming: Uses trimAl with automatic methods (gappyout, strict, strictplus) for alignment refinement
- Phylogeny Inference: Supports both supermatrix and supertree approaches using FastTree or IQ-TREE [43]
EasyCGTree includes several predefined core gene sets for prokaryotes, including bac120 (120 bacterial genes), ar122 (122 archaeal genes), UBCG (92 bacterial core genes), and essential (107 essential single-copy genes) [43]. This makes it particularly suitable for prokaryotic phylogenomics.
Specialized Supertree Tools
For researchers specifically interested in supertree construction, several specialized tools are available:
- ASTRAL-III: Estimates species trees from gene trees using quartet-based methods [10]
- Clann: Investigates phylogenetic information through supertree analyses using various algorithms [10]
- MRP: Implemented in various phylogenetic software packages, using parsimony on matrix representations of trees [30] [41]
Mega-Phylogeny Pipeline
The mega-phylogeny approach, implemented in Python with BioPython, provides a modified supermatrix method for building extremely large trees [36]. Key features include:
- Uses profile alignments to combine orthologous gene regions
- Employs a novel orthology assessment method using BLAST against designated sequences
- Successfully built trees with over 13,500 species for green plants [36]
Experimental Protocols and Methodologies
SMIDGen Simulation Protocol
The Super-Method Input Data Generator (SMIDGen) provides a robust framework for comparing phylogenetic methods under biologically realistic conditions [30] [41]:
- Generate Model Trees: Create random model trees under a pure birth process (100-1000 taxa)
- Evolve Gene Sequences: Simulate sequence evolution under GTR+Gamma+Invariable process with gene birth-death processes creating realistic missing data patterns
- Dataset Production: Produce datasets reflecting systematic practice (clade-based and scaffold datasets)
- Tree Estimation: Estimate source trees and combined analysis trees using RAxML (ML) and PAUP* (MP)
- Supertree Construction: Apply MRP and weighted MRP methods
- Performance Evaluation: Assess topological accuracy using false negative and false positive rates
Empirical Validation Protocol for Prokaryotic Tools
For evaluating tools like EasyCGTree, the following protocol provides comprehensive assessment:
- Dataset Selection: Curate genomic datasets with known phylogenetic relationships (e.g., 43 Paracoccus genomes)
- Gene Set Selection: Apply multiple core gene sets (bac120, UBCG, essential genes)
- Tree Construction: Infer phylogenies using both supermatrix and supertree approaches
- Topological Comparison: Calculate Robinson-Foulds distances and cophenetic correlation coefficients against reference trees
- Support Assessment: Evaluate branch support using bootstrap analyses or posterior probabilities
Table 3: Essential Research Reagents and Computational Solutions for Phylogenomic Studies
| Category | Specific Tools/Reagents | Function/Application |
|---|---|---|
| Core Gene Sets | bac120, ar122, UBCG, essential genes [43] | Predefined HMM profiles for identifying phylogenetic marker genes in prokaryotes |
| Alignment Tools | MUSCLE, Clustal Omega [43] | Multiple sequence alignment for preparing supermatrix data |
| Tree Inference | IQ-TREE, FastTree, RAxML [43] [41] | Maximum likelihood phylogenetic estimation for supermatrix and source trees |
| Supertree Construction | ASTRAL-III, Clann, MRP implementations [10] | Combining source trees into comprehensive supertrees |
| Sequence Databases | GenBank, RDP, Custom HMM Databases [43] [36] | Sources of sequence data and profile HMMs for gene identification |
Workflow Visualization
Diagram 1: Workflow for Phylogenomic Tree Construction showing both Supermatrix and Supertree Approaches. The pipeline begins with input proteomes, proceeds through gene identification and alignment, then branches into the two main methodological approaches before final comparison and validation.
The choice between supermatrix and supertree approaches for prokaryotic phylogeny depends on research goals, data characteristics, and computational resources. Supermatrix methods generally provide higher topological accuracy when comprehensive sequence data is available and can be properly aligned [30] [41]. Supertree methods offer flexibility for integrating diverse data types and published phylogenies, particularly when dealing with significant missing data or incompatible phylogenetic signals [3] [42].
For most prokaryotic phylogenomic studies, integrated pipelines like EasyCGTree provide the best balance of usability and performance, offering both approaches in a single framework [43]. For specialized applications involving divergence times or limited taxonomic overlap, emerging methods like Chrono-STA show promise [10]. As phylogenomic datasets continue to grow in size and complexity, the development of more sophisticated integration methods that combine the strengths of both approaches will be essential for advancing our understanding of prokaryotic evolution.
Navigating Pitfalls and Optimizing Workflows for Reliable Results
In prokaryotic phylogenomics, the quest to reconstruct the evolutionary history of bacteria and archaea relies heavily on robust computational methods. The supermatrix (SM) and supertree (ST) approaches represent two fundamental strategies for inferring phylogenetic trees from genome-scale data [3] [2]. The SM method concatenates multiple sequence alignments into a single large alignment for analysis, aiming to overwhelm stochastic errors by combining weak phylogenetic signals across many genes [44] [45]. In contrast, the ST method builds individual trees from separate genes and then combines these topologies into a consensus tree, which can accommodate genes with incompatible phylogenetic histories [3] [2]. While phylogenomics has improved resolution, high statistical support does not guarantee accuracy. This guide examines critical pitfalls—data errors, model misspecification, and long-branch attraction—within the context of comparing SM and ST methods for prokaryotic research, providing researchers with experimental data and protocols to navigate these challenges.
Pitfall 1: Data Errors in Phylogenomic Supermatrices
The construction of a supermatrix involves compiling and curating vast amounts of genomic sequences, a process highly susceptible to data errors that can profoundly impact tree inference [44].
- Origins and Impact: Data errors encompass sequencing inaccuracies, erroneous gene annotations, and contamination from other species [44]. While manageable in single-gene analyses, these errors become pervasive and challenging to identify in phylogenomic supermatrices due to the impracticality of manually curating thousands of sequences. If unaddressed, they introduce widespread homoplasy (false phylogenetic signal) that can lead to incorrect but highly supported tree topologies [44].
- Comparative Mitigation in SM vs. ST: The ST approach demonstrates greater inherent robustness to certain data errors. Because it analyzes genes independently, an error contained within a single gene dataset is less likely to pervasively distort the final consensus tree. In contrast, an error in a supermatrix is propagated throughout the entire concatenated alignment, potentially misleading the entire analysis [44].
Table 1: Common Data Errors and Handling in Supermatrix vs. Supertree Approaches
| Error Type | Description | Impact on Supermatrix | Impact on Supertree | Common Mitigation Strategy |
|---|---|---|---|---|
| Sequencing Errors | Incorrect base calls during sequencing [44]. | High; embedded errors can create false phylogenetic signal across the entire matrix. | Lower; effect is confined to the individual gene tree where the error occurred. | Automated quality control and filtering of input sequences [2]. |
| Annotation Errors | Mis-identification of gene start/stop or function [44]. | High; can lead to the inclusion of non-homologous sequences in the alignment. | Moderate; affects only the specific gene alignment, but can still mislead that gene's tree. | Profile HMMs (e.g., with HMMER) for precise homolog detection [2]. |
| Contaminant Sequences | Sequences from a foreign organism (e.g., host DNA) [44]. | High; can create strong, misleading phylogenetic signals. | Lower; contaminants often appear as outliers in individual gene trees. | Taxonomic checks and analysis of genome completeness [2]. |
Pitfall 2: Model Misspecification and Systematic Error
Systematic errors arise when the evolutionary model used in phylogenetic inference is insufficient to capture the true complexity of sequence evolution, leading to statistical inconsistency and confident support for an incorrect tree [44] [45].
- The Core Problem: Standard site-homogeneous models (e.g., WAG, JTT) assume all sites in an alignment evolve under the same process. However, empirical data shows that different amino acid sites have distinct biochemical constraints and preferences [45]. This model misspecification causes an underestimation of the true extent of multiple substitutions (saturation) at individual sites, misinterpreting homoplasies as shared derived characters [45].
- Experimental Evidence and the CAT Model: Research on the metazoan tree demonstrated that a site-heterogeneous mixture model (CAT) could suppress a well-characterized long-branch attraction artefact that mispositioned fast-evolving phyla like nematodes [45]. In a Bayesian framework, the CAT model, which clusters alignment sites into categories with distinct amino-acid profiles, yielded a different and more reliable topology than the WAG model [45]. Cross-validation confirmed that CAT provided a statistically better fit to the data by more accurately accounting for site-specific saturation [45].
Table 2: Comparison of Site-Homogeneous vs. Site-Heterogeneous Evolutionary Models
| Model Feature | Site-Homogeneous (e.g., WAG) | Site-Heterogeneous (e.g., CAT) | Experimental Support |
|---|---|---|---|
| Underlying Assumption | All sites evolve according to a single global amino-acid replacement process [45]. | Sites are clustered into categories, each with its own equilibrium amino-acid frequency profile [45]. | Bayesian cross-validation showed better statistical fit for CAT [45]. |
| Handling of Saturation | Tends to underestimate saturation, making methods prone to LBA [45]. | Better accounts for site-specific saturation and homoplasy, reducing LBA [45]. | Posterior predictive tests showed CAT correctly modelled saturation levels where WAG failed [45]. |
| Computational Demand | Lower | Significantly higher | Justified for robust deep-level phylogenies despite increased cost [45]. |
Figure 1: Model selection workflow. Site-heterogeneous models like CAT provide robustness against systematic errors like LBA.
Pitfall 3: Long-Branch Attraction (LBA) Artefacts
Long-branch attraction is a classic phylogenetic artefact where fast-evolving (long-branched) lineages are incorrectly inferred to be closely related, not due to common ancestry, but due to convergent substitutions at saturated sites [45].
- Mechanism and Amplification in Supermatrices: LBA occurs when a model fails to distinguish between shared ancestry (homology) and convergent evolution (homoplasy) at saturated sites [45]. In supermatrix analyses, the large amount of data can amplify this systematic error, leading to high confidence in an incorrect topology [44] [45]. This is particularly problematic in prokaryotic phylogeny with poor taxon sampling or when using a distant outgroup [45].
- Comparative Robustness of ST and SM: The ST method, by analyzing genes independently, can be less sensitive to LBA that homogeneously affects all genes. If LBA is not present in all individual gene trees, the consensus process can buffer against it. In contrast, an SM analysis that concatenates all genes can "lock in" a single, pervasive LBA artefact [3].
Table 3: Experimental Results: Resolving LBA with Site-Heterogeneous Models
| Analysis Condition | Phylogenetic Position of\nNematodes (Fast-Evolving)" | Statistical Support | Interpretation |
|---|---|---|---|
| Site-Homogeneous Model (WAG) | Base of Bilateria | High (Strong Posterior Probability) | LBA Artefact [45] |
| Site-Heterogeneous Model (CAT) | Within Protostomes | High (Strong Posterior Probability) | Accepted Phylogeny [45] |
| Data Set: Meta1 | Contradictory positions depending on outgroup with WAG | — | Demonstrates inconsistency and model sensitivity [45] |
| Data Set: Meta2 | Contradictory positions depending on outgroup with WAG | — | Demonstrates inconsistency and model sensitivity [45] |
Experimental Protocols for Methodological Comparison
To objectively compare the performance of SM and ST methods, specific experimental protocols can be implemented using available bioinformatics pipelines.
- Protocol 1: Core Gene Phylogeny with EasyCGTree: The EasyCGTree pipeline offers a standardized method for inferring both SM and ST trees from a set of prokaryotic proteomes [2]. The input is multi-FASTA amino acid sequences. Users specify a profile HMM database (e.g.,
bac120for Bacteria) to identify core genes. The pipeline then performs multiple sequence alignment, trimming (e.g., withtrimAl), and tree inference. The SM tree is built from a concatenated alignment usingIQ-TREEorFastTree, while the ST tree is built from individual gene trees inferred withFastTreeand summarized withwASTRAL[2]. - Protocol 2: Assessing Robustness with SuperTRI: The SuperTRI approach provides a framework for assessing the reliability of phylogenetic inferences by analyzing multiple independent data sets [3]. It calculates three key node support measures: 1) Supertree Bootstrap Percentage, 2) Mean Branch Support (average bootstrap or posterior probability from separate gene analyses), and 3) Reproducibility Index (proportion of individual analyses recovering a clade) [3]. This method is less sensitive to the specific phylogenetic algorithm used and offers deeper insight into conflicting signals between genes compared to a standard supermatrix analysis [3].
Figure 2: Phylogenomic pipeline workflow. Pipelines like EasyCGTree automate core gene identification and tree inference.
Successful phylogenomic analysis requires a suite of computational tools and databases. The following table details key resources for prokaryotic phylogeny.
Table 4: Essential Computational Tools and Databases for Prokaryotic Phylogenomics
| Tool/Resource Name | Type | Function in Phylogenomics | Access Link |
|---|---|---|---|
| EasyCGTree | Software Pipeline | All-in-one pipeline for SM and ST phylogeny from proteome data [2]. | GitHub |
| GTDB (Genome Taxonomy Database) | Taxonomy Database | Provides a standardized bacterial and archaeal taxonomy based on genome-scale phylogeny [46]. | GTDB |
| HMMER | Software Tool | Used for homology searching with profile HMMs to identify core genes [2]. | HMMER |
| IQ-TREE | Software Tool | Performs maximum likelihood phylogenetic inference with complex models; suitable for large SMs [2]. | IQ-TREE |
| trimAl | Software Tool | Automates the trimming of multiple sequence alignments to remove poorly aligned regions [2]. | trimAl |
| SILVA | Database | Provides curated, aligned ribosomal RNA sequence data for phylogenetic analysis [46]. | SILVA |
The choice between supermatrix and supertree methods in prokaryotic phylogenomics is not trivial, as each presents distinct advantages and vulnerabilities. The supermatrix approach, while powerful for concatenating weak signals, is highly susceptible to systematic errors like LBA and can be compromised by data errors that propagate through the entire analysis. The supertree approach offers greater robustness to missing data and localized errors but may suffer from unresolved conflicts between gene trees. Empirical evidence strongly indicates that incorporating site-heterogeneous models (e.g., CAT) is critical for mitigating LBA artefacts and achieving accurate phylogenies, regardless of the chosen method. For robust and reliable results, researchers should leverage automated pipelines, adhere to rigorous data curation protocols, and select evolutionary models that account for the complexity of genomic sequence evolution.
In the field of prokaryotic phylogeny, the reconstruction of evolutionary relationships is fundamental to understanding microbial diversity, evolution, and function. Two principal computational approaches—supertree and supermatrix methods—have been developed to build comprehensive phylogenies from multiple data sources. Supertree methods synthesize a larger phylogenetic tree from numerous smaller source trees with partially overlapping taxa, while supermatrix methods concatenate multiple sequence alignments into a single large data matrix from which a phylogeny is inferred [1] [47]. Despite their widespread application, supertree methods present significant limitations that can impact the accuracy and reliability of the resulting phylogenetic trees. This review examines the core constraints of supertree methodologies, focusing specifically on the loss of phylogenetic information during tree construction and the propagation of inaccuracies from source trees, while providing experimental data comparing their performance against supermatrix approaches in prokaryotic research.
Theoretical Framework and Core Limitations
The Problem of Information Loss
The supertree construction process inherently involves condensing multiple source trees into a single topology, which can result in the loss of critical phylogenetic information. The Matrix Representation with Parsimony (MRP) method, one of the most common supertree techniques, exemplifies this issue. MRP operates by converting source trees into a matrix of binary characters where species sharing a common node are assigned '1', others in the tree get '0', and missing species are coded as '?' [47]. This transformation from tree topology to character matrix represents a significant data reduction.
- Reduction of Evolutionary Signals: The MRP matrix only captures topological information from source trees, discarding valuable supporting data such as branch lengths, bootstrap support values, and sequence evolution models [3] [47]. This loss of supporting data means the supertree analysis operates without the full phylogenetic context present in the original analyses.
- Inadequate Handling of Conflict: When source trees present conflicting phylogenetic signals, supertree methods must reconcile these conflicts through algorithmic consensus. However, this process often oversimplifies complex evolutionary scenarios, particularly those involving horizontal gene transfer—a common phenomenon in prokaryotes [1] [48]. The resulting "average" topology may not accurately represent any true evolutionary history, potentially obscuring important biological realities.
Propagation and Amplification of Source Tree Errors
Supertree methods are particularly vulnerable to inaccuracies in their input data, as they directly utilize phylogenetic trees rather than primary character data. This dependency creates a chain of inference where errors in source trees become embedded in the final supertree.
- Error Incorporation: Any systematic errors or biases present in individual source trees, such as those resulting from inadequate phylogenetic models or limited taxonomic sampling, are directly incorporated into the supertree analysis [47]. Unlike supermatrix approaches that can reassess primary character data, supertrees lack mechanisms for correcting underlying source tree inaccuracies.
- Data Dependency Issues: Many supertree constructions combine source trees derived from overlapping molecular datasets, creating non-independent data points that are weighted multiple times in the analysis [47]. This dependency can artificially reinforce certain phylogenetic signals while diminishing others, potentially leading to skewed results.
Table 1: Core Limitations of Supertree Methods in Phylogenetic Inference
| Limitation Category | Specific Mechanism | Impact on Phylogenetic Inference |
|---|---|---|
| Information Loss | Reduction of trees to binary matrices in MRP | Loss of branch support metrics and evolutionary model parameters |
| Consensus approaches to resolve conflict | Oversimplification of complex evolutionary histories | |
| Error Propagation | Direct use of source tree topologies | Amplification of systematic errors from individual analyses |
| Dependency on tree inputs rather than primary data | Inability to correct underlying source tree inaccuracies | |
| Methodological Constraints | Lack of evolutionary models for tree combination | Inconsistent statistical foundation for inference |
| Inadequate handling of missing data | Reduced accuracy with limited taxonomic overlap |
Experimental Evidence and Case Studies
Genomic Evolution Simulation Study
A simulation-based study evaluated the performance of MRP supertree methods in recovering known viral genomic phylogenies. Using the Artificial Life Framework (ALF), researchers simulated genomic evolution based on a trimmed bat coronavirus sequence as the root, with settings that included variable mutation rates across genes and lateral gene transfer events to reflect realistic evolutionary scenarios in RNA viruses [49].
The simulation results demonstrated that while MRP supertree methods could recover general phylogenetic structure, they exhibited reduced resolution at deeper branching patterns compared to supermatrix approaches. Specifically, the MRP pseudo-sequence supertree showed lower bootstrap support for ancient divergences, indicating that the method lost critical signal when integrating across multiple gene trees. This limitation was particularly pronounced when source trees contained conflicting signals due to differential evolutionary rates among genes [49].
SuperTRI: A Novel Approach for Assessing Reliability
The development of the SuperTRI method specifically addressed limitations in traditional supertree approaches for the family Bovidae (82 taxa, 7 genes) [3]. This method introduced a novel framework that incorporates branch support analyses from independent datasets to evaluate node reliability using three distinct measures:
- Supertree Bootstrap percentage
- Mean branch support (average Bootstrap percentage or posterior probability from separate analyses)
- Reproducibility index
When compared to supermatrix analyses using Bayesian inference, maximum likelihood, and parsimony methods, SuperTRI demonstrated less sensitivity to the choice of phylogenetic method and provided more accurate interpretation of taxonomic relationships [3]. The comparison revealed that traditional supermatrix approaches showed systematic errors in cases of significant conflict between gene trees, while the SuperTRI supertree approach better accommodated these conflicts without forcing resolution. This case study highlights how incorporating additional support metrics can partially mitigate, but not fully eliminate, the inherent limitations of supertree methods.
Table 2: Experimental Comparison of Supertree and Supermatrix Performance
| Study System | Method Compared | Accuracy Metric | Key Finding |
|---|---|---|---|
| Viral genomic evolution (SARS-CoV-2) [49] | MRP supertree vs. Supermatrix | Resolution of deep branches | Supermatrix showed superior resolution of ancient divergences |
| Bovidae phylogeny (7 genes, 82 taxa) [3] | SuperTRI vs. Supermatrix | Method sensitivity & topological accuracy | SuperTRI showed less sensitivity to phylogenetic methods |
| Carnivore phylogeny (286 species) [47] | MRP supertree vs. Supermatrix | Topological congruence | Generally concordant relationships with some significant differences |
| Prokaryotic phylogeny [1] | Supertree vs. Supermatrix | Taxonomic congruence | 98.2% congruence despite different marker gene sets |
Methodological Comparisons
Supertree vs. Supermatrix Workflows
The fundamental differences between supertree and supermatrix approaches are evident in their methodological workflows, which directly impact their susceptibility to information loss and error propagation.
The supertree workflow (red) begins with the construction of individual source trees, which are then encoded into a matrix representation before final tree construction. This multi-step process introduces multiple points where information can be lost, particularly during the matrix encoding phase where complex phylogenetic information is reduced to binary states. In contrast, the supermatrix approach (green) works directly with primary sequence data throughout the analysis, maintaining more complete phylogenetic information and allowing the application of sophisticated evolutionary models across the entire dataset [1] [47].
Performance in Prokaryotic Phylogenetics
In prokaryotic phylogenetics, both supertree and supermatrix methods have been employed for large-scale phylogenetic reconstruction, with each demonstrating distinct strengths and limitations. A direct comparison of bacterial supertree and supermatrix methods revealed 98.2% taxonomic congruence despite being based on different sets of marker genes [1]. This high level of agreement suggests that both methods can capture similar broad-scale evolutionary relationships.
However, important differences emerge in specific analytical contexts:
- Handling Missing Data: Supertree methods can accommodate datasets with substantial missing taxa across genes, as they do not require all genes to be present in every genome [2]. This makes them particularly useful for integrating data from diverse sources with incomplete overlap.
- Computational Efficiency: Recent implementations like EasyCGTree have made supertree construction more accessible, with the ability to handle hundreds of genomes using tools like wASTRAL [2]. Supertree methods generally require less memory than supermatrix approaches for comparable taxonomic samples.
- Model-Based Analysis: Supermatrix methods allow the application of complex evolutionary models to the entire concatenated alignment, potentially providing more statistical robustness in phylogenetic inference [47]. Supertree methods traditionally lacked comparable statistical foundations, though newer approaches like matrix representation with likelihood (MRL) are addressing this limitation [47].
Emerging Solutions and Methodological Advances
Improved Supertree Algorithms
Recent computational advances have sought to address the traditional limitations of supertree methods through more sophisticated algorithms:
Weighted Approaches: Methods like weighted TREE-QMC incorporate gene tree branch lengths and support values to weight quartets during supertree construction, improving robustness to gene tree incompleteness and estimation errors [50]. This weighting scheme helps mitigate information loss by preserving more phylogenetic signal from the source trees.
Chronological Supertree Algorithm (Chrono-STA): This novel approach integrates divergence times from molecular timetrees to build supertrees, using temporal data to improve accuracy when taxonomic overlap between source trees is extremely limited [10]. By incorporating chronological information, Chrono-STA can resolve relationships that remain ambiguous in traditional supertree methods.
Spectral Cluster Supertree (SCS): A recently developed method that replaces the min-cut step in traditional algorithms with a spectral clustering approach, substantially improving scalability and topological accuracy for problems involving thousands of taxa and hundreds of source trees [51]. SCS can process datasets with 10,000 taxa and approximately 500 source trees in approximately 20 seconds, representing a significant computational advance over earlier methods.
Integrated Frameworks
The distinction between supertree and supermatrix approaches has blurred with the development of hybrid methods that incorporate elements of both strategies:
Mega-Phylogeny Approach: This modified supermatrix method uses databased sequences alongside taxonomic hierarchies to construct extremely large trees with denser matrices than traditional supermatrices [36]. The approach has been successfully applied to build phylogenies for Asterales containing 4,954 species and green plants with 13,533 species, demonstrating scalability to taxonomically broad problems.
SuperTRI Framework: By incorporating multiple measures of node reliability from separate analyses, this approach provides a more comprehensive assessment of phylogenetic uncertainty than traditional supertree methods [3]. The framework allows researchers to identify cases where supertree and supermatrix approaches yield conflicting results, prompting further investigation into the biological or methodological causes of these discrepancies.
Practical Implementation and Research Tools
Essential Research Reagents and Computational Tools
Table 3: Key Research Reagents and Computational Tools for Supertree Construction
| Tool/Resource | Type | Primary Function | Application in Supertree Research |
|---|---|---|---|
| PhyML [49] | Software tool | Maximum likelihood phylogenetic analysis | Construction of source trees for supertree analysis |
| MRP [49] [47] | Algorithm | Matrix representation with parsimony | Classic supertree construction from source topologies |
| Clann [49] [3] | Software package | Supertree construction & analysis | Implementation of multiple supertree algorithms |
| EasyCGTree [2] | Software pipeline | Phylogenomic analysis | User-friendly supertree & supermatrix construction |
| OrthoMCL [49] | Algorithm | Orthologous group identification | Defining gene sets for source tree construction |
| Weighted TREE-QMC [50] | Algorithm | Weighted quartet-based supertree | Handling gene tree incompleteness and errors |
| Spectral Cluster Supertree [51] | Algorithm | Scalable supertree construction | Large-scale problems with thousands of taxa |
| bac120/ar122 gene sets [2] | Molecular marker set | Core gene identification | Standardized gene sets for prokaryotic phylogeny |
Supertree methods remain valuable tools for phylogenetic inference, particularly when integrating datasets with limited taxonomic overlap or combining information from diverse sources. However, their limitations regarding information loss during tree integration and susceptibility to source tree inaccuracies present significant challenges for prokaryotic phylogeny research. The continued development of weighted algorithms, chronological integration, and hybrid approaches represents promising directions for addressing these limitations. For the foreseeable future, a pluralistic approach that applies both supertree and supermatrix methods to important phylogenetic problems, followed by careful comparison of their results, will provide the most robust pathway to resolving evolutionary relationships in prokaryotes and other organisms. As methodological improvements continue to enhance both strategies, researchers should select approaches based on their specific dataset characteristics and biological questions, rather than adhering to a single methodological paradigm.
In the reconstruction of evolutionary histories, particularly for prokaryotes, researchers primarily employ two strategies for combining multi-locus datasets: the supermatrix (or combined analysis) and supertree approaches. A fundamental challenge inherent to both methods is the incomplete sampling of genes across taxa, resulting in missing data. The pattern and extent of these missing data directly impact the accuracy of the inferred phylogenetic trees. This guide objectively compares how supertree and supermatrix frameworks manage missing data, supported by experimental findings, to inform researchers and drug development professionals in their phylogenetic endeavors.
Strategic Approaches to Missing Data
The supertree and supermatrix methods employ fundamentally different philosophies and mechanisms for handling missing data, which in turn influences their application, advantages, and limitations.
Supertree Approach Supertree methods, such as Matrix Representation with Parsimony (MRP), operate indirectly. They combine phylogenetic information from a collection of pre-estimated source trees (e.g., gene trees) into a single comprehensive species tree [49] [41]. Their primary strength lies in an accommodation-based strategy for missing data.
- Mechanism: A species absent from a particular source tree simply does not contribute to the analysis of that tree. The method relies on the overlapping taxa between different source trees to "glue" the phylogeny together [41].
- Advantage: This allows for the integration of highly heterogeneous datasets with extremely limited taxonomic overlap, a common scenario in real-world research. A novel approach, the Chronological Supertree Algorithm (Chrono-STA), further leverages divergence times from published timetrees to merge species, demonstrating efficacy even when the average number of species shared between any two input trees is less than one [10].
- Limitation: The method does not use the primary character data directly, which can lead to issues like data independence and "signal enhancement," where the supertree displays relationships not present in any source tree [36].
Supermatrix Approach In contrast, the supermatrix method uses a direct analysis strategy. It involves concatenating multiple sequence alignments from different genes into a single large data matrix, which is then analyzed using standard phylogenetic methods [52] [41].
- Mechanism: Missing data entries are represented as gaps or ambiguous characters in the final concatenated alignment. The analysis proceeds with these missing entries, and modern model-based methods (e.g., Maximum Likelihood) attempt to handle them during tree inference.
- Advantage: It allows for simultaneous analysis of all character data, which can help overcome stochastic error and provide a more robust estimate of phylogeny when the model of evolution is adequate [40] [36].
- Limitation: Highly fragmented matrices with over 95% missing data are not uncommon, which can increase the risk of systematic errors and phylogenetic artefacts if not managed carefully [36] [44].
Table 1: Strategic Comparison of Supertree and Supermatrix Methods
| Feature | Supertree Approach | Supermatrix Approach |
|---|---|---|
| Core Strategy | Accommodation; combines source trees | Direct analysis; concatenates sequences |
| Handling Missing Data | Integrates trees with non-overlapping taxa | Includes gaps/ambiguities in the alignment |
| Primary Data Used | Topologies (and sometimes branch supports) of source trees | Original molecular sequence characters |
| Typical Output | Topology (branch lengths often require secondary analysis) | Topology with branch lengths |
| Scalability | High; can assemble very large trees from smaller studies | Computationally intensive for very large datasets |
Quantitative Comparison of Method Performance
Simulation studies provide critical insights into the performance of these methods under controlled conditions with known evolutionary histories. A key simulation study, SMIDGen, was designed to reflect biological reality and systematic practice more closely than earlier efforts. It modeled gene birth-death processes and created "clade-based" source trees to mimic how systematists sample taxa [41].
Table 2: Performance Comparison Based on Simulation Studies (SMIDGen)
| Method | Topological Accuracy (Relative to True Model Tree) | Key Conditioning Factors | Notable Findings |
|---|---|---|---|
| Combined Analysis (Maximum Likelihood) | High | N/A | Consistently outperformed supertree methods in simulations [41] |
| Combined Analysis (Maximum Parsimony) | Medium | N/A | Was slightly outperformed by weighted MRP in one older study [41] |
| MRP Supertree | Medium to Low | Requires rooted input trees | Accuracy decreases when the largest source tree does not contain most taxa [41] |
| Weighted MRP Supertree | Medium | Uses branch supports (e.g., bootstrap) for weighting | Can improve upon standard MRP, but still less accurate than ML combined analysis [41] |
| Chrono-STA Supertree | High (for limited-overlap data) | Requires time-scaled input trees | Effective for data with minimal species overlap where other supertree methods fail [10] |
The overarching finding from modern simulations is that combined analysis based on Maximum Likelihood generally outperforms supertree methods like MRP and weighted MRP in terms of topological accuracy [41]. This is attributed to the direct use of character data and the application of a statistically consistent optimality criterion. However, supertree methods remain vital for contexts where a combined analysis is not feasible, such as when only source trees are available or when combining data from incompatible types [41].
Experimental Protocols for Managing Missing Data
Protocol 1: Supermatrix Construction with EasyCGTree
The EasyCGTree pipeline offers a user-friendly, cross-platform protocol for prokaryotic phylogenomic analysis using both supermatrix and supertree approaches [2].
- Input Preparation: Provide the pipeline with FASTA-formatted amino acid sequences (proteomes) of the prokaryotic genomes of interest.
- Homolog Identification: Specify a profile Hidden Markov Model (HMM) of a core gene set (e.g.,
bac120for Bacteria). The pipeline useshmmsearchto identify homologous sequences in each proteome. - Hit Filtration and Clustering: Filter the top hit for each gene based on an E-value threshold. Exclude genomes with too few detected genes and genes with low prevalence across the dataset.
- Multiple Sequence Alignment (MSA): Align the sequences within each gene cluster using MUSCLE (Windows) or Clustal Omega (Linux).
- Alignment Trimming: Trim the alignments to remove poorly aligned regions using
trimAlwith an automatic method likestrictplusto select conserved blocks. - Supermatrix Assembly: Concatenate all trimmed single-gene alignments into a supermatrix. This matrix will inherently contain missing data for genes absent in any given genome.
- Phylogeny Inference: Infer the final phylogeny from the supermatrix using a maximum-likelihood method such as IQ-TREE or FastTree [2].
Protocol 2: MRP Supertree Construction for Viral Evolution
This protocol, applied to study the evolution of SARS-CoV-2, outlines the construction of an MRP pseudo-sequence supertree [49].
- Dataset Construction: Download full-length genomic sequences and protein-coding sequences (CDSs) for the taxa of interest.
- Ortholog Grouping: Organize CDSs into groups of orthologous proteins using a tool like OrthoMCL, removing repeated sequences.
- Source Tree Estimation: For each group of orthologous genes, perform a multiple sequence alignment and construct a source phylogenetic tree using Maximum Likelihood (e.g., with PhyML) with bootstrap support.
- Matrix Representation: Convert each source tree into a matrix representation (Baum-Ragan matrix). For each clade in the source trees with significant bootstrap support (e.g., >55%), assign a binary state (A or T) to the taxa.
- Pseudo-sequence Supermatrix Assembly: Assemble the binary representations from all source trees into a single supermatrix of pseudo-sequences.
- Supertree Inference: Reconstruct the final supertree from the pseudo-sequence supermatrix using a phylogenetic inference method like PhyML, treating the A/T substitutions equally [49].
Workflow Visualization
The following diagram illustrates the core strategic differences and workflows for handling missing data in the supertree and supermatrix approaches.
The Scientist's Toolkit: Essential Research Reagents and Solutions
Successful management of missing data in phylogenomics relies on a suite of bioinformatics tools and resources. The following table details key solutions used in the protocols and studies cited herein.
Table 3: Key Research Reagent Solutions for Phylogenomic Analysis
| Tool/Resource | Primary Function | Role in Managing Missing Data |
|---|---|---|
| EasyCGTree [2] | An all-in-one pipeline for prokaryotic phylogenomics. | Automates the core gene workflow for both supermatrix and supertree (via ASTRAL) construction, handling data filtration and alignment. |
| Chrono-STA [10] | A novel supertree algorithm. | Uses node ages from timetrees to merge species clusters, specifically designed for datasets with extremely limited species overlap. |
| Clann [10] [49] | Software for supertree inference. | Implements several supertree methods (e.g., MRP, MSSA) to combine source trees with partial taxon sets. |
| Profile HMMs (e.g., bac120, UBCG) [2] | Statistical models of protein families. | Used to identify homologous genes across diverse genomes, forming the basis for core gene sets and reducing annotation errors that exacerbate missing data issues. |
| IQ-TREE / RAxML [49] [2] [41] | Maximum Likelihood phylogenetic inference. | Used to infer source trees and analyze supermatrices; their model-based frameworks help account for heterogeneous sequence evolution in incomplete matrices. |
| trimAl / BMGE [2] [44] | Alignment trimming tools. | Remove unreliably aligned regions from gene alignments before concatenation, reducing noise and systematic error in supermatrices. |
In the field of prokaryotic phylogenomics, reconstructing the evolutionary history of organisms is a fundamental endeavor. Two principal computational strategies have emerged for building comprehensive phylogenetic trees from molecular sequence data: the supermatrix (SM) and supertree (ST) approaches [43] [36]. The supermatrix method, often termed "concatenation," involves combining multiple sequence alignments from different genes into a single, large alignment from which a phylogeny is inferred [38]. In contrast, the supertree method involves inferring phylogenetic trees for individual genes and then combining these source trees into a single, more comprehensive phylogeny [53] [54]. The choice between these methodologies presents a significant strategic decision for researchers, as each offers distinct advantages and faces specific challenges concerning data preparation, alignment, computational demand, and biological accuracy. This guide provides a detailed, evidence-based comparison of these methods, focusing on their application in prokaryotic research, to help scientists optimize their phylogenetic workflows.
Core Methodologies and Experimental Protocols
The Supermatrix (Concatenation) Workflow
The supermatrix approach reduces stochastic errors by combining weak phylogenetic signals from multiple genes into a single, powerful analysis [43]. A typical supermatrix pipeline, as implemented in tools like EasyCGTree, involves several key stages [43]:
- Homolog Identification: Profile Hidden Markov Models (HMMs) of core gene sets (e.g.,
bac120for Bacteria) are used to search against proteomes withhmmsearch(E-value cutoff often defaults to1e-10) [43]. - Sequence Selection and Filtering: The top hit for each gene is selected. Genomes with an insufficient number of detected genes and genes with low prevalence across the dataset are filtered out based on user-defined cutoffs [43].
- Multiple Sequence Alignment (MSA): Homologs of the selected genes are retrieved and aligned using tools like
MUSCLEorClustal Omega[43]. - Alignment Trimming: Tools like
trimAlare employed with automatic methods (e.g.,gappyout,strict) to select conserved alignment segments and remove poorly aligned regions [43]. - Matrix Concatenation and Tree Inference: The trimmed alignments for each gene are concatenated into a supermatrix. Finally, a phylogenetic tree is inferred from this matrix using maximum-likelihood programs such as
IQ-TREEorFastTree[43].
The following diagram illustrates the logical flow and key decision points in a standard supermatrix pipeline:
The Supertree Workflow
Supertree methods prevent the combination of genes with incompatible phylogenetic histories, which can be caused by biological events like horizontal gene transfer (HGT) [43] [49]. A common supertree method is Matrix Representation with Parsimony (MRP) [55] [49]. The steps for an MRP pseudo-sequence supertree analysis are:
- Individual Gene Tree Inference: Orthologous gene sets are identified, aligned, and used to infer a maximum-likelihood phylogenetic tree for each gene individually [49].
- Matrix Representation: Each source gene tree is converted into a matrix representation. Clades within each tree are coded as binary characters (pseudo-sequences), often incorporating bootstrap support values to weight the importance of each clade [55] [49].
- Supertree Construction: The pseudo-sequence matrices from all genes are combined. A final supertree is then reconstructed from this combined matrix using parsimony or maximum-likelihood criteria [49].
The diagram below outlines the process of constructing a supertree from individual gene trees:
Comparative Performance Analysis
Direct comparisons of supertree and supermatrix methods on the same dataset provide the most objective measure of their performance. A landmark study on palms (Arecaceae) and subsequent research in other domains offer critical experimental data.
Table 1: Quantitative Comparison of Supertree and Supermatrix Performance on a Palm Dataset (Baker et al. 2009) [55] [56]
| Performance Metric | Supermatrix (Concatenation) | Standard MRP Supertree (Bootstrap-Weighted) | Irreversible MRP Supertree |
|---|---|---|---|
| Total Clades in Final Tree | 204 (maximum) | Highly Resolved | Highly Resolved |
| Clades Shared with Supermatrix Tree | — | 137 clades | Fewer than standard MRP |
| Unsupported Clades | Standard bootstrap measures apply | Fewest among supertree variants | Up to 13% of clades |
| Congruence with Supermatrix | Benchmark | Greatest congruence | Lower congruence |
| Handling of Non-Independent Data | Not applicable | Acceptable trade-off for performance | No obvious benefit |
Table 2: Performance in Prokaryotic and Viral Phylogenomics
| Study / Organism | Method | Reported Outcome | Key Advantage |
|---|---|---|---|
| Prokaryotes (Lang et al. 2013) [38] | Supermatrix (Concatenation) & Bayesian Concordance (BUCKy) | Both methods yielded similar results, agreeing with 16S rRNA taxonomy. | Concatenation is the current best practice for a single reference phylogeny. |
| SARS-CoV-2 (Song et al. 2020) [49] | MRP Pseudo-sequence Supertree | Disputed the common ancestor status of RaTG13, implied by genome-based trees. Provided more detailed evolution inference. | Superior resolution power; avoids bias from unequal gene sizes in full-length genome analysis. |
| Prokaryotes (CGCPhy) [57] | Supermatrix-based with HGT filtering | High accuracy in agreement with Bergey's taxonomy; low standard deviation across datasets. | Effectively mitigates the confounding effect of horizontal gene transfer. |
Optimization Checklist: Best Practices
Data Preparation
- Define a Core Gene Set: For prokaryotes, use standardized, curated sets of single-copy, ubiquitous genes to ensure orthology. Common sets include
bac120/ar122[43],UBCG[43] [38], orrpgenes for ribosomal proteins [43]. Custom gene sets can be developed for specific taxonomic groups [43]. - Filter for Orthology and Quality: Employ reciprocal best BLAST hits and tools like
OrthoMCLto establish orthologous groups [57] [49]. Filter out genomes with poor completeness or genes with very low prevalence across the dataset [43]. - Identify and Address HGT: For supermatrix constructions, proactively identify and eliminate genes with signatures of potential horizontal gene transfer, such as those that are highly conserved across distant species or located on genomic fragments with abnormal sequence composition (genome barcode) [57].
Alignment and Trimming
- Use Profile-Based Alignment: For consistency across a diverse taxonomic range, use alignment tools that leverage profile HMMs (e.g.,
hmmalign) or accurate aligners likeMAFFTwith theL-INS-ialgorithm [49] [38]. - Apply Automated Trimming: Always trim multiple sequence alignments to remove noisy regions. The
strictalgorithm intrimAl(which combinesgappyoutwith a similarity threshold) is a robust default choice, though testing different methods (gappyout,strictplus) is recommended [43].
Model and Method Selection
- Choose Your Method Based on Project Goals:
- For a single, well-supported reference tree and when computational resources allow, a supermatrix approach is generally recommended, as it often produces trees with high resolution and support [55] [38].
- To explore conflicting evolutionary signals or when analyzing datasets with widespread gene tree incongruence (e.g., due to HGT), a supertree approach is more appropriate, as it does not force a single history on all genes [43] [49].
- Use Weighted Matrix Representations in Supertrees: If constructing a supertree using MRP, prefer standard MRP with bootstrap-weighted matrix elements over irreversible MRP, as it yields greater congruence with supermatrix trees and fewer unsupported clades [55].
- Leverage Efficient ML Software: For tree inference from supermatrices, use fast and effective maximum-likelihood programs such as
IQ-TREEorFastTree[43].
The Scientist's Toolkit
Table 3: Essential Software and Data Resources for Phylogenomic Analysis
| Resource Name | Type | Primary Function | Application Context |
|---|---|---|---|
| EasyCGTree [43] | Software Pipeline | All-in-one automatic pipeline for phylogenomic tree inference. | User-friendly, cross-platform tool for both SM and ST analyses. |
| IQ-TREE [43] | Software Tool | Maximum likelihood phylogenetic inference. | Fast and accurate tree building from supermatrices or alignments. |
| trimAl [43] | Software Tool | Automated alignment trimming. | Removing spurious sequences and improving alignment quality. |
| HMMER (hmmsearch) [43] | Software Tool | Homology search using profile HMMs. | Identifying orthologous genes in proteomic datasets. |
| BUCKy [38] | Software Tool | Bayesian Concordance Analysis. | Estimating a primary concordance tree from multiple gene trees. |
| Core Gene Sets (e.g., bac120, UBCG) [43] | Data Resource | Pre-defined sets of universal single-copy genes. | Standardized data preparation for prokaryotic phylogenomics. |
| DOOR Database [57] | Data Resource | Prokaryotic operon annotations. | Providing genomic structure information for orthology determination. |
| Bergey's Taxonomy [57] | Data Resource | Reference taxonomy for prokaryotes. | Benchmarking and validating phylogenetic results. |
Performance Showdown: Validating and Comparing Method Accuracy
The reconstruction of the evolutionary history of prokaryotes is a fundamental challenge in molecular biology and genomics. Researchers primarily rely on two computational strategies to build comprehensive species phylogenies from multiple genes or markers: the supertree approach and the supermatrix approach [30] [58]. The supertree method (late-level combination) first infers phylogenetic trees from individual gene alignments and then combines these source trees into a single supertree. In contrast, the supermatrix method (early-level combination) concatenates all gene alignments into a large multiple sequence alignment, from which a phylogeny is subsequently estimated [58]. The choice between these methodologies can significantly impact the resulting phylogenetic tree and subsequent biological interpretations, especially in prokaryotic phylogeny where issues like horizontal gene transfer and missing data are prevalent [18]. This guide objectively compares the performance of these methods under controlled model conditions, drawing on evidence from simulation studies to inform researchers and drug development professionals.
Methodological Frameworks
Core Principles of Supertree and Supermatrix Methods
- Supertree Methods: These are late-level combination techniques. The process involves independently estimating a phylogenetic tree for each gene or marker. These source trees are then combined using a specific algorithm to produce a comprehensive supertree that includes all taxa from the input trees [58]. A widely used supertree method is Matrix Representation with Parsimony (MRP), which encodes the source trees into a binary matrix representation and then uses parsimony heuristics to find a supertree that implies the smallest number of evolutionary changes for this matrix [30] [49]. The Robinson-Foulds (RF) supertree method is another approach that seeks the binary supertree minimizing the sum of RF distances to the input trees, effectively maximizing shared clades [59].
- Supermatrix Methods: Also known as combined analysis or concatenation, this is an early-level combination approach. It merges all individual gene alignments into a single, large superalignment, with gaps inserted for missing data [58]. Standard phylogenetic inference methods, such as Maximum Likelihood (ML) or Maximum Parsimony (MP), are then applied to this supermatrix to estimate the species tree [30] [12]. This method assumes that all genes share the same underlying tree topology.
The following workflow illustrates the fundamental procedural differences between these two approaches as commonly implemented in simulation studies:
Simulation Study Design and Protocols
Simulation studies allow for the comparison of phylogenetic methods against a known model tree, enabling an objective assessment of accuracy. A key advancement in this area is the Super-Method Input Data Generator (SMIDGen), a novel simulation methodology designed to better reflect biological processes and the practices of systematists [30]. Earlier simulation techniques often selected taxa for source trees randomly from the model tree, which does not mirror how systematists typically conduct studies. SMIDGen, however, generates datasets that include a mix of "clade-based" studies (with dense taxon sampling within a specific subgroup) and broader "scaffold" phylogenies, creating a more realistic pattern of missing data and taxonomic overlap [30].
A typical simulation protocol involves several key stages [58]:
- Model Tree Generation: A model species tree is generated, often assuming a Yule branching process.
- Sequence Simulation: DNA or protein sequences are evolved along the model tree under specified evolutionary models and conditions. Parameters like substitution rates and gene tree incongruence can be varied to simulate different biological scenarios, including gene-specific evolution and incomplete lineage sorting.
- Taxon Deletion: A proportion of taxa may be randomly or non-randomly deleted from the gene alignments to simulate realistic patterns of missing data.
- Phylogeny Reconstruction: Both supertree and supermatrix methods are applied to the simulated datasets.
- Accuracy Assessment: The resulting trees from each method are compared to the known model tree, typically using metrics like the Robinson-Foulds (RF) distance, which measures the topological dissimilarity between two trees [59] [58].
Comparative Performance Analysis
Topological Accuracy Under Varying Conditions
Simulation studies consistently demonstrate that the supermatrix approach, particularly when using Maximum Likelihood (ML) for inference, generally outperforms supertree methods in topological accuracy across a wide range of conditions. This superiority holds even when the data contain substantial amounts of missing sequences [58]. One major study found that supermatrix (combined analysis) based on ML "consistently outperformed all other methods with respect to topological accuracy," giving especially large improvements in scenarios where the largest source tree did not contain a majority of the taxa [30].
The performance gap between methods can be influenced by the level of incongruence among gene trees, which may arise from biological events like incomplete lineage sorting or horizontal gene transfer. In conditions of low to moderate gene tree conflict, the supermatrix approach is less susceptible to stochastic errors and provides more robust results because it uses the raw character data directly [58]. However, some studies suggest that in the presence of very high and realistic levels of incongruence among gene trees, supertree and other combination methods can sometimes show better performance than the superalignment approach, as they do not assume a single underlying topology for all genes [58].
The table below summarizes key quantitative findings from major simulation studies:
Table 1: Summary of Simulation Study Findings on Topological Accuracy
| Study Focus | Simulation Conditions | Supertree Method Performance | Supermatrix Method Performance | Key Metric |
|---|---|---|---|---|
| General Performance [30] [12] | Varying taxon sampling, model trees with 100-1000 taxa. | MRP and weighted MRP produced "distinctly less accurate trees". Some methods worse than a single gene tree. | Significantly shorter trees and superior topological accuracy. ML-based combined analysis was best. | Robinson-Foulds distance, tree length under parsimony. |
| Gene Tree Incongruence [58] | Varying levels of conflict between gene trees. | Can outperform superalignment in the presence of very high gene-tree conflict. | Usually outperforms other approaches, but susceptible to error from high conflict. | Robinson-Foulds distance to model tree. |
| Data Completeness [58] | Sparse data; genes present in only a subset of taxa. | Susceptible to stochastic error from estimating trees on incomplete data. | Less susceptible to stochastic error; usually outperforms others with sparse data. | Robinson-Foulds distance to model tree. |
Computational Tractability and Run-Time
For phylogenomic studies involving hundreds to thousands of taxa, the computational time required for analysis is a significant practical consideration. It has been proposed that supertree approaches could offer a more computationally tractable pathway for analyzing very large datasets [12]. The idea is to break the problem into many smaller, more manageable locus-specific tree searches and then stitch the results together.
However, evidence from studies using real organismal datasets challenges this assertion. One study comparing run-times for 20 multilocus datasets found that the processing time for a supermatrix search was "significantly lower than SuperFine [a supertree method] + locus-specific search but roughly equivalent to that of SuperTriplets [another supertree method] + locus-specific search" [12]. This suggests that there is no consistent time-tractability advantage for supertree methods over a supermatrix approach for standard phylogenomic datasets.
Advanced Supertree Applications and Niche Advantages
Despite the general performance advantage of supermatrix methods, supertree approaches demonstrate unique value in specific research contexts, particularly in prokaryotic phylogeny and the analysis of viral evolution.
In prokaryotic evolution, where a widely accepted phylogeny has been based on SSU rRNA, phylogenies from alternative genes often conflict, suggesting a single gene history may not represent organismal history [18]. While supermatrix methods using large concatenated gene sets are employed, they require a small, shared fraction of genes across all organisms. Supertree methods offer an alternative. For instance, a whole-proteome feature frequency profile (FFP) phylogeny, a type of alignment-free supertree method, was used to analyze 884 prokaryotes, showing clear separation of Archaea, Bacteria, and Eukaryota, and proposing a different branching order for major groups compared to other methods [18].
Similarly, the supertree approach has proven powerful in resolving detailed viral evolution, as demonstrated in a study of SARS-CoV-2. Different genes within the SARS-CoV-2 genome can yield conflicting phylogenetic trees. The MRP pseudo-sequence supertree method was able to integrate phylogenetic signals from all genes of SARS-CoV-2, providing a more resolved phylogeny that contested the placement of bat coronavirus RaTG13 as the direct ancestor and revealed detailed patterns of mutation and evolution that were obscured in full-genome maximum likelihood trees [49]. The following diagram illustrates this application's specialized workflow:
The Scientist's Toolkit: Essential Research Reagents and Solutions
The experimental workflows and simulation studies referenced rely on a suite of software tools and algorithmic solutions. The following table details key resources that constitute the essential "research reagent solutions" for scientists working in this field.
Table 2: Key Research Reagents and Computational Tools for Phylogenomic Inference
| Tool/Algorithm Name | Type | Primary Function in Analysis | Relevant Context of Use |
|---|---|---|---|
| SMIDGen [30] | Software/Protocol | Generates realistic simulated phylogenomic datasets with clade-based and scaffold taxon sampling. | Testing and comparing supertree/supermatrix method performance under realistic conditions. |
| MRP (Matrix Representation with Parsimony) [30] [49] | Algorithm | Encodes source trees into a binary matrix, solved with parsimony heuristics to build a supertree. | Standard supertree construction; used in viral (SARS-CoV-2) and prokaryotic phylogeny. |
| RF (Robinson-Foulds) Supertree [59] | Algorithm | Finds a supertree that minimizes the total RF distance to the set of input trees. | An alternative supertree optimality criterion aiming to maximize shared clades. |
| AMPHORA [60] | Automated Pipeline | Performs high-throughput, automated phylogenomic inference using a database of protein phylogenetic markers. | Building genome trees for prokaryotes and phylotyping metagenomic data. |
| FFP (Feature Frequency Profile) [18] | Algorithm (Alignment-free) | Represents whole proteomes by l-mer frequency profiles to build phylogenies without gene alignment. | Whole-proteome phylogeny of prokaryotes, especially when shared orthologous genes are few. |
| CADM Test [61] | Statistical Test | Tests the null hypothesis of complete incongruence among multiple distance matrices or trees. | Assessing congruence among genes prior to data combination in phylogenomics. |
| PAUP* / TNT [59] [12] | Software | Implements phylogenetic inference algorithms (parsimony, likelihood) for tree search and consensus. | Conducting parsimony analysis (e.g., for MRP) and heuristic tree searches on supermatrices. |
Simulation evidence provides clear guidance for researchers engaged in prokaryotic phylogeny and large-scale phylogenomic inference. The supermatrix (combined analysis) approach, particularly when employing Maximum Likelihood, is generally the preferred method for achieving the highest topological accuracy under a wide range of model conditions, including realistic patterns of missing data [30] [12] [58]. Supertree methods, while historically important and capable of handling data types beyond sequence alignment, generally produce less accurate trees for a given base method and do not consistently offer a computational advantage [30] [12].
Nevertheless, supertree methods retain critical importance in the scientist's toolkit. They are invaluable when analyzing datasets with very high gene tree incongruence or when combining information from diverse data types [58] [49]. Furthermore, as demonstrated in cutting-edge applications to prokaryotic and viral evolution, sophisticated supertree methods like MRP and whole-proteome FFP can provide unique phylogenetic insights and resolve relationships that are elusive to standard supermatrix analysis [18] [49]. The choice of method should therefore be guided by the specific biological question, the nature of the dataset, and the relative priorities of topological accuracy and methodological flexibility.
In the field of prokaryotic phylogeny research, two primary computational approaches have emerged for reconstructing evolutionary relationships from molecular data: the supertree (ST) and supermatrix (SM) methods [30]. The supertree approach involves generating individual trees from different genetic markers and then combining these source trees into a single comprehensive phylogeny. In contrast, the supermatrix method concatenates multiple sequence alignments from different markers into a large combined dataset before inferring the phylogeny [30] [62]. As both methods continue to evolve, rigorous benchmarking using organismal data becomes essential for guiding methodological choices in phylogenetic research. This comparison guide objectively evaluates these competing approaches based on empirical studies comparing tree length and topological accuracy, providing researchers with evidence-based recommendations for prokaryotic phylogeny reconstruction.
Performance Comparison: Supermatrix vs. Supertree Methods
Quantitative Comparison of Method Performance
Table 1: Comparative performance of supertree and supermatrix methods on multilocus datasets
| Method | Tree Length (parsimony score) | Computational Time | Topological Accuracy | Key Advantages |
|---|---|---|---|---|
| Supermatrix (heuristic search in TNT) | Significantly shorter trees (p < 0.0002) | Lower than SuperFine (p < 0.01), equivalent to SuperTriplets | Higher accuracy with maximum likelihood base method | Simultaneous analysis of all character data |
| Supertree (SuperFine) | Longer trees than supermatrix | Higher than supermatrix approach | Reduced accuracy compared to combined analysis | Can incorporate existing trees from literature |
| Supertree (SuperTriplets) | Longer trees than supermatrix | Equivalent to supermatrix approach (p > 0.4) | Comparable to SuperFine | More efficient for some dataset types |
| Weighted MRP Supertree | Varies by implementation | Moderate | Improved over unweighted MRP but less than combined analysis | Incorporates branch support values |
Table 2: Accuracy comparison under different simulation conditions
| Condition | Supermatrix (ML) | MRP Supertree | Weighted MRP Supertree |
|---|---|---|---|
| Standard subtree sampling | Highest accuracy | Reduced accuracy | Intermediate accuracy |
| Largest subtree contains most taxa | High accuracy | Moderate accuracy | Moderate accuracy |
| Largest subtree does not contain most taxa | Big improvement in accuracy | Distinctly less accurate | Distinctly less accurate |
| Handling of missing data | Robust with modern implementations | Variable performance | Improved over standard MRP |
Key Performance Findings
Empirical studies consistently demonstrate that supermatrix methods outperform supertree approaches in terms of both tree length and topological accuracy. A comprehensive analysis of twenty multilocus datasets revealed that supermatrix searches produce significantly shorter trees under the parsimony criterion compared to either SuperFine or SuperTriplets supertree methods (p < 0.0002) [4]. This finding is particularly relevant because shorter tree lengths under parsimony criteria generally indicate better explanatory power for the observed data.
The performance advantage of supermatrix methods is especially pronounced when using maximum likelihood as the base method. Simulation studies with more biologically realistic conditions have shown that combined analysis based on maximum likelihood "outperforms MRP and weighted MRP, giving especially big improvements when the largest subtree does not contain most of the taxa" [30]. This suggests that supermatrix approaches are more robust to uneven taxonomic sampling across genetic markers.
Regarding computational efficiency, supermatrix methods demonstrate either superior or equivalent performance compared to supertree approaches. The processing time for supermatrix search was significantly lower than SuperFine with locus-specific search (p < 0.01) and roughly equivalent to that of SuperTriplets with locus-specific search (p > 0.4) [4]. This challenges the common perception that supertree methods are necessarily more computationally efficient for very large datasets.
Experimental Protocols for Method Benchmarking
Simulation-Based Benchmarking Framework
Diagram 1: Workflow for phylogenetic method benchmarking
The experimental methodology for comparing supertree and supermatrix approaches requires careful design to ensure biological relevance. The SMIDGen framework represents a simulation approach that better reflects both biological processes and systematic practices than earlier techniques [30]. This methodology involves several critical steps:
First, researchers define a model tree that serves as the known "true" phylogeny. This tree typically includes up to 1000 sequences to reflect the scale of real-world phylogenetic problems [30]. Sequence data is then simulated along this tree under appropriate evolutionary models using tools such as INDELible, which incorporates both substitution processes and indel events [63].
A key innovation in modern benchmarking is the implementation of clade-based taxon sampling rather than random sampling. This approach reflects how systematists typically design studies - focusing on densely sampled ingroups with less dense outgroup sampling [30]. The simulation includes both "clade-based" studies representing lower-level taxonomic groups and "scaffold" phylogenies that provide broad-scale relationships for connecting the clade-based trees.
For the supertree approach, source trees are estimated from each simulated marker using standard phylogenetic methods. These source trees are then combined using supertree methods such as Matrix Representation with Parsimony or its weighted variant [30]. For the supermatrix approach, sequence alignments from all markers are concatenated into a single combined dataset before phylogenetic analysis.
Finally, topological accuracy is quantified by comparing the estimated trees to the known true tree using metrics such as Robinson-Foulds distance or other tree comparison methods [2].
Empirical Benchmarking with Organismal Data
Table 3: Essential research reagents and software for phylogenetic benchmarking
| Research Reagent/Software | Type | Function in Benchmarking | Implementation Example |
|---|---|---|---|
| INDELible | Simulation tool | Generates synthetic sequence evolution along model trees | Simulate nucleotide/amino acid sequences with indels [63] |
| SMIDGen | Simulation framework | Produces biologically realistic phylogenetic datasets | Generate source trees with clade-based taxon sampling [30] |
| RAxML | Phylogenetic inference | Implements maximum likelihood tree estimation | Reference tree construction for empirical datasets [64] |
| Profile HMMs | Computational method | Identifies homologous gene sequences across taxa | Core gene detection in pipelines like AMPHORA [60] |
| TrimAl | Alignment curation | Trims multiple sequence alignments to remove unreliable regions | Alignment quality control before phylogenetic analysis [2] |
| IQ-TREE | Phylogenetic inference | Maximum likelihood tree estimation with model selection | Supermatrix phylogeny construction [2] |
| wASTRAL | Supertree method | Coalescent-based species tree estimation from gene trees | Supertree construction in EasyCGTree pipeline [2] |
While simulation studies provide valuable insights, benchmarking with real organismal data is essential for validating findings under biologically complex conditions. Empirical benchmarking typically follows this protocol:
Researchers first select appropriate empirical datasets with known or well-supported phylogenetic relationships. These may include curated alignments from resources such as the Comparative RNA Website or other community-vetted phylogenetic references [64]. For prokaryotic phylogeny, datasets of completely sequenced genomes are particularly valuable, as they allow for both genome-wide and gene-specific phylogenetic analyses [65].
The selected datasets are then analyzed using both supertree and supermatrix workflows. For supertree construction, this involves identifying orthologous gene sets across genomes, inferring individual gene trees, and then combining them using supertree methods. For supermatrix construction, orthologous sequences are concatenated into a combined alignment before phylogenetic analysis.
A critical consideration in empirical benchmarking is the handling of missing data, which is inevitable in large-scale phylogenetic analyses. Supermatrix methods have been shown to be robust to high levels of missing data, with some successful analyses containing up to 95% missing entries [62]. However, the pattern of missingness may affect performance, with clade-based missing data (reflecting biological reality) having different impacts than random missing data.
Practical Implementation in Prokaryotic Phylogenomics
Integrated Pipelines for Phylogenomic Analysis
Several software pipelines have been developed to facilitate the implementation of both supertree and supermatrix methods in prokaryotic phylogenomics. EasyCGTree represents a user-friendly, cross-platform pipeline that implements both approaches for prokaryotic phylogenomic analysis based on core gene sets [2]. This pipeline allows researchers to directly compare supertree and supermatrix results from the same input data.
The EasyCGTree workflow begins with microbial genomic data (amino acid sequences) as input and uses profile hidden Markov models of core gene sets for homolog searching. The pipeline includes options for filtering detected genes based on prevalence across genomes and employs multiple sequence alignment using either MUSCLE (Windows) or Clustal Omega (Linux) [2]. Alignments are then trimmed using trimAl before phylogeny inference.
For supermatrix construction, EasyCGTree concatenates the trimmed alignments into a supermatrix, which is then analyzed using either FastTree or IQ-TREE. For supertree construction, the pipeline generates individual gene trees which are then combined using wASTRAL [2]. This integrated approach facilitates direct comparison between methods using identical input data and preprocessing steps.
Emerging Methods and Future Directions
Recent advances in phylogenetic methodology include the development of machine learning approaches for tree inference. Deep convolutional neural networks have been trained to infer quartet topologies from multiple sequence alignments, showing high accuracy on simulated data and robustness to challenging regions of parameter space such as the Felsenstein zone [63]. These methods can naturally incorporate indel information and may provide complementary approaches to traditional methods.
Similarly, deep learning frameworks have been applied to the estimation of branch lengths, demonstrating superior performance in some difficult regions of parameter space compared to maximum likelihood methods [66]. These approaches show particular promise for accurately estimating long branches associated with distantly related taxa.
As phylogenetic datasets continue to grow in size and complexity, benchmarking resources become increasingly important for method development and evaluation. Publicly available benchmark datasets and software tools enable systematic evaluation of alignment and tree inference methods on difficult datasets [64]. These resources include both empirical datasets with carefully curated alignments and simulated datasets with known true trees, providing essential testbeds for comparing supertree and supermatrix approaches.
Based on comprehensive benchmarking studies, supermatrix methods generally outperform supertree approaches in terms of topological accuracy and tree length criteria when applied to organismal data. The performance advantage is particularly evident when using maximum likelihood as the base method and when taxon sampling across markers is uneven [30] [4].
However, supertree methods remain valuable in situations where combined analysis is not feasible, such as when only source trees are available or when combining data types that cannot be analyzed simultaneously in a supermatrix framework [30]. Weighted variants of MRP show improved performance over unweighted MRP, though still not matching the accuracy of supermatrix approaches.
For researchers working with prokaryotic genomes, integrated pipelines such as EasyCGTree provide practical tools for implementing both approaches and comparing results [2]. As phylogenetic methods continue to evolve, particularly with the incorporation of machine learning techniques, ongoing benchmarking using both simulated and empirical data will remain essential for guiding methodological choices in prokaryotic phylogeny research.
The rapid emergence of SARS-CoV-2 underscored the critical need for robust phylogenetic methods to trace its origin and evolutionary trajectory. Traditional phylogenetic approaches, often relying on single genes or full-length genomic sequences, faced significant limitations in resolving the complex evolutionary relationships of coronaviruses. This case study examines how supertree analysis, specifically the Matrix Representation with Parsimony (MRP) pseudo-sequence method, provided superior resolution for understanding SARS-CoV-2 evolution compared to conventional methods, with direct implications for prokaryotic phylogeny research where similar analytical challenges exist.
Methodological Comparison: Supertree vs. Supermatrix Approaches
In phylogenetic research, two primary methods exist for combining multiple gene datasets: the supermatrix approach (concatenating aligned sequences into one large matrix) and the supertree approach (combining individual gene trees into a comprehensive phylogeny). For complex organisms and viruses with large genomic datasets, each method presents distinct advantages and limitations.
Table 1: Comparison of Phylogenetic Reconstruction Methods
| Method | Core Principle | Advantages | Limitations | Best Application Context |
|---|---|---|---|---|
| MRP Supertree | Combines source trees from different genes using matrix representation and parsimony [49] | Integrates phylogenetic information from all available genes; handles missing data and incompatible sequences; reveals conflicts between gene trees [49] | Potential loss of information from source trees; computationally intensive for very large datasets [49] | Taxa with incomplete genomic data; resolving deep evolutionary relationships; detecting lateral gene transfer |
| Supermatrix | Concatenates aligned gene sequences into a single combined matrix for analysis [67] | Maximizes character data usage; standard model selection and analysis pipeline; well-established statistical framework [67] | Requires orthologous genes across all taxa; model misspecification risk; alignment uncertainty magnified [49] | Datasets with complete genomic sequences; closely related taxa with conserved gene content |
| Single-Gene Phylogeny | Constructs trees based on evolutionary history of a single gene [67] | Simple methodology; computationally efficient; clear interpretation | Different genes yield conflicting trees; limited phylogenetic signal; cannot represent organismal evolution [49] | Preliminary analysis; studying specific gene families; population genetics within species |
| Full-Genome ML Tree | Uses entire genomic sequence as a single unit for maximum likelihood analysis [49] | Utilizes complete genomic information; standardizable approach | Large genes dominate signal; drowns out phylogenetic information from smaller genes [49] | Closely related isolates; tracking recent transmission chains |
The supertree method demonstrated particular superiority for SARS-CoV-2 analysis due to its ability to integrate phylogenetic information from all genes despite substantial size variation in the coronavirus genome. Notably, the ORF1ab gene comprises approximately 75% of the whole SARS-CoV-2 genome, while key structural genes (S, E, M, and N) account for less than 22% collectively [49]. Traditional full-genome methods effectively allowed this size disparity to drown out critical phylogenetic signals from smaller genes, whereas the supertree approach weighted each gene's evolutionary history more equitably.
Experimental Protocol: MRP Supertree Construction for SARS-CoV-2
The application of MRP pseudo-sequence supertree analysis to SARS-CoV-2 evolution involved a systematic multi-step protocol that can be adapted for prokaryotic phylogenomic studies.
Dataset Construction and Orthology Assignment
Researchers downloaded full-length genomic sequences and protein-coding sequences (CDSs) of 102 SARS-CoV-2 isolates, 5 SARS-CoV, 2 MERS-CoV, and 11 bat coronaviruses from NCBI databases [49]. Sequence integrity was verified, and fragmented sequences were reconstructed. The critical step involved organizing ten groups of CDSs for orthologous proteins using the OrthoMCL program, with repeated sequences removed from orthologous groups [49]. Custom scripts assigned CDSs to their corresponding orthologous protein groups, addressing a key challenge in prokaryotic phylogeny where gene content varies substantially between strains.
Sequence Alignment and Source Tree Generation
Multiple sequence alignment for each CDS group was performed using the L-INS-i method of MAFFT v7.310, followed by conversion to phylip format using Clustal W [49]. Maximum likelihood source phylogenetic trees were constructed for each CDS group using PhyML version 3.0 with 100 bootstrap replications, generating individual gene trees that captured distinct evolutionary histories [49].
Matrix Representation and Supertree Construction
The novel MRP pseudo-sequence approach assigned members of each clade with bipartitions above 55% bootstrap support as either A or T, with custom scripts retrieving Baum-Ragan matrix pseudo-sequences [49]. These pseudo-sequences were then used to reconstruct the comprehensive phylogenetic supertree using PhyML, treating A/T substitutions equally without introducing systematic bias [49]. This approach differed from traditional MRP supertree methods that use source tree topologies directly rather than converting them to sequence representations.
Diagram 1: MRP Supertree Construction Workflow (47 characters)
Method Validation
To validate the MRP supertree approach for viral evolution analysis, researchers employed Artificial Life Framework v1.0 (ALF) to simulate viral genomic evolution using a trimmed bat coronavirus genomic sequence as the root [49]. The simulation incorporated variable mutation rates across ten genes and allowed lateral gene transfer, reflecting real evolution patterns in RNA viruses. The MRP pseudo-sequence supertree demonstrated superior accuracy in recapturing the known simulated evolutionary history compared to full-genome maximum likelihood and traditional MRP supertrees [49].
Key Findings: SARS-CoV-2 Evolutionary Insights from Supertree Analysis
Challenging Established Origins
The MRP pseudo-sequence supertree analysis fundamentally challenged the prevailing hypothesis that bat coronavirus RaTG13 represented the direct ancestor of SARS-CoV-2, a conclusion that had been suggested by other phylogenetic tree analyses based on viral genome sequences [49] [68]. The supertree topology provided stronger resolution that disputed this simple linear descent, suggesting a more complex evolutionary history involving potentially unsampled intermediate hosts or lineages.
Enhanced Resolution of Evolutionary Relationships
The supertree method demonstrated superior resolution power for coronavirus phylogenetics compared to full-genome maximum likelihood approaches [49]. While both methods placed SARS-CoV-2 on a distinct major branch separate from SARS-CoV and MERS-CoV, the supertree provided finer resolution within the SARS-CoV-2 clade itself, enabling more precise tracking of mutation patterns and evolutionary adaptations as the virus spread globally [49].
Table 2: Quantitative Comparison of Phylogenetic Methods for SARS-CoV-2 Analysis
| Performance Metric | MRP Supertree | Full-Genome ML | Single-Gene (Spike) Phylogeny |
|---|---|---|---|
| Resolution within SARS-CoV-2 clade | High (distinct subclades) | Moderate (limited branching support) | Low (inconsistent topology) |
| Handling gene size disparity | Excellent (equal weighting) | Poor (large gene dominance) | Excellent (but incomplete) |
| Ability to incorporate non-orthologous genes | High | Low | High (by definition) |
| Computational intensity | High | Moderate | Low |
| Support for deep evolutionary relationships | High | Moderate | Low |
| Detection of conflicting signals | Yes | No | N/A |
Mutation Pattern Identification
By resolving finer phylogenetic structure, the MRP supertree enabled more precise identification of mutation patterns characteristic of specific SARS-CoV-2 subclades [49]. Researchers performed amino acid sequence alignments of viral genes and manually identified mutation sites in SARS-CoV-2 sequences positioned in distinct subclades within the phylogenetic supertree, revealing evolutionary adaptations that might have been obscured in less-resolved trees [49].
Table 3: Key Research Reagents and Computational Tools for Supertree Analysis
| Resource | Function | Application Context |
|---|---|---|
| OrthoMCL | Orthologous gene group identification | Groups protein-coding sequences across taxa based on sequence similarity [49] |
| MAFFT v7.310 | Multiple sequence alignment | Aligns nucleotide or amino acid sequences using L-INS-i method for improved accuracy [49] |
| PhyML v3.0 | Maximum likelihood tree estimation | Constructs source trees and supertrees using statistical likelihood criteria [49] |
| Custom MRP Scripts | Matrix representation conversion | Converts source tree topologies into pseudo-sequence matrices for parsimony analysis [49] |
| ALF (Artificial Life Framework) | Evolutionary simulation | Validates phylogenetic methods using simulated genomic evolution with known parameters [49] |
| CLC Genomics Workbench | SNP identification | Detects single-nucleotide polymorphisms across aligned sequences [69] |
Implications for Prokaryotic Phylogeny Research
The successful application of supertree analysis to SARS-CoV-2 provides valuable insights for prokaryotic phylogenomics, where similar challenges exist with heterogeneous gene evolution and lateral gene transfer. The MRP pseudo-sequence approach offers a robust framework for resolving deep evolutionary relationships in bacterial and archaeal lineages, where reticulate evolution through horizontal gene transfer creates conflicting signals between gene trees [70].
The supertree method's ability to handle non-orthologous genes and unequal gene representation makes it particularly suitable for prokaryotic phylogeny, where pangenome diversity often prevents the identification of universal single-copy orthologs across divergent taxa. Furthermore, the detection of incongruence between gene trees in supertree analysis can itself provide valuable biological insights, potentially indicating horizontal gene transfer events or other reticulate evolutionary processes [70].
For researchers investigating prokaryotic evolution, the SARS-CoV-2 case study demonstrates that supertree methods can reveal evolutionary relationships obscured by the dominance of highly conserved core genes in supermatrix approaches, much as the SARS-CoV-2 analysis prevented the large ORF1ab gene from drowning out phylogenetic signals from smaller structural genes.
In the field of prokaryotic phylogenomics, researchers face a fundamental methodological choice: whether to use the supermatrix (SM) or supertree (ST) approach to reconstruct evolutionary relationships. Both methods aim to build comprehensive phylogenies from multiple gene sequences, yet they differ significantly in their underlying assumptions, computational requirements, and biological interpretations. The supermatrix approach concatenates gene alignments into a single data matrix for analysis, while the supertree approach combines individual gene trees into a comprehensive phylogeny [43] [48]. For researchers studying prokaryotic evolution, drug target discovery, or microbial diversity, this decision has profound implications for analytical outcomes, resource allocation, and biological conclusions. This guide provides an objective comparison of these methods to inform selection based on specific research goals.
Methodological Foundations
Supermatrix Approach
The supermatrix method, also known as concatenation analysis, combines aligned sequence data from multiple genes into a single large alignment matrix [3]. This combined matrix is then used to reconstruct a phylogenetic tree, typically under maximum likelihood or Bayesian inference frameworks. The fundamental assumption is that combining data strengthens the phylogenetic signal by reducing stochastic errors, effectively averaging signals across different genes [43]. This approach is particularly dominant in prokaryotic phylogenomics, with implementations in pipelines such as UBCG and bcgTree [43].
Supertree Approach
Supertree methods reconstruct phylogenies by combining pre-calculated trees from individual genes rather than the primary sequence data [71]. These methods derive an optimal tree through the analysis of individual genes of interest that need not be present in every genome [43]. This approach prevents the combination of genes with incompatible phylogenetic histories [43], making it particularly valuable when dealing with extensive horizontal gene transfer, which is common in prokaryotes [48].
Comparative Performance Analysis
Key Performance Metrics
Experimental comparisons between supermatrix and supertree methods utilize various metrics to assess topological accuracy and resolution. The cophenetic correlation coefficient (CCC) measures how well pairwise distances in the reconstructed tree correlate with distances in the model tree, with values closer to 1.0 indicating better performance [43]. The Robinson-Foulds distance quantifies topological differences between trees by counting the number of bipartitions that differ, with lower values indicating greater similarity [43]. Resolution measures the degree of bifurcation in the tree, with more fully resolved trees providing clearer phylogenetic hypotheses.
Table 1: Performance Comparison Between SM and ST Methods
| Metric | Supermatrix Performance | Supertree Performance | Interpretation |
|---|---|---|---|
| Cophenetic Correlation Coefficient | >0.99 [43] | Variable depending on method | SM provides highly consistent distance relationships |
| Robinson-Foulds Distance | <0.1 compared to reference [43] | Generally higher than SM | SM trees show nearly identical topology to reference pipelines |
| Computational Time | Higher for large datasets | Significantly faster (polynomial time) [71] | ST advantageous for very large-scale analyses |
| Handling Missing Data | Requires complete or nearly complete genes | Can incorporate genes absent in some taxa [43] | ST more flexible for fragmentary datasets |
| Resolution | Generally high | Variable; PhySIC_IST may exclude >50% of taxa [71] | SM typically produces more complete trees |
Handling Horizontal Gene Transfer
Prokaryotic evolution is characterized by substantial horizontal gene transfer, creating significant challenges for phylogenetic reconstruction. Supermatrix approaches may produce misleading results when genes with different histories are combined into a single dataset [48]. This can result in a phylogeny that represents neither the history of any individual gene nor the organism as a whole [48]. Supertree methods can circumvent this issue by maintaining separate gene histories, though they may produce less resolved trees when conflict between genes is substantial [71].
Novel Clade Formation
A critical consideration is the tendency of some methods to infer clades not present in any input tree. Voting supertree methods like Matrix Representation with Parsimony (MRP) can infer supertrees containing clades that contradict each of the input trees [71]. In contrast, veto methods like PhySIC and PhySIC_IST prevent this by ensuring no clade in the supertree directly or indirectly contradicts the input trees [71], though this may come at the cost of reduced resolution.
Experimental Protocols and Workflows
Standardized Testing Framework
Experimental comparisons typically follow a established protocol: (1) construction of a model tree under a Yule process; (2) simulation of DNA alignments along that tree; (3) random deletion of a proportion of taxa; (4) reconstruction of trees by maximum likelihood; (5) construction of a supertree from the inferred ML trees; and (6) comparison of the supertree to the model tree using distance and similarity measures, plus evaluation of its resolution [71].
Implementation Workflows
The following workflow diagrams illustrate the fundamental differences in supermatrix and supertree approaches:
Methodological Variations
Both supermatrix and supertree approaches encompass multiple algorithmic implementations:
Practical Implementation Guide
Decision Matrix for Method Selection
Table 2: Decision Matrix for Method Selection Based on Research Context
| Research Context | Recommended Approach | Rationale | Implementation Example |
|---|---|---|---|
| High-Quality Complete Genomes | Supermatrix | Maximizes signal integration with minimal missing data | EasyCGTree with bac120/ar122 gene sets [43] |
| Fragmentary Genomic Data | Supertree | Better handling of incomplete gene sets across taxa | PhySIC_IST for property-preserving trees [71] |
| Suspected Horizontal Gene Transfer | Supertree | Avoids signal averaging from incompatible histories | ASTRAL-III for coalescent-based approach [43] |
| Large-Scale Taxa Sets (>1000) | Supertree | Polynomial time methods scale better | Modified MinCut for large datasets [71] |
| Deep Phylogenetic Inference | Supermatrix | Concatenation helps resolve deep branches | Ribosomal protein concatenation [11] |
| Testing Evolutionary Hypotheses | Both (comparative) | Identify robust vs. conflicting relationships | SuperTRI with branch support analyses [3] |
Computational Requirements and Considerations
Supermatrix methods typically require more computational resources and memory, especially for large datasets, as they analyze concatenated alignments simultaneously [43]. Supertree approaches can be more easily parallelized and require less memory, as they combine pre-calculated trees rather than analyzing sequence data directly [43] [71]. For extremely large analyses, supertree methods offer practical advantages, with some methods like Build-with-distances and PhySIC_IST performing with accuracy comparable to MRP while requiring less computational time [71].
Available Software Implementations
Table 3: Software Tools for SM and ST Analysis
| Tool | Method | Core Features | Platform |
|---|---|---|---|
| EasyCGTree [43] | Both SM & ST | All-in-one pipeline with multiple core gene sets | Linux, Windows |
| UBCG [43] | SM | Uses up-to-date bacterial core gene set | Linux |
| bcgTree [43] | SM | Extracts 107 essential bacterial core genes | Linux |
| PhySIC_IST [71] | ST | Veto method preserving topological properties | Platform independent |
| MRP [71] | ST | Most widely used supertree method | Various implementations |
Core Gene Sets for Prokaryotic Phylogeny
Table 4: Standardized Gene Sets for Prokaryotic Phylogenomics
| Gene Set | Gene Count | Taxonomic Scope | Application | Reference |
|---|---|---|---|---|
| bac120 | 120 | Bacteria | Broad phylogenetic inference | [43] |
| ar122 | 122 | Archaea | Archaeal phylogeny | [43] |
| UBCG | 92 | Bacteria | Up-to-date bacterial core genes | [43] |
| rp1 | 16 | Prokaryotes | Ribosomal protein-based phylogeny | [43] |
| rp2 | 23 | Prokaryotes | Extended ribosomal protein set | [43] |
| essential | 107 | Bacteria | Essential single-copy core genes | [43] |
Recommended Analytical Protocols
For standardized comparisons, researchers should consider implementing the following protocols:
Data Preparation: Use high-quality annotated genomes; filter based on completeness and contamination estimates.
Gene Sorting: Identify core genes using profile HMM databases with standardized cutoff values (e.g., E-value 1e-10) [43].
Alignment and Trimming: Use consistent alignment tools (e.g., MUSCLE, Clustal Omega) and trimming approaches (e.g., trimAl with strict method) [43].
Tree Inference: Apply both SM and ST approaches using standardized parameters for comparison.
Support Assessment: Employ appropriate support measures (bootstrap, posterior probabilities) and conflict detection methods.
The choice between supertree and supermatrix methods represents a fundamental strategic decision in prokaryotic phylogenomics. Supermatrix approaches generally provide higher resolution and are preferred when analyzing complete genomes with minimal horizontal transfer. Supertree methods offer advantages for fragmentary datasets, analyses requiring computational efficiency, and situations with substantial horizontal gene transfer. The most robust phylogenetic inferences often emerge from applying both approaches comparatively, as conflicts between methods can reveal biologically meaningful patterns such as horizontal gene transfer or evolutionary radiations. For researchers in drug discovery and microbial evolution, methodological transparency and appropriate tool selection remain critical for generating reliable, reproducible phylogenetic hypotheses.
Conclusion
The choice between supertree and supermatrix methods for prokaryotic phylogeny is not a simple verdict but a strategic decision guided by research objectives and dataset properties. Current evidence from simulations and organismal studies indicates that the supermatrix method, particularly when analyzed with maximum likelihood, often achieves superior topological accuracy and is generally the preferred approach when computationally feasible. However, the supertree method remains a vital and powerful tool for integrating disparate data types, scaling to extremely large taxon sets, and providing insights in cases of strong gene tree conflict, such as those caused by extensive horizontal gene transfer in prokaryotes. For biomedical research, this implies that supermatrix approaches may be more reliable for precise phylogenetic inference in drug target identification, while supertrees offer a flexible framework for building comprehensive trees of life that contextualize pathogenic lineages. Future directions will likely involve hybrid approaches that leverage the strengths of both methods, improved models that explicitly account for prokaryote-specific evolutionary processes, and the development of more automated, robust pipelines to handle the burgeoning volume of genomic data from both cultured and uncultured microbes.
References
- 1. Prokaryotic taxonomy and nomenclature in the age of big ... [https://www.nature.com/articles/s41396-021-00941-x]
- 2. EasyCGTree: a pipeline for prokaryotic phylogenomic analysis ... [https://bmcbioinformatics.biomedcentral.com/articles/10.1186/s12859-023-05527-2]
- 3. SuperTRI: A new approach based on branch support ... [https://www.sciencedirect.com/science/article/pii/S163106910900122X]
- 4. Data: A comparison of supermatrix and supertree methods ... [https://datadryad.org/dataset/doi:10.5061/dryad.2fs2b]
- 5. Speeding up iterative applications of the BUILD supertree ... [https://peerj.com/articles/16624/]
- 6. Peptide Phage Display as a Tool for Drug Discovery [https://pmc.ncbi.nlm.nih.gov/articles/PMC6259427/]
- 7. Phage display [https://en.wikipedia.org/wiki/Phage_display]
- 8. Inferring Horizontal Gene Transfer - PMC [https://pmc.ncbi.nlm.nih.gov/articles/PMC4462595/]
- 9. Phylogenomic species tree estimation in the presence of ... [https://pmc.ncbi.nlm.nih.gov/articles/PMC4603753/]
- 10. Integrating phylogenies with chronology to assemble the ... [https://www.frontiersin.org/journals/bioinformatics/articles/10.3389/fbinf.2025.1571568/full]
- 11. A Rooted Net of Life - PMC [https://pmc.ncbi.nlm.nih.gov/articles/PMC3189188/]
- 12. A comparison of supermatrix and supertree methods for ... [https://pubmed.ncbi.nlm.nih.gov/34798766/]
- 13. PGAP2: A comprehensive toolkit for prokaryotic pan ... [https://www.nature.com/articles/s41467-025-64846-5]
- 14. Phylogenetic Analysis in Bioinformatics: Best Practices ... [https://clinilaunchresearch.in/phylogenetic-analysis-bioinformatics-tools/]
- 15. Visualizing phylogenetic trees using FigTree [http://beast.community/workshop_figtree]
- 16. Evaluation of 16S rRNA gene sequencing for species and ... [https://www.nature.com/articles/s41467-019-13036-1]
- 17. Constructing phylogenetic trees for microbiome data analysis [https://www.sciencedirect.com/science/article/pii/S2001037024003532]
- 18. Whole-proteome phylogeny of prokaryotes by feature ... [https://pmc.ncbi.nlm.nih.gov/articles/PMC2806744/]
- 19. VBCG: 20 validated bacterial core genes for phylogenomic ... [https://microbiomejournal.biomedcentral.com/articles/10.1186/s40168-023-01705-9]
- 20. High-resolution phylogenetic and population genetic ... [https://www.nature.com/articles/s43705-022-00183-8]
- 21. Comparative analysis of full-length 16s ribosomal RNA ... [https://pmc.ncbi.nlm.nih.gov/articles/PMC10411958/]
- 22. A tool to automatically SPLit, Align, and ConcatenatE ... [https://pmc.ncbi.nlm.nih.gov/articles/PMC9772462/]
- 23. Building species trees using concatenated alignments [https://etetoolkit.org/cookbook/ete_build_supermatrix.ipynb]
- 24. Concatenation and model testing [https://evomics.org/wp-content/uploads/2024/01/partitioning_and_concatenation.html]
- 25. Accurate, scalable, and fully automated inference of species ... [https://pmc.ncbi.nlm.nih.gov/articles/PMC12088440/]
- 26. Total Evidence, Average Consensus and Matrix ... [https://pmc.ncbi.nlm.nih.gov/articles/PMC2674675/]
- 27. Matrix representation parsimony supertree estimation [https://rdrr.io/cran/phytools/man/mrp.supertree.html]
- 28. A Phylogenomic Approach to Bacterial Phylogeny [https://pmc.ncbi.nlm.nih.gov/articles/PMC186629/]
- 29. A likelihood look at the supermatrix-supertree controversy [https://pubmed.ncbi.nlm.nih.gov/18502054/]
- 30. A simulation study comparing supertree and combined ... [https://pmc.ncbi.nlm.nih.gov/articles/PMC2837663/]
- 31. Split-based computation of majority-rule supertrees [https://bmcecolevol.biomedcentral.com/articles/10.1186/1471-2148-11-205]
- 32. Assessment of the accuracy of matrix representation with ... [https://experts.arizona.edu/en/publications/assessment-of-the-accuracy-of-matrix-representation-with-parsimon/]
- 33. An experimental study of Quartets MaxCut and other supertree ... [https://pmc.ncbi.nlm.nih.gov/articles/PMC3101644/]
- 34. Prokaryotic evolution and the tree of life are two different things [https://pmc.ncbi.nlm.nih.gov/articles/PMC2761302/]
- 35. Review The supermatrix approach to systematics [https://www.sciencedirect.com/science/article/abs/pii/S0169534706003326]
- 36. Mega-phylogeny approach for comparative biology [https://pmc.ncbi.nlm.nih.gov/articles/PMC2645364/]
- 37. Phylogenetic signal and functional categories in ... [https://pmc.ncbi.nlm.nih.gov/articles/PMC1796616/]
- 38. Phylogeny of Bacterial and Archaeal Genomes Using ... [https://journals.plos.org/plosone/article?id=10.1371/journal.pone.0062510]
- 39. Horizontal Gene Transfers in prokaryotes show differential ... [https://bmcecolevol.biomedcentral.com/articles/10.1186/1471-2148-9-9]
- 40. A likelihood look at the supermatrix–supertree controversy [https://www.sciencedirect.com/science/article/abs/pii/S0378111908001509]
- 41. A simulation study comparing supertree and combined ... [https://almob.biomedcentral.com/articles/10.1186/1748-7188-5-8]
- 42. Building a small and informative phylogenetic supertree [https://www.sciencedirect.com/science/article/abs/pii/S0890540123000858]
- 43. EasyCGTree: a pipeline for prokaryotic phylogenomic ... [https://pmc.ncbi.nlm.nih.gov/articles/PMC10576351/]
- 44. Pitfalls in supermatrix phylogenomics [https://europeanjournaloftaxonomy.eu/index.php/ejt/article/view/407]
- 45. Suppression of long-branch attraction artefacts in the animal ... [https://bmcecolevol.biomedcentral.com/articles/10.1186/1471-2148-7-S1-S4]
- 46. Prokaryotic taxonomy and nomenclature in the age of big ... [https://pmc.ncbi.nlm.nih.gov/articles/PMC8245423/]
- 47. Do we still need supertrees? - BMC Biology [https://bmcbiol.biomedcentral.com/articles/10.1186/1741-7007-10-13]
- 48. Trees in the Web of Life - Journal of Biology - BioMed Central [https://jbiol.biomedcentral.com/articles/10.1186/jbiol160]
- 49. Phylogenetic supertree reveals detailed evolution of SARS ... [https://www.nature.com/articles/s41598-020-79484-8]
- 50. Improved robustness to gene tree incompleteness, ... [https://pubmed.ncbi.nlm.nih.gov/40000439/]
- 51. Spectral cluster supertree: fast and statistically robust ... [https://www.frontiersin.org/journals/molecular-biosciences/articles/10.3389/fmolb.2024.1432495/full]
- 52. The supermatrix approach to systematics [https://pubmed.ncbi.nlm.nih.gov/17046100/]
- 53. Updating the evolutionary history of Carnivora (Mammalia): a new... [https://bmcbiol.biomedcentral.com/articles/10.1186/1741-7007-10-12]
- 54. Phylogenetics series The evolution of supertrees [https://www.sciencedirect.com/science/article/abs/pii/S0169534704000709]
- 55. Complete generic-level phylogenetic analyses of palms (Arecaceae)... [https://pubmed.ncbi.nlm.nih.gov/20525581/]
- 56. (PDF) Complete Generic-Level Phylogenetic Analyses of Palms... [https://www.academia.edu/143999137/Complete_Generic_Level_Phylogenetic_Analyses_of_Palms_Arecaceae_with_Comparisons_of_Supertree_and_Supermatrix_Approaches]
- 57. Prokaryotic Phylogenies Inferred from Whole-Genome ... [https://pmc.ncbi.nlm.nih.gov/articles/PMC3773407/]
- 58. Accuracy of phylogeny reconstruction methods combining ... [https://pmc.ncbi.nlm.nih.gov/articles/PMC3022592/]
- 59. Robinson-Foulds Supertrees - PMC - PubMed Central [https://pmc.ncbi.nlm.nih.gov/articles/PMC2846952/]
- 60. A simple, fast, and accurate method of phylogenomic inference [https://pmc.ncbi.nlm.nih.gov/articles/PMC2760878/]
- 61. The performance of the Congruence Among Distance ... [https://bmcecolevol.biomedcentral.com/articles/10.1186/1471-2148-11-64]
- 62. Mega-phylogeny approach for comparative biology [https://bmcecolevol.biomedcentral.com/articles/10.1186/1471-2148-9-37]
- 63. Accurate Inference of Tree Topologies from Multiple ... [https://pmc.ncbi.nlm.nih.gov/articles/PMC8204903/]
- 64. Benchmark datasets and software for developing ... [http://currents.plos.org/treeoflife/article/benchmark-datasets-and-software-for-developing-and-testing-methods-for-large-scale-multiple-sequence-alignment-and-phylogenetic-inference/]
- 65. Super-tree Approach for Studying the Phylogeny of ... [https://link.springer.com/chapter/10.1007/978-3-540-25944-2_91]
- 66. Reliable estimation of tree branch lengths using deep neural ... [https://journals.plos.org/ploscompbiol/article?id=10.1371/journal.pcbi.1012337]
- 67. Common Methods for Phylogenetic Tree Construction and ... [https://www.mdpi.com/2306-5354/11/5/480]
- 68. Phylogenetic supertree reveals detailed evolution of SARS ... [https://pubmed.ncbi.nlm.nih.gov/33353955/]
- 69. Comparative phylogenetic analysis of SARS-CoV-2 spike ... [https://pmc.ncbi.nlm.nih.gov/articles/PMC8083239/]
- 70. Detection and utility in the phylogenomics era [https://www.sciencedirect.com/science/article/pii/S1055790324001891]
- 71. Polynomial Supertree Methods Revisited - PMC [https://pmc.ncbi.nlm.nih.gov/articles/PMC3249592/]