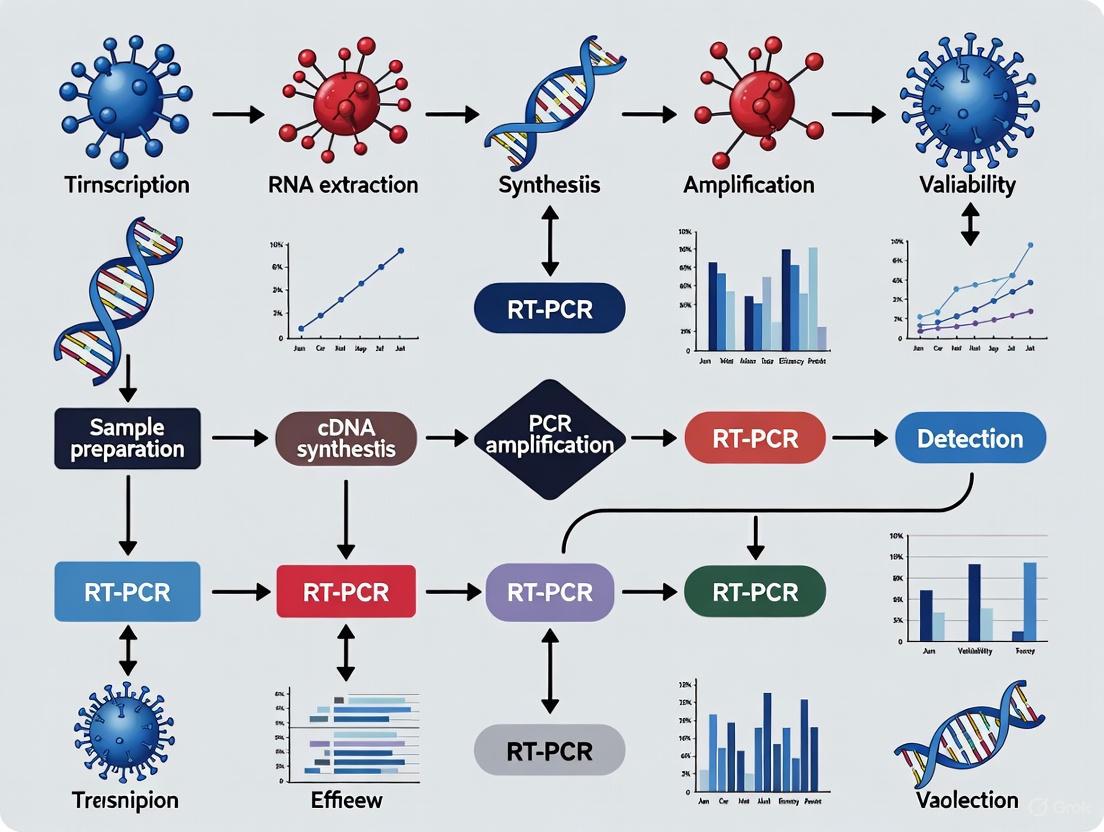
Strategic Approaches to Minimize Variance in RT-PCR Workflows: From Bench to Biomarker
This article provides a comprehensive guide for researchers and drug development professionals seeking to enhance the reliability and reproducibility of their Reverse Transcription Quantitative PCR (RT-qPCR) data.
Strategic Approaches to Minimize Variance in RT-PCR Workflows: From Bench to Biomarker
Abstract
This article provides a comprehensive guide for researchers and drug development professionals seeking to enhance the reliability and reproducibility of their Reverse Transcription Quantitative PCR (RT-qPCR) data. It systematically addresses the critical pillars of a robust RT-qPCR workflow, beginning with an exploration of the fundamental sources of technical and biological variation. The content then progresses to detailed methodological protocols for sample preparation, cDNA synthesis, and qPCR setup, followed by advanced troubleshooting and optimization strategies for common pitfalls. Finally, the guide covers rigorous validation frameworks, data normalization techniques, and comparative analyses of laboratory-developed versus commercial assays, all aligned with international MIQE guidelines to ensure data integrity and translational relevance.
Understanding the Multifactorial Sources of RT-PCR Variance
Defining Technical vs. Biological Variance in Molecular Assays
In quantitative molecular assays, particularly Reverse Transcription Polymerase Chain Reaction (RT-PCR), identifying the source of variation is the first critical step towards ensuring the reliability and reproducibility of your results. Variance can be broadly categorized as either technical or biological. Technical variance arises from the experimental procedures and measurement systems themselves. In contrast, biological variance reflects the true, natural differences in target quantity between different samples or subjects within the same experimental group [1].
Understanding and minimizing technical variance is paramount because it can obscure true biological signals and lead to incorrect conclusions. This guide provides a clear framework for distinguishing between these variance types, offers troubleshooting strategies for common issues, and outlines protocols to reduce variability in your RT-PCR workflows.
Core Definitions
- Technical Variance: This is the variation inherent to the measuring system and its procedures. It can be estimated by assaying multiple aliquots of the same biological sample, known as technical replicates [1]. Sources include pipetting inaccuracy, instrument performance, reagent efficiency, and operator technique.
- Biological Variance: This is the true variation in the target quantity among different biological samples or subjects belonging to the same group (e.g., control vs. treated) [1]. This variance is accounted for by using distinct biological replicates, which are biologically independent samples that undergo the entire experimental process separately.
Quantitative Comparison of Variance Components
The table below summarizes the key characteristics and contributors of technical and biological variance.
Table 1: Key Characteristics of Technical and Biological Variance
| Feature | Technical Variance | Biological Variance | |
|---|---|---|---|
| Definition | Variation from the experimental measurement process | Natural variation between individual biological subjects | |
| Estimated Via | Technical replicates (multiple measurements of the same sample) [1] | Biological replicates (measurements from different subjects in the same group) [1] | |
| Common Sources | - Pipetting inaccuracy [1] [2]- Instrument calibration & performance [1]- Reagent quality & lot-to-lot variability [3]- Operator technique [1]- Amplification efficiency differences [4] | - Genetic heterogeneity of subjects- Physiological state (age, metabolism)- Environmental exposure differences | - Sample collection time points |
| Impact on Results | Reduces precision and can inflate or mask true biological differences [1] | Determines the true effect size and the generalizability of findings to a population [1] |
A large-scale proficiency testing survey highlights how specific technical factors contribute to result variability in viral load testing. The relative contribution of these factors can differ depending on the specific target being measured.
Table 2: Factors Contributing to Inter-Laboratory Variability in Viral Load PCR (CAP Survey Data) [3]
| Factor | Impact on Result Variability (RV) |
|---|---|
| Commercially prepared primers and probes | Made the largest contribution to overall variability |
| Amplification target gene | Prominently associated with changes in RV |
| Selection of quantitative calibrator | Associated with changes in mean viral load (MVL) and RV |
| Sample preparation method | Contributes to overall MVL and RV |
Troubleshooting Guides & FAQs
Frequently Asked Questions (FAQs)
Q1: My RT-qPCR results show high variability between technical replicates. What are the most likely causes? High variation between technical replicates (e.g., high standard deviation or coefficient of variation among wells containing the same sample) is a classic sign of technical issues [1]. Key areas to investigate are:
- Pipetting Technique: Ensure pipettes are calibrated and used correctly with well-fitting tips. Pay special attention when pipetting viscous liquids [1].
- Reaction Setup: Visually check for consistent liquid volumes in all wells after plate loading. Centrifuge the sealed plate to consolidate samples and remove air bubbles [1].
- Instrument Performance: Verify that your thermal cycler block temperature is uniform and calibrated. Check the optical system for anomalies [1].
- Master Mix Homogeneity: Ensure all reaction components are thoroughly mixed before aliquoting.
Q2: How can I determine if my RNA quality is contributing to variance in gene expression results? Poor RNA integrity is a major source of both technical and biological misinterpretation [5].
- Assessment: Always assess RNA integrity prior to cDNA synthesis using methods like gel electrophoresis (to observe sharp ribosomal RNA bands) or microfluidic analysis (e.g., RIN > 7 for most applications) [5].
- Impact: Degraded RNA can lead to truncated cDNA, reduced amplification efficiency, and an underestimation of transcript levels, especially for longer transcripts or those with low abundance [5].
- Prevention: Minimize freeze-thaw cycles, use RNase-free reagents and techniques, and include an RNase inhibitor during reverse transcription [5].
Q3: When I see a statistically significant fold-change, how do I know if it is biologically relevant? Statistical significance and biological relevance are distinct concepts.
- Statistical Significance: A significant p-value (e.g., < 0.05) from a t-test or ANOVA indicates that the observed fold-change is unlikely to be due to random chance (experimental variation) alone [1].
- Biological Relevance: This requires researcher judgment based on the biological context. With sufficient replicates and low variability, very small fold-changes can be statistically significant. However, in eukaryotic gene expression, a two-fold change is often considered a minimum threshold for physiological significance [1]. Always interpret your p-values in the context of the actual fold-change and the known biology of your target.
Troubleshooting Common RT-PCR Problems
Table 3: Troubleshooting Common RT-PCR Issues Related to Variance
| Problem | Possible Technical Cause | Possible Biological Cause | Solutions |
|---|---|---|---|
| Low or No Amplification [5] [6] | - Poor reverse transcription efficiency- PCR inhibitors in sample- Suboptimal PCR conditions (Mg²⁺, annealing temp)- Inactive enzyme | - Very low abundance of target transcript- Degraded RNA sample | - Check RNA integrity and quantity [5]- Use a high-performance, inhibitor-resistant reverse transcriptase [5]- Optimize PCR conditions and include positive control [6] |
| Non-Specific Products (e.g., Primer-Dimers) [7] [6] | - Poor primer design- Annealing temperature too low- Primer concentration too high | - Presence of highly homologous gene sequences in the sample | - Redesign primers with stricter criteria- Use a hot-start polymerase [6]- Increase annealing temperature [6]- Use probe-based chemistry (e.g., TaqMan) instead of SYBR Green [7] |
| High Variability Between Replicates [1] | - Inconsistent pipetting- Inhomogeneous reaction mix- Air bubbles in wells- Uneven plate sealing | - Not applicable (this is a technical issue by definition) | - Practice and verify good pipetting technique [1]- Vortex and centrifuge all reagents and the sealed plate [1]- Run technical replicates to measure and control for this variance |
Experimental Protocols for Variance Reduction
Protocol: Designing an Experiment with Optimal Replication
Objective: To control for both technical and biological variance, allowing for statistically robust and biologically meaningful conclusions.
Methodology:
- Define Biological Replicates: These are the cornerstone of your experiment. They represent independent biological units (e.g., different animals, primary cell cultures from different donors, independently grown plants). The number of biological replicates determines your power to detect a true biological effect. A minimum of n=3 is recommended, but more may be needed for heterogeneous samples [4].
- Define Technical Replicates: These are multiple measurements (e.g., wells on a plate) of the same biological sample extract. They help account for variability in the qPCR process itself. In basic research, running triplicate technical replicates is common [1].
- Experimental Workflow: Each independent biological replicate is processed separately through RNA extraction, DNase treatment, and reverse transcription. The resulting cDNA from each biological replicate is then aliquoted into multiple technical replicates for the qPCR step.
Diagram: Experimental Workflow for Robust RT-qPCR
Protocol: Statistical Analysis of qPCR Data for Variance Assessment
Objective: To correctly analyze qPCR data, compare treatment groups, and account for sources of variation.
Methodology: [4]
- Data Transformation: qPCR data (Normalized Relative Quantities or NRQs) are not normally distributed. Apply a log transformation (base 2 or 10) to the NRQ data to create a new variable, often called Cq'. This transformation stabilizes the variance and makes the data suitable for parametric statistical tests.
Cq' = -log₂(NRQ)[4] - Statistical Testing: Use Analysis of Variance (ANOVA) to compare the Cq' values across your biological groups. ANOVA allows you to assess the variation due to your treatment factors (main effects) and can account for block effects like inter-plate variation [4].
- Interpretation: A significant result (p < 0.05) indicates that the observed differences in gene expression between groups are unlikely to be due to random biological and technical variation alone, and are likely caused by the experimental treatment [1].
The Scientist's Toolkit: Key Reagent Solutions
Table 4: Essential Research Reagents for Variance Reduction
| Reagent / Material | Function | Impact on Variance |
|---|---|---|
| High-Performance Reverse Transcriptase | Synthesizes cDNA from RNA templates. | Reduces technical variance from inefficient or inhibited cDNA synthesis, especially for long transcripts or low-abundance targets [5]. |
| Hot-Start DNA Polymerase | Prevents non-specific amplification during PCR setup. | Reduces technical variance from primer-dimer formation and non-specific products, improving assay specificity and precision [6]. |
| Passive Reference Dye | Normalizes for non-PCR-related fluorescence fluctuations. | Corrects for variations in reaction volume and optical anomalies, improving inter-well precision [1]. |
| DNase I (RNase-free) | Removes contaminating genomic DNA from RNA samples. | Prevents false positives and overestimation of transcript levels, a source of technical bias [5]. |
| Standardized Calibrators / Reference Materials | Provides a known quantity of target for generating standard curves. | Reduces inter-laboratory and inter-assay variability by providing a common benchmark for quantification [3]. |
| Multiplex qPCR Assays | Allows simultaneous amplification of multiple targets in a single well. | When a reference gene is included in the multiplex, normalizing target data from the same well provides a precision correction, reducing technical variance [1]. |
The reliability of any experimental result, particularly in molecular diagnostics and research, is heavily dependent on the steps taken before the actual analysis begins. The pre-analytical phase encompasses all processes from sample collection to the point of analysis. Evidence indicates that up to 75% of all laboratory errors originate in this phase, making it the most significant contributor to overall variability and a critical focus for quality improvement [8]. For techniques like RT-PCR, which are central to gene expression analysis, viral load testing, and diagnostic assays, controlling pre-analytical variables is paramount for obtaining accurate, reproducible, and clinically or scientifically valid data.
This guide details the critical pre-analytical variables within the context of a broader thesis on RT-PCR workflow variance reduction strategies. It is structured to serve as a technical support resource, providing troubleshooting guides and FAQs to help researchers, scientists, and drug development professionals identify and mitigate specific issues encountered during experiments.
Sample Collection & Handling: Troubleshooting Guide
Errors introduced during sample collection and handling are often irreversible and can compromise all subsequent steps.
Frequently Asked Questions
Q1: Why is my serum potassium level falsely elevated in a non-hemolyzed specimen? A: Pseudohyperkalemia can be caused by patient activity during phlebotomy. Repeated fist clenching with a tourniquet applied can cause a 1-2 mmol/L increase in potassium due to potassium efflux from forearm muscle cells. In one documented case, this led to a serum potassium reading of 6.9 mmol/L in an outpatient setting, while levels taken via an in-dwelling catheter in a hospital were normal (3.9-4.5 mmol/L) [9]. Solution: Instruct patients to avoid fist clenching. Release the tourniquet within one minute of application.
Q2: Why are my coagulation test results (e.g., PT, aPTT) artificially prolonged?
A: A common cause is an improper blood-to-anticoagulant ratio. This occurs with underfilled blood collection tubes or in patients with a high hematocrit (>0.55). The excess anticoagulant causes an over-abundance of citrate, leading to only partial recalcification and prolonged clotting times [10].
Solution: Ensure tubes are filled to the correct volume. For patients with elevated hematocrit, use the following formula to adjust the volume of 3.2% trisodium citrate:
C (ml) = (1.85 x 10^-3) x (100 - Hct(%)) x V (ml)
Where C is the volume of citrate and V is the volume of whole blood in the tube [10].
Q3: My hematology results (e.g., hemoglobin, WBC) are erratic and inconsistent when run from the same tube. What could be wrong? A: This may be due to improper mixing. If a sample tube is overfilled, the air bubble necessary for proper mixing on a rocking mixer cannot move effectively. This leads to inadequate resuspension of cells and erroneous results [9]. Solution: Always collect samples to the designated fill volume. If a tube is overfilled, remove a small volume of blood to create an air bubble before mixing.
Table 1: Optimal Blood Sample Volumes for Different Laboratory Tests [9]
| Test Category | Sample Type | Recommended Volume |
|---|---|---|
| Clinical Chemistry (20 analytes) | Heparinized Plasma | 3 - 4 mL whole blood |
| Clinical Chemistry (20 analytes) | Serum | 4 - 5 mL clotted blood |
| Hematology | EDTA Blood | 2 - 3 mL whole blood |
| Coagulation Tests | Citrated Blood | 2 - 3 mL whole blood |
| Immunoassays | EDTA Blood | 1 mL whole blood (for 3-4 assays) |
| Erythrocyte Sedimentation Rate | Citrated Blood | 2 - 3 mL whole blood |
| Blood Gases (Capillary) | Arterial Blood | 50 µL |
| Blood Gases (Venous) | Heparinized Blood | 1 mL |
Patient & Sample Specific Variables
Biological and physiological factors introduce variability that must be recognized and controlled where possible.
Frequently Asked Questions
Q4: Can a patient's diet really affect laboratory results? A: Yes, profoundly. Food ingestion is a significant source of pre-analytical variability. For example, glucose and triglycerides increase after meals. A specific case involved a 75-year-old woman who presented with hypernatremia (serum sodium of 162 mmol/L) and confusion after consuming several bowls of soup, which caused a massive sodium intake [9]. Solution: Implement and communicate strict patient preparation protocols, including overnight fasting (10-14 hours) for specific tests and dietary restrictions where necessary [8].
Q5: What physiological factors outside of disease can influence my results? A: Multiple factors can cause variation, including:
- Posture: Shifting from lying to standing can increase serum concentrations of proteins by ~9% within 10 minutes.
- Circadian Rhythm: Analytes like iron, potassium, cortisol, and renin exhibit significant diurnal variation.
- Exercise: Strenuous exercise can increase muscle-derived enzymes like creatine kinase and aldolase.
- Pregnancy and Gender: Pregnancy can reduce Protein S levels, and females generally have different baseline levels of some clotting factors compared to males [10] [8]. Solution: Standardize the time of sample collection, document patient posture and recent activity, and use gender- or condition-specific reference ranges where appropriate.
RNA Integrity & PCR-Specific Variables
For RT-PCR and related molecular techniques, the quality of the nucleic acid template is a fundamental pre-analytical factor.
Frequently Asked Questions
Q6: What is the biggest source of variability in qPCR or RNA-Seq workflows? A: A poll of researchers identified Reverse Transcription (cDNA synthesis) and Amplification as the top sources of variability. These steps are known to introduce errors and amplification bias. Bioinformatics/Data Analysis and Normalization were also highly rated as significant contributors [11].
Q7: My PCR has low yield or no product. What should I check in my template DNA/RNA? A: The integrity and purity of your nucleic acid template are critical [12]. Solution:
- Poor Integrity: Minimize shearing during isolation. Assess integrity by gel electrophoresis. Store DNA in molecular-grade water or TE buffer (pH 8.0).
- Low Purity: Ensure no residual PCR inhibitors (phenol, EDTA, proteinase K, salts) are present. Re-purify or ethanol-precipitate the template. Use polymerases with high inhibitor tolerance.
- Insufficient Quantity: Increase the amount of input template or the number of PCR cycles. Use a more sensitive DNA polymerase.
- Complex Targets (GC-rich): Use a PCR additive (e.g., DMSO, GC Enhancer), increase denaturation temperature/time, and choose a polymerase with high processivity [12].
Q8: How can I systematically optimize my qPCR assay for maximum accuracy? A: An optimized, stepwise protocol is essential for achieving high efficiency and specificity [13]. Experimental Protocol: Stepwise qPCR Optimization [13]
- Primer Design: For plants and species with homologous genes, design primers based on Single-Nucleotide Polymorphisms (SNPs) to ensure specificity. Avoid relying solely on computational tools without validation.
- Annealing Temperature Optimization: Use a gradient thermal cycler to test a range of temperatures (e.g., 1–2°C increments) around the predicted Tm.
- Primer Concentration Optimization: Test primer concentrations in the range of 0.1–1 μM to find the concentration that minimizes primer-dimer formation and maximizes signal.
- cDNA Concentration Curve: Run a standard curve with a serial dilution (e.g., 1:10, 1:100, 1:1000) of your cDNA to determine the optimal dynamic range for each primer pair.
- Validation Criteria: The optimal primer pair for each gene should yield a standard curve with R² ≥ 0.999 and an amplification efficiency (E) of 100 ± 5%. This is a prerequisite for reliable use of the 2−ΔΔCt method for analysis [13].
Q9: How can I assess RNA integrity in complex samples like wastewater? A: RNA integrity is not uniform across the genome. A Long-Range Reverse Transcription digital PCR (LR-RT-dPCR) method can be used. Experimental Protocol: Assessing RNA Integrity with LR-RT-dPCR [14]
- Long-Range RT: Perform reverse transcription using a single specific primer at the 3' end to generate a long, contiguous cDNA strand.
- Sample Partitioning: Partition the cDNA sample into many individual reactions via digital PCR.
- Multiplex Amplification: Perform a multiplex PCR amplification on targets located at the 3' end, middle, and 5' end of the genome within the partitioned samples.
- Analysis: The detection frequency of the different fragments indicates the integrity of the RNA. More degraded RNA will show lower detection frequencies for fragments further from the 3' end. This method has been successfully applied to assess the integrity of SARS-CoV-2 RNA in wastewater [14].
Diagram: Pre-Analytical Phase Workflow
The following diagram maps the key stages and decision points in the pre-analytical phase, highlighting where critical errors can occur.
The Scientist's Toolkit: Research Reagent Solutions
Selecting the right reagents is critical for minimizing variability. The following table details key solutions for robust RT-PCR.
Table 2: Key Research Reagent Solutions for RT-PCR Workflows
| Reagent / Material | Function / Purpose | Key Considerations for Variance Reduction |
|---|---|---|
| Hot-Start DNA Polymerase | Enzyme for PCR amplification that is inactive at room temperature. | Prevents non-specific amplification and primer-dimer formation during reaction setup, enhancing specificity and yield [12]. |
| Sequence-Specific Primers | Oligonucleotides designed to bind specifically to the target sequence. | Design must be based on aligned homologous sequences and SNPs to ensure target specificity and avoid off-target binding [13]. |
| PCR Additives (e.g., DMSO, GC Enhancer) | Co-solvents that help denature complex DNA secondary structures. | Critical for amplifying GC-rich targets or sequences with stable secondary structures; requires concentration optimization [12]. |
| dNTP Mix | The four nucleotide building blocks (dATP, dCTP, dGTP, dTTP) for DNA synthesis. | Must be provided in equimolar concentrations to prevent misincorporation errors and ensure high fidelity amplification [12]. |
| Magnesium Salt (MgCl₂/MgSO₄) | Essential cofactor for DNA polymerase activity. | Concentration must be optimized for each primer-template system; excess Mg²⁺ can reduce fidelity and increase non-specific binding [12]. |
| RNA Stabilization Reagents | Chemicals that immediately inhibit RNases upon sample collection. | Preserves RNA integrity from the moment of collection, critical for accurate gene expression analysis [14]. |
| Standardized Quantitative Calibrators | Reference materials with known analyte concentrations. | Allows for calibration across different labs and platforms, significantly reducing inter-laboratory variability in quantitative assays like viral load testing [3]. |
The Impact of Reagent Sourcing and Enzyme Selection on Assay Reproducibility
Troubleshooting Guide: Addressing Common Reproducibility Issues
Why do my RT-qPCR results show poor reproducibility between experiments, even when using the same sample?
Poor reproducibility in RT-qPCR often stems from the reverse transcription (RT) step, which introduces significant, often overlooked, quantitative biases.
- Primary Cause: Enzyme- and gene-specific biases in reverse transcription. Different reverse transcriptase enzymes exhibit varying efficiencies when reverse transcribing different RNA targets, leading to inconsistent cDNA yields [15]. One study demonstrated that a 2-fold increase in RNA input into an RT reaction resulted in an average Cq decrease of only 0.39, substantially lower than the theoretical decrease of 1.0, indicating significant non-linearity [15].
- Solution:
- Validate your RT enzyme: Perform dilution series with your specific RNA targets and chosen RT enzyme to assess linearity [15].
- Use a consistent priming strategy: Reactions primed by target-specific primers are linear over a wider range than those primed by random primers [16]. Consistently use the same priming strategy (oligo-dT, random hexamers, or gene-specific) across all experiments [16].
- Include RT controls: Run RT reactions at least in duplicates starting from the RNA template to account for variability inherent to the RT step [16].
Why do I get different gene expression results when I use different commercial reverse transcription kits?
Different RT kits contain distinct reverse transcriptase enzymes and optimized buffer compositions, which can dramatically alter the efficiency of cDNA synthesis for specific targets.
- Primary Cause: Reverse transcriptase-specific bias. Research shows that commercial RT kits can produce opposing results for the same sample [15]. For example, when comparing two kits (iScript and Transcriptor), one kit showed a compressed Cq increase for 5.8S rRNA but not U1 snRNA, while the other kit showed the reverse pattern [15]. This can lead to an apparent differential expression of over 5-fold between dilutions of the same RNA depending on the kit used [15].
- Solution:
- Kit Consistency: Once a project is initiated, use the same RT kit and lot number throughout the study to minimize inter-experiment variability.
- Report Kit Details: Adhere to MIQE guidelines by thoroughly documenting the RT kit, enzyme, and protocol used in your publications [15].
- Empirical Validation: Do not assume kit performance; validate your specific targets with the chosen kit.
How does RNA integrity affect my assay reproducibility, and how can I mitigate this?
Compromised RNA integrity is a major source of variability, but its effect is not uniform across all targets, leading to skewed results.
- Primary Cause: Amplicon-specific bias from degraded RNA. Partly degraded RNA samples affect different targets unevenly. In one experiment, most amplicons showed expected Cq value increases with degraded template, but the U1 snRNA amplicon showed a decrease, likely due to its structured nature and higher resistance to degradation [15]. Normalizing a target gene to a reference gene that responds differently to degradation can create a false differential expression of ~2-fold between intact and fragmented samples of the same RNA [15].
- Solution:
- Quality Control: Rigorously assess RNA Integrity Numbers (RIN) using automated electrophoresis systems and set a minimum acceptable threshold for your experiments.
- Assess Target Stability: Evaluate how your genes of interest and proposed reference genes behave under different RNA integrity conditions [16] [15].
- Use Multiple Reference Genes: Employ a panel of empirically validated reference genes to dampen technical and biological spurious readings, rather than relying on a single gene [15].
What causes non-specific amplification and high background in my PCR, and how can I improve specificity?
Non-specific products and primer-dimers often result from suboptimal reaction conditions and enzyme activity at low temperatures.
- Primary Cause: Premature enzyme activity and suboptimal cycling conditions. DNA polymerases can exhibit activity at room temperature, leading to non-specific priming and primer-dimer formation before the PCR begins [12] [17].
- Solution:
- Use Hot-Start Polymerases: Employ hot-start DNA polymerases that remain inactive until a high-temperature activation step, dramatically improving specificity [12] [17] [18].
- Optimize Annealing Temperature: Use a gradient thermal cycler to determine the optimal annealing temperature for each primer set [12] [17]. Increase the annealing temperature stepwise in 1-2°C increments if non-specific amplification occurs [12].
- Optimize Mg²⁺ Concentration: Adjust Mg²⁺ concentration in 0.2-1 mM increments, as excessive concentrations can promote non-specific binding [12] [17].
- Use PCR Additives: For GC-rich templates, use additives like DMSO (1-10%), glycerol, or formamide (1.25-10%) to help denature secondary structures and improve specificity [18].
Frequently Asked Questions (FAQs)
Q: How critical is master mix selection for assay reproducibility?
Master mix selection is fundamental for reproducible results. Real-time PCR master mixes are pre-mixed solutions containing essential components like buffers, enzymes, and dNTPs [19]. However, different formulations are optimized for specific applications (e.g., gene expression, genotyping, pathogen detection) [19]. Using a master mix not validated for your specific application can introduce variability. For maximum reproducibility, choose a master mix designed for your application and use the same product and lot number across all experiments in a study.
Q: What are the key factors to consider when selecting a DNA polymerase for high-fidelity applications?
For applications like cloning, sequencing, or mutagenesis, polymerase fidelity is critical. Key considerations include:
- Proofreading Activity: DNA polymerases with 3'→5' exonuclease activity (e.g., Pfu, Q5) have significantly higher fidelity and lower error rates than those without (e.g., Taq) [17] [18].
- Error Rate: Taq polymerase has an error rate between 2×10⁻⁴ to 2×10⁻⁵ errors/base/doubling, while high-fidelity archaeal polymerases have much lower error rates [18].
- Reaction Conditions: Excess Mg²⁺ concentration and unbalanced dNTP concentrations can increase error rates, even with high-fidelity enzymes [12].
Q: How can automation improve the reproducibility of my PCR workflows?
Automation significantly enhances reproducibility by:
- Reducing Human Error: Automated liquid handling systems ensure precise, consistent reagent dispensing across all wells and plates [20].
- Eliminating Contamination: Minimizes manual pipetting steps that can introduce cross-contamination.
- Standardizing Protocols: Automated systems execute identical protocols repeatedly, removing technician-to-technician variability [20].
- Improving Data Analysis: Automated analysis platforms can record cycle thresholds, flag abnormal amplification curves, and generate standardized reports, reducing interpretation biases [20].
Q: What is the impact of temperature control on enzyme assay reproducibility?
Temperature stability is paramount for reproducible enzyme kinetics. Just a one-degree temperature change can lead to a 4-8% variation in enzyme activity [21]. For PCR and enzyme assays, ensure your thermal cycler or incubator is properly calibrated and maintains stable, uniform temperatures across all samples. For microplate-based assays, be aware of "edge effects" where circumferential wells evaporate faster than central wells, causing temperature and concentration inconsistencies [21].
Table 1: Impact of Technical Variables on Assay Reproducibility
| Variable | Impact on Reproducibility | Quantitative Effect | Recommended Optimization |
|---|---|---|---|
| Reverse Transcription | High variability in cDNA synthesis efficiency | 2-fold RNA input increase → Cq decrease of only 0.39 (theoretical=1.0) [15] | Use consistent priming strategy; include RT duplicates [16] |
| RNA Integrity | Degradation affects targets differentially | Cq increase of 2.00 for eEF1A1 vs 0.68 decrease for U1 in degraded RNA [15] | Set minimum RIN threshold; validate reference gene stability [15] |
| Temperature Control | Direct impact on enzyme activity | 1°C change → 4-8% variation in enzyme activity [21] | Use calibrated equipment; avoid microplate edge effects [21] |
| DNA Polymerase Fidelity | Affects error rate in amplified products | Taq error rate: 2×10⁻⁴ to 2×10⁻⁵ errors/base/doubling [18] | Use high-fidelity enzymes with proofreading for cloning/sequencing [17] |
| Annealing Temperature | Critical for amplification specificity | Suboptimal temperature causes nonspecific products and primer-dimers [12] | Optimize using gradient PCR in 1-2°C increments [12] |
Table 2: Reproducibility Challenges in Biomedical Research
| Reproducibility Issue | Prevalence | Impact |
|---|---|---|
| General Irreproducibility | 50-89% of published biomedical research [16] | Wasted research funding; slowed medical advances [16] |
| Inadequate Reporting | 40% of in vivo studies lack complete animal characteristics [16] | Inability to replicate or validate experimental conditions |
| Resource Identification | 54% of resources in publications cannot be adequately identified [16] | Impossible to source identical reagents for replication |
| RT-qPCR Bias | Apparent false differential expression >5-fold with different RT kits [15] | Erroneous conclusions about gene expression changes |
Experimental Protocols
Protocol 1: Systematic Evaluation of Reverse Transcription Linearity
Purpose: To quantify the linearity and efficiency of your reverse transcription step for specific gene targets, identifying potential biases before main experiments [15].
Materials:
- High-quality total RNA sample
- Selected reverse transcription kit(s)
- Real-time PCR system and reagents
- Primers for your genes of interest and reference genes
Procedure:
- Prepare a 2-fold dilution series of your RNA sample (e.g., 75 ng, 150 ng, 300 ng, 600 ng) in nuclease-free water.
- For each RNA concentration, perform reverse transcription according to your kit's protocol. Include a no-RT control for each concentration to detect genomic DNA contamination.
- Prepare a 2-fold dilution series of each resulting cDNA (e.g., undiluted, 1:2, 1:4).
- Run qPCR for all your targets across all cDNA dilutions and RNA input concentrations.
- Data Analysis: Calculate the Cq change for each 2-fold dilution. The theoretical value is 1.0. Values significantly lower indicate compression and non-linearity in your RT step for that specific target [15].
Protocol 2: Design of Experiments (DoE) for Rapid Enzyme Assay Optimization
Purpose: To efficiently identify optimal assay conditions and factor interactions in less time than traditional one-factor-at-a-time approaches [22].
Materials:
- Purified enzyme of interest
- Substrates and buffers
- Plate reader or discrete analyzer capable of kinetic measurements
Procedure:
- Define Factors and Ranges: Identify critical factors (e.g., pH, ionic strength, Mg²⁺ concentration, temperature, enzyme concentration) and their test ranges based on literature and preliminary experiments.
- Fractional Factorial Design: Use statistical software to create an experimental design that screens multiple factors simultaneously to identify the most significant ones.
- Response Surface Methodology: After identifying key factors, design a second set of experiments to model the response surface and locate the optimum conditions.
- Validation: Confirm the predicted optimum with experimental replicates.
This approach exemplified with human rhinovirus-3C protease optimization, can identify optimal conditions in less than 3 days compared to over 12 weeks using traditional methods [22].
Workflow Visualization
Assay Reproducibility Workflow
This workflow outlines the systematic approach to achieving reproducible results in RT-PCR assays, highlighting critical decision points at each stage where reagent sourcing and enzyme selection significantly impact reproducibility.
Research Reagent Solutions
Table 3: Essential Reagents for Reproducible RT-PCR
| Reagent Category | Function | Key Selection Criteria | Reproducibility Impact |
|---|---|---|---|
| Reverse Transcriptase | Converts RNA to cDNA for amplification | Enzyme source, processivity through secondary structures, priming preference (oligo-dT/random/gene-specific) | High: Different enzymes show gene-specific biases; kit choice can cause >5-fold expression differences [15] |
| DNA Polymerase | Amplifies DNA template | Fidelity (error rate), thermostability, hot-start capability, processivity (bases incorporated/second) | High: Affects specificity, yield, and accuracy of amplified products; critical for downstream applications [12] [18] |
| Master Mix | Provides optimized reaction environment | Buffer composition, Mg²⁺ concentration, stabilizers, inclusion of additives | Medium-High: Pre-mixed solutions reduce pipetting variability but must be matched to application [19] |
| dNTPs | Building blocks for DNA synthesis | Purity, concentration balance, stability | Medium: Unbalanced concentrations increase PCR error rates; degradation affects yield [12] |
| Mg²⁺ Solution | Cofactor for polymerase activity | Concentration, salt type (Cl⁻ vs SO₄²⁻) | High: Concentration affects enzyme activity, specificity, and fidelity; optimal range is narrow [12] [18] |
| PCR Additives | Modify nucleic acid properties | Type (DMSO, formamide, BSA, betaine), concentration | Medium: Can improve specificity and yield for difficult templates but require optimization [18] |
FAQ: How Thermocycler Performance Introduces Variability
1. How does the thermal cycler's block uniformity affect my qPCR results? The precision with which a thermal cycler maintains temperature uniformity across all wells in its block is a critical source of variability. Even minor inconsistencies can lead to differences in amplification efficiency between samples. This is because the annealing and denaturation steps are highly temperature-sensitive. Non-uniform heating can cause some reactions to proceed less efficiently or not at all, skewing quantification cycles (Cqs) and compromising the accuracy of your quantitative data [23].
2. Can the thermocycler's ramp rate impact my assay? Yes, the speed at which the instrument transitions between temperatures (ramp rate) can influence reaction specificity and efficiency. While faster ramp rates can reduce overall run time, they may not provide sufficient time for complete primer annealing or enzyme binding in some assays, potentially leading to reduced yield or the formation of non-specific products. It is essential to validate that your specific PCR protocol is compatible with the instrument's ramp rate capabilities [24].
3. Why is the optical detection system of a real-time PCR thermocycler important? In real-time qPCR, the optical system is responsible for accurately measuring fluorescence signals during each cycle. Variability in the sensitivity, calibration, or uniformity of the excitation and detection optics across the block can lead to significant differences in recorded fluorescence. This optical variability directly impacts the determination of the Cq value, a cornerstone of quantitative analysis, and can affect the dynamic range and limit of detection of your assay [23].
4. How can I minimize variability introduced by the thermocycler? To minimize instrument-derived variability, adhere to the following practices:
- Regular Calibration and Maintenance: Follow the manufacturer's schedule for thermal and optical calibration to ensure the instrument performs to specification.
- Use a Single Instrument per Study: For a multi-instrument study, use the same make and model with identical protocols and validate consistency across them beforehand.
- Include Proper Controls: Always run a standard curve and positive controls on every plate to monitor inter-assay performance and efficiency [25] [26].
- Position Replicates Carefully: When setting up technical replicates, distribute them across different locations on the block to average out any spatial heterogeneity in temperature or optics.
Troubleshooting Guide: Thermocycler-Related Issues
| Problem | Potential Thermocycler-Related Cause | Recommended Solution |
|---|---|---|
| High inter-assay variation (results not reproducible between runs) | Temperature calibration drift over time; inconsistent block uniformity. | Perform instrument calibration and maintenance as recommended by the manufacturer. Use a multi-position thermometer to verify block uniformity [12]. |
| High variation between replicates on the same plate | Poor spatial uniformity of temperature across the block; inconsistencies in optical scanning. | Distribute replicate samples across different well positions. Contact technical support for optical and thermal performance verification [23]. |
| Low amplification efficiency | Suboptimal or fluctuating temperatures during critical steps (e.g., annealing, extension). | Verify and calibrate the instrument. Ensure the programmed protocol (times, temperatures) matches the validated method for your assay [12]. |
| Non-specific amplification or primer-dimers | Inaccurate temperature control during low-stringency steps like annealing. | Verify the actual block temperature during the annealing step. Use a thermal gradient function to empirically determine the optimal annealing temperature for your primer set [27]. |
| Inconsistent standard curve data | Combined effect of thermal and optical performance variability, affecting Cq determination. | Include a standard curve in every run instead of relying on a historical "master curve" to account for run-to-run instrumental variance [25]. |
Quantitative Data on Inter-Assay Variability
The following data, derived from a study evaluating RT-qPCR standard curves for virus detection, highlights the inherent variability between assays, which can be influenced by instrument performance. The study conducted 30 independent standard curve experiments.
Table 1: Efficiency and Variability of Viral Assays [25]
| Viral Target | Mean Efficiency (%) | Inter-assay CV for Efficiency | Key Findings |
|---|---|---|---|
| SARS-CoV-2 (N2 gene) | 90.97% | 4.38% - 4.99% | Showed the largest variability and lowest efficiency among the targets tested. |
| Norovirus GII (NoVGII) | >90% | Highest variability | Demonstrated better sensitivity but also the highest inter-assay variability in efficiency. |
| All other viruses | >90% | Variability observed | Adequate efficiency but demonstrated consistent inter-assay variability independent of viral concentration. |
Conclusion from the data: The observed heterogeneity in key parameters like efficiency underscores the necessity of including a standard curve in every experiment to obtain reliable and reproducible quantitative results, thereby controlling for instrumental and reagent variability [25].
Experimental Protocol: Verifying Thermocycler Block Uniformity
Objective: To empirically assess the temperature consistency across the thermocycler block, a major factor in reaction variability.
Materials:
- Thermocycler to be tested
- Multi-position temperature verification system (e.g., a thermal probe array or calibrated thermocouples)
- A standard PCR tube plate
Methodology:
- Setup: Place the temperature verification sensors in multiple wells across the block, following a pattern that covers corners, edges, and the center. Use a plate filled with water or a standard reaction mix to simulate realistic thermal mass.
- Programming: Program the thermocycler to run a representative protocol. This should include:
- A prolonged denaturation step (e.g., 95°C for 2 minutes).
- A high number of cycles (e.g., 30-35) with a short denaturation (e.g., 95°C for 15 sec), a typical annealing temperature (e.g., 60°C for 30 sec), and an extension (e.g., 72°C for 30 sec).
- A final hold at 4°C.
- Data Collection: Start the protocol and record the temperature measured by each sensor at each stable setpoint (denaturation, annealing, extension).
- Analysis: Calculate the mean temperature and the range (maximum minus minimum) for each setpoint across all measured positions.
Interpretation: A well-performing block should show a very narrow temperature range (e.g., < ±0.5°C) across all positions at each setpoint. A larger range indicates poor uniformity, which can be a source of well-to-well variability in your PCR results. This data should be used for preventative maintenance and to understand the performance limits of the instrument.
Workflow Visualization
The Scientist's Toolkit: Research Reagent Solutions
Table 2: Essential Materials for RT-qPCR Workflow Variance Reduction
| Item | Function in Variance Reduction |
|---|---|
| Quantitative Synthetic RNA Standards | Provides an absolute reference for generating standard curves in every run, controlling for inter-assay variability in efficiency [25]. |
| TaqMan Fast Virus 1-Step Master Mix | Pre-mixed, optimized reagents reduce pipetting steps and handling errors. "Fast" formulations can shorten protocols, potentially reducing cumulative temperature-related variability [25]. |
| Validated Primer & Probe Sets | Assays with well-characterized performance and minimal primer-dimer formation enhance specificity and consistency, reducing noise in the data [27]. |
| Instrument Calibration Kits | Specialized tools for verifying the thermal and optical performance of the thermocycler, ensuring it operates within specified tolerances. |
| Nuclease-Free Water | A pure, uncontaminated water source is critical for preventing degradation of RNA templates and reaction components, a major source of failed reactions. |
| High-Quality RNA Isolation Kits | Consistent and pure RNA extraction is the first step to reliable reverse transcription. Kits with built-in genomic DNA removal steps add another layer of specificity [28]. |
The Role of MIQE Guidelines in Standardizing Experimental Reporting
Quantitative real-time PCR (qPCR) and its reverse transcription variant (RT-qPCR) represent gold standard techniques in molecular biology for detecting and quantifying nucleic acids. However, the reliability of thousands of peer-reviewed publications has been compromised by inadequate reporting of experimental details and the use of flawed protocols. The Minimum Information for Publication of Quantitative Real-Time PCR Experiments (MIQE) guidelines were established in 2009 to address these critical issues by providing a standardized framework for conducting, documenting, and reporting qPCR experiments. By promoting experimental transparency and ensuring consistency between laboratories, MIQE compliance helps maintain the integrity of the scientific literature and is particularly crucial for reducing workflow variances in RT-PCR experiments.
FAQs: Understanding MIQE Guidelines
What are the MIQE guidelines and why were they created?
The MIQE (Minimum Information for Publication of Quantitative Real-Time PCR Experiments) guidelines are a set of standards devised to improve the quality and transparency of quantitative real-time PCR experiments. They were created in response to a growing concern about the technical adequacy of qPCR data published in scientific literature, which was often insufficiently documented, making it impossible to reproduce results or evaluate their validity. The guidelines cover all aspects of qPCR experiments, from experimental design and sample preparation to data analysis and reporting. Following these guidelines ensures that experiments are well-documented and that results can be independently verified by other scientists, which is essential for advancing scientific knowledge.
What are the most critical MIQE requirements for RT-qPCR experiments?
For reverse transcription quantitative PCR (RT-qPCR) experiments, several MIQE requirements are particularly critical for ensuring data reliability. These include detailed documentation of sample processing and storage conditions, accurate assessment of RNA integrity and quality, demonstration of the absence of inhibitors, comprehensive description of reverse transcription reaction conditions, provision of primer and probe sequences, validation of amplification efficiency using calibration curves, and proper normalization using validated reference genes. The guidelines also emphasize the importance of including appropriate controls such as no template controls and no amplification controls with every experiment.
How do MIQE guidelines address the problem of normalization in qPCR?
Normalization is an essential component of reliable qPCR data analysis, and the MIQE guidelines provide specific recommendations for this critical step. The guidelines emphasize that mRNA data should be normalized using reference genes that must be experimentally validated for particular tissues or cell types under specific experimental conditions. Unless fully validated single reference genes are used, normalization should be performed against multiple reference genes chosen from a sufficient number of candidate reference genes tested from independent pathways. The use of fewer than three reference genes is generally not advisable, and reasons for choosing fewer must be specifically addressed. For large-scale miRNA expression profiling experiments, normalization should be performed against the mean expression value of all expressed miRNAs.
What technical validation does MIQE require for qPCR assays?
MIQE requires comprehensive technical validation of qPCR assays to ensure their specificity, efficiency, and sensitivity. Essential validation parameters include demonstration of primer specificity through in silico analysis and empirical methods, determination of PCR efficiency using calibration curves with reported slope, y-intercept, and correlation coefficients, establishment of the linear dynamic range, and determination of the limit of detection. The guidelines also require reporting the method for Cq determination, outlier identification and treatment, and results for no template controls. For assays using intercalating dyes like SYBR Green I, confirmation of amplification specificity through melt curve analysis is essential.
Troubleshooting Guides
Normalization Strategy Selection
Table 1: Comparison of Normalization Strategies for qPCR Experiments
| Normalization Method | Principle | Advantages | Limitations | Recommended Use Cases |
|---|---|---|---|---|
| Single Reference Gene | Uses one constitutively expressed gene for calibration | Simple, requires minimal resources | Prone to error if reference gene expression varies; unreliable without validation | Only when a single gene has been rigorously validated for specific conditions |
| Multiple Reference Genes | Uses the geometric mean of several stable genes | More robust than single gene; reduces bias | Requires identification and validation of multiple suitable genes | Most gene expression studies; recommended default approach |
| Total RNA Measurement | Normalizes to total RNA quantity input | Does not require stable reference genes | Assumes constant cellular transcriptome; does not account for RNA quality variations | Initial calibration; not recommended as sole method for final analysis |
| Quantile Normalization | Assumes identical expression distribution across samples | Data-driven; does not require pre-selected genes | Requires large gene sets; may obscure biological variations | High-throughput qPCR with hundreds of targets |
| Rank-Invariant Normalization | Uses genes with stable rank order across samples | Data-driven; adapts to experimental conditions | Requires sufficient sample numbers for stable gene selection | Experiments with multiple samples and sufficient reference targets |
Problem: Inconsistent results between replicates and experiments. Solution: Implement comprehensive assay validation as required by MIQE guidelines. Develop calibration curves with serial dilutions to determine amplification efficiency (should be 90-110%), linear dynamic range (R² > 0.99), and limit of detection. Include inter-run calibrators when samples cannot be analyzed in the same run to correct for run-to-run variations.
Problem: Unstable normalization with traditional housekeeping genes. Solution: Systematically validate multiple candidate reference genes (minimum of 3) for your specific experimental conditions using algorithms such as GeNorm or NormFinder. Avoid using commonly employed reference genes like GAPDH or ACTB without experimental validation, as their expression can vary significantly across different tissues and experimental conditions.
Problem: High variability in standard curves between experiments. Solution: Include a standard curve in every qPCR run rather than relying on historical curves or master curves. Recent research demonstrates that although standard curves may show adequate efficiency (>90%), significant inter-assay variability still occurs, which can substantially impact quantitative accuracy, particularly in applications requiring precise quantification such as wastewater-based epidemiology or viral load monitoring.
Sample Quality and Integrity Issues
Problem: Degraded RNA samples affecting quantification accuracy. Solution: Implement rigorous RNA quality assessment using methods such as microfluidics-based systems or 3':5'-type assays. Report RNA Integrity Numbers (RIN/RQI) for all samples and avoid quantitatively comparing RNAs with widely dissimilar quality (e.g., RIN values of 4.5 versus 9.5). Use specialized extraction protocols for specific RNA types such as miRNAs, as extraction efficiency is reagent-dependent.
Problem: Presence of inhibitors in nucleic acid preparations. Solution: Test each sample or representative samples for the absence of inhibitors using either an "alien" spike or a dilution series of target genes. The extent of residual genomic DNA contamination must be reported, ideally for each sample, by comparing quantification cycles obtained with and without reverse transcription for each nucleic acid target.
Data Analysis and Interpretation Challenges
Problem: High variability in fluorescence thresholds and Cq determination. Solution: Establish consistent threshold setting methods across all experiments. While many qPCR instruments provide automated threshold settings, these may require manual adjustment to ensure consistency across runs. Document and report the method used for Cq determination, as this represents a significant source of inter-assay variability.
Problem: Inadequate experimental design leading to confounding technical variation. Solution: Implement a sample maximization strategy (running as many samples as possible in the same run) rather than a gene maximization strategy (analyzing multiple genes in the same run) to minimize technical, run-to-run variation between different samples when comparing gene expression levels.
Experimental Protocols for MIQE Compliance
Reference Gene Validation Protocol
- Select Candidate Genes: Choose 3-8 candidate reference genes from different functional pathways to reduce the chance of co-regulation.
- Design Sequence-Specific Primers: For plant genomes with homologous genes, design primers based on single-nucleotide polymorphisms present in all homologous sequences to ensure specificity.
- Establish Optimal PCR Conditions: Optimize primer sequences, annealing temperatures, primer concentrations, and cDNA concentration range for each reference gene.
- Generate Standard Curves: Create serial dilutions of cDNA to generate standard curves for each primer pair. The optimal standard curve should achieve R² ≥ 0.9999 and amplification efficiency (E) = 100 ± 5%.
- Evaluate Expression Stability: Use algorithms such as GeNorm, NormFinder, or BestKeeper to evaluate the expression stability of candidate reference genes under specific experimental conditions.
- Determine Optimal Number of Reference Genes: Calculate the pairwise variation (V) between sequential normalization factors to determine the optimal number of reference genes required for reliable normalization.
qPCR Assay Validation Protocol
Primer Specificity Validation:
- Perform in silico specificity analysis using BLAST or similar tools.
- Validate empirically using gel electrophoresis, melt curve analysis, or sequencing of amplification products.
- Confirm absence of primer-dimer formation in no template controls.
Efficiency Determination:
- Prepare a 5-10 point serial dilution series (at least 5 orders of magnitude) of template cDNA.
- Run each dilution in duplicate or triplicate across the same plate.
- Plot Cq values against log template concentration and calculate efficiency from the slope: Efficiency = (10^(-1/slope) - 1) × 100%.
- Acceptable efficiency ranges from 90-110% with R² > 0.99.
Dynamic Range and Sensitivity Assessment:
- Determine the linear dynamic range where amplification efficiency remains constant.
- Establish the limit of detection (LOD) as the lowest concentration where 95% of positive replicates are detected.
- Determine the limit of quantification (LOQ) based on replicate analysis in a standard curve.
Essential Research Reagent Solutions
Table 2: Key Reagents and Materials for MIQE-Compliant qPCR Experiments
| Reagent/Material | Function | MIQE Compliance Considerations |
|---|---|---|
| Nucleic Acid Extraction Kits | Isolation of high-quality RNA/DNA | Document complete protocol including any modifications; report quality metrics (RIN, A260/280 ratios) |
| Reverse Transcriptase | cDNA synthesis from RNA templates | Report manufacturer, concentration, reaction conditions, priming method (oligo-dT, random hexamers, or gene-specific) |
| qPCR Master Mix | Provides components for amplification | Report manufacturer, formulation, concentration of components (Mg²⁺, dNTPs); specify whether contains ROX reference dye |
| Sequence-Specific Primers | Target amplification | Report sequences, concentrations, manufacturer, purification method; validate specificity |
| Hydrolysis Probes | Specific detection of amplified targets | Report sequences, modifications, dye identities, and quenchers; concentration in final reaction |
| Validated Reference Genes | Normalization of sample-to-sample variation | Report identity, validation data for specific experimental conditions; use multiple validated genes |
| Quantification Standards | Standard curve generation for absolute quantification | Document source, preparation method, stability testing; use for efficiency determination |
Workflow Diagrams for MIQE Implementation
MIQE-Compliant qPCR Workflow
Reference Gene Selection and Validation Process
The implementation of MIQE guidelines represents a critical step toward enhancing the reliability and reproducibility of qPCR-based research. By providing a comprehensive framework for experimental design, execution, and reporting, these guidelines address the principal sources of variance in RT-PCR workflows. The troubleshooting guides, standardized protocols, and analytical frameworks presented in this technical support center provide researchers with practical tools to overcome common challenges in qPCR experiments. As the field continues to evolve with emerging technologies such as digital PCR, the principles embodied in the MIQE guidelines remain essential for maintaining scientific rigor and ensuring that research findings are technically sound, reproducible, and meaningful to the scientific community.
Implementing a Standardized and Robust RT-qPCR Workflow
Within the context of reducing variance in the RT-PCR workflow, the initial RNA extraction step is arguably the most critical. The purity, integrity, and quantity of the isolated RNA directly influence the accuracy and reproducibility of all subsequent data. This guide addresses common challenges and provides targeted troubleshooting strategies to ensure that your RNA extraction process yields reliable, high-quality material, thereby minimizing experimental variance at its source.
Troubleshooting Guide: Common RNA Extraction Issues
FAQ: How can I prevent RNA degradation during extraction? RNA is highly susceptible to degradation by RNases, which are ubiquitous and stable enzymes [29].
- Solution:
- RNase Decontamination: Decontaminate your workspace, pipettes, and equipment before starting. Use a specialized RNase decontamination solution, wiping down surfaces and then following with dH₂O or 70% ethanol [29].
- Proper PPE: Always wear clean gloves and a lab coat. Change gloves frequently, especially after touching potentially contaminated surfaces, and never touch your face or hair with gloved hands [29].
- Inhibit Endogenous RNases: Homogenize samples immediately upon collection in a chaotropic lysis buffer (e.g., containing guanidinium isothiocyanate) or flash-freeze them in liquid nitrogen. For tissues, stabilization solutions like RNAlater can be used to protect RNA before homogenization [30].
- Solution:
FAQ: My RNA has low purity, as indicated by abnormal A260/A280 and A260/A230 ratios. What does this mean and how can I fix it? Spectrophotometric absorbance ratios are key indicators of RNA purity and can reveal specific contaminants [31].
- Solution: The table below interprets common ratio abnormalities and their solutions.
| Purity Ratio | Ideal Value | Low Value Indicates | Troubleshooting Action |
|---|---|---|---|
| A260/A280 | ~2.0 (for RNA) [31] | Protein or phenol contamination [29] [31] | Ensure proper phase separation during phenol-chloroform extraction; avoid aspirating the interphase or organic layer [32]. |
| A260/A230 | 2.1 - 2.3 [31] | Contaminants like chaotropic salts (e.g., guanidinium), EDTA, or carbohydrates [31] | Perform additional wash steps with ethanol-based buffers during column purification; ensure complete removal of the wash buffer before elution [30]. |
FAQ: How do I know if my RNA is intact and not fragmented? While purity is important, it does not guarantee the RNA is intact. Integrity refers to the RNA being largely unfragmented [31].
- Solution:
- Agarose Gel Electrophoresis: Visualize the RNA. Intact total RNA should show sharp, clear ribosomal RNA bands (28S and 18S in mammalian RNA), with the 28S band approximately twice the intensity of the 18S band.
- Automated Electrophoresis Systems: For a more quantitative measure, use systems like the Agilent Bioanalyzer, which provides an RNA Integrity Number (RIN). A RIN of 7 or higher is generally recommended for sensitive downstream applications like qRT-PCR [30].
- Solution:
FAQ: My RNA yield is lower than expected. What are the potential causes? Several factors during sample handling and processing can lead to poor RNA recovery.
- Solution:
- Incomplete Homogenization: Ensure tissues are thoroughly ground to a fine powder under liquid nitrogen and homogenized completely in lysis buffer. For fibrous tissues, use a more vigorous disruption method [33].
- Overloaded Column: Do not exceed the binding capacity of the silica membrane in column-based kits [30].
- Incomplete Elution: When using column-based kits, ensure the elution buffer is applied to the center of the membrane and let it incubate for 1-2 minutes before centrifugation to increase yield [30].
- Solution:
FAQ: How can I effectively remove genomic DNA contamination from my RNA prep? Contaminating DNA can lead to false-positive signals in RT-PCR and qPCR assays [30].
- Solution: The most effective and convenient method is to perform an on-column DNase digestion during the extraction protocol. This involves adding a DNase I solution directly onto the silica membrane and incubating to digest any bound DNA, which is then washed away [30]. This is generally more efficient and results in higher RNA recovery than performing digestion after the RNA has been purified.
Essential Protocols for High-Quality RNA Extraction
Protocol 1: RNA Extraction from Fresh/Frozen Tissue using TRIzol
This classic phenol-guanidinium method is robust and applicable to a wide variety of sample types [32].
- Sample Preparation: Rapidly freeze tissue in liquid nitrogen. Grind the tissue to a fine powder using a mortar and pestle, keeping the tissue frozen by adding liquid nitrogen [32].
- Homogenization: Transfer the powder to a tube containing TRIzol reagent (e.g., 1 mL per 50-100 mg of tissue) and homogenize completely until no visible tissue fragments remain [30].
- Phase Separation: Incubate the homogenate for 5 minutes at room temperature. Add chloroform (0.2 mL per 1 mL of TRIzol). Cap the tube securely and shake vigorously for 15 seconds. Incubate for 2-3 minutes [32].
- Centrifugation: Centrifuge at 12,000 × g for 15 minutes at 4°C. The mixture will separate into three phases: a lower red phenol-chloroform phase, an interphase, and a colorless upper aqueous phase containing the RNA [32].
- RNA Precipitation: Transfer the aqueous phase only to a new tube. To avoid contamination, carefully aspirate the supernatant without disturbing the interphase. Add an equal volume of 100% isopropanol (and 1 μL of glycogen as a coprecipitant) to the aqueous phase. Incubate at -20°C for at least 30 minutes to precipitate the RNA [32].
- RNA Pellet: Centrifuge at 12,000 × g for 30 minutes at 4°C. A gel-like RNA pellet should form at the bottom of the tube.
- Wash: Carefully decant the supernatant. Wash the pellet with 75% ethanol (prepared with RNase-free water) by vortexing and centrifuging at 7,500 × g for 5 minutes at 4°C.
- Redissolution: Air-dry the pellet briefly for 5-10 minutes (do not over-dry). Dissolve the pure RNA in RNase-free water or TE buffer pH 7.5 [29].
Protocol 2: Column-Based RNA Extraction (e.g., Silica Membrane Kits)
This method is simpler, faster, and avoids the use of toxic phenol, making it ideal for routine use [29] [30].
- Lysate Preparation: Lyse and homogenize your sample in a guanidinium-based lysis buffer containing a denaturant and β-mercaptoethanol [33] [30].
- Optional DNase Digestion: For protocols involving an on-column DNase digestion, apply the DNase I incubation mix directly to the center of the silica membrane and incubate for 15 minutes at room temperature [30].
- Bind RNA: Apply the lysate (often mixed with ethanol) to the spin column and centrifuge. RNA binds to the silica membrane, while contaminants pass through.
- Wash: Perform two wash steps using ethanol-based wash buffers. Centrifuge after each wash to remove the flow-through [30].
- Elute: Transfer the column to a clean collection tube. Apply RNase-free water or elution buffer to the center of the membrane, let it stand for 1-2 minutes, and centrifuge to elute the purified RNA [30].
RNA Extraction and Assessment Workflow
The following diagram illustrates the key decision points and quality control checkpoints in a robust RNA extraction workflow.
The Scientist's Toolkit: Essential Reagents and Kits
The table below summarizes key reagents and materials used for successful RNA extraction.
| Item | Function & Rationale |
|---|---|
| RNase Decontamination Solution (e.g., RNaseZAP) | Inactivates RNases on work surfaces, pipettors, and equipment to prevent introduction of external RNases [29] [30]. |
| Chaotropic Lysis Buffer (e.g., with Guanidinium) | Powerful denaturant that inactivates RNases, disrupts cells, and dissociates nucleoproteins, releasing RNA while protecting it from degradation [30] [32]. |
| RNase-Free Tubes and Tips | Certified to be free of RNases, preventing the introduction of contaminants during liquid handling [29]. |
| TRIzol Reagent | Mono-phasic solution of phenol and guanidine isothiocyanate. Effective for simultaneous disruption of cells, denaturation of proteins, and isolation of RNA from DNA and proteins [30] [32]. |
| Silica Membrane Spin Columns | selectively bind RNA under high-salt conditions, allowing contaminants to be washed away. Provides a rapid, phenol-free purification method [30]. |
| DNase I (RNase-Free) | Enzyme that digests contaminating genomic DNA. On-column treatment is efficient and avoids additional purification steps [30]. |
| RNase-Free Water | Used to elute and dissolve purified RNA. Free of RNases and other contaminants that could affect downstream applications or accurate quantification [29]. |
Optimizing RNA Storage for Long-Term Stability
Even after successful extraction, improper storage can lead to RNA degradation and introduce variance.
- Storage Buffer: For long-term storage, dissolve RNA in RNase-free water or a slightly alkaline buffer like TE (pH 7.5). Avoid acidic conditions, as RNA is susceptible to hydrolysis at low pH [29].
- Temperature: For long-term storage, keep RNA at -70°C to -80°C. For short-term use (up to a month), RNA is stable at 4°C or -20°C [29].
- Handling: Create single-use aliquots to avoid repeated freeze-thaw cycles, which can degrade RNA and lead to accidental RNase contamination [30].
FAQ: Core Protocol Selection
What is the fundamental difference between one-step and two-step RT-PCR?
In one-step RT-PCR, the reverse transcription (RT) and the polymerase chain reaction (PCR) are combined in a single tube and buffer, using a reverse transcriptase along with a DNA polymerase. In contrast, two-step RT-PCR performs these two steps in separate tubes, with individually optimized buffers and reaction conditions [34] [35].
How do I choose between a one-step and a two-step protocol?
The choice depends on your experimental goals, sample characteristics, and throughput needs. The table below summarizes the key differences to guide your decision.
Table 1: Comprehensive Comparison of One-Step vs. Two-Step RT-PCR
| Feature | One-Step RT-PCR | Two-Step RT-PCR |
|---|---|---|
| Workflow & Setup | Combined reaction in a single tube [34] [36]. | Separate, optimized reactions for RT and PCR [34] [36]. |
| Priming Strategy | Only gene-specific primers [34] [37]. | Choice of oligo(dT), random hexamers, or gene-specific primers [34] [35] [36]. |
| Handling Time | Limited hands-on time; faster setup [36] [37]. | More setup and hands-on time [36] [37]. |
| Risk of Contamination | Lower risk due to single, closed-tube reaction [34] [36]. | Higher risk due to multiple open-tube steps and pipetting [34] [36]. |
| Sample Throughput | Ideal for high-throughput processing of many samples [34] [36]. | Less amenable to high-throughput applications [34] [36]. |
| cDNA Archive | No stable cDNA pool is generated; must use fresh RNA for new targets [34] [37]. | A stable cDNA pool is created and can be stored for future analysis of multiple targets [34] [36]. |
| Target Flexibility | Limited to detecting a few targets per RNA sample [34]. | Ideal for analyzing multiple genes from a single RNA sample [34] [37]. |
| Reaction Optimization | A compromise between RT and PCR conditions; harder to optimize [34] [37]. | Easier optimization of each step independently; more flexible [34] [37]. |
| Sensitivity | Can be less sensitive due to compromised reaction conditions [34]. | Often higher sensitivity and cDNA yield [34] [37]. |
| RNA Sample Quality | Committed to the initial RNA input; sensitive to inhibitors [36] [37]. | RNA input can be adjusted; cDNA can be repurified to remove inhibitors [36]. |
The following workflow diagram illustrates the key procedural differences between the two methods.
FAQ: Protocol Optimization and Troubleshooting
Why is my cDNA yield low or absent?
Low cDNA yield can result from several factors related to RNA quality and reaction conditions.
- Degraded RNA: Check RNA integrity by gel electrophoresis or a bioanalyzer. Minimize freeze-thaw cycles and use RNase-free reagents and techniques to prevent degradation [5] [38].
- RNA Secondary Structures: Denature secondary structures by heating the RNA to 65°C for ~5 minutes before reverse transcription, then place it immediately on ice [5].
- Suboptimal Reverse Transcription Temperature: Use a thermostable reverse transcriptase and perform the reaction at a higher temperature (e.g., 50°C or higher) to minimize secondary structures and improve primer binding specificity [5].
- Incorrect Priming Strategy: Ensure your priming method matches your template. Use random primers for bacterial RNA or transcripts without a poly(A) tail, and a mix of random and oligo(dT) primers to improve coverage and efficiency [5] [38].
- Presence of Reverse Transcriptase Inhibitors: Repurify the RNA sample to remove contaminants like salts, alcohols, or phenols. Alternatively, dilute the input RNA to reduce inhibitor concentration, or use a reverse transcriptase known for its resistance to inhibitors [5].
Why am I detecting genomic DNA in my results?
Genomic DNA (gDNA) contamination can lead to false-positive results and inaccurate quantification.
- Solution 1: DNase Treatment: Treat your RNA samples with DNase I prior to the reverse transcription reaction. Ensure the DNase is thoroughly inactivated or removed afterward [35] [5].
- Solution 2: Primer Design for qPCR: For the qPCR step, design primers to span an exon-exon junction. This ensures that amplification will only occur from the processed cDNA, not from the gDNA which contains introns [35].
- Solution 3: Include a "No-RT" Control: Always run a control reaction that contains all components except the reverse transcriptase. Amplification in this control indicates the presence of contaminating DNA [35] [5].
Why is my cDNA truncated or poorly representing my target?
This issue often relates to RNA integrity or the enzyme's ability to synthesize long transcripts.
- Poor RNA Integrity: As with low yield, start by verifying RNA integrity [5].
- Low-Purity RNA Sample: Re-purify RNA to remove contaminants that can interrupt the reverse transcriptase [5].
- Suboptimal Reverse Transcriptase: Select a high-performance reverse transcriptase with high processivity and low RNase H activity for synthesizing long, full-length cDNA transcripts [5].
The Scientist's Toolkit: Essential Reagents and Materials
Table 2: Key Research Reagent Solutions for cDNA Synthesis
| Reagent / Material | Function | Key Considerations |
|---|---|---|
| High-Quality RNA Template | The starting material for cDNA synthesis. Integrity and purity are critical. | Assess quality via A260/A280 ratio and gel electrophoresis. Use nuclease-free water for resuspension [5] [39]. |
| Reverse Transcriptase | Enzyme that synthesizes cDNA from an RNA template. | Choose enzymes with high thermal stability, sensitivity, and resistance to inhibitors. Consider RNase H activity for specific applications [35] [5]. |
| Primers (Oligo(dT), Random, Gene-Specific) | Provides a starting point for the reverse transcriptase. | Oligo(dT): For mRNA with poly-A tails. Random Hexamers: For all RNA types, good for degraded samples. Gene-Specific: For maximum target yield in one-step protocols [35] [36]. |
| RNase Inhibitor | Protects the RNA template from degradation during the reaction. | Crucial for maintaining RNA integrity, especially in lengthy protocols or with low-quality RNA samples [5]. |
| dNTPs | Building blocks for cDNA synthesis. | Use a final concentration of 0.5 mM or less to avoid inhibition of the reaction [38]. |
| No-RT Control | A critical quality control to check for gDNA contamination. | Contains all reaction components except the reverse transcriptase [35] [5]. |
Primer and Probe Design Principles for Optimal Specificity and Efficiency
Core Design Principles
Successful RT-PCR experiments depend on primers and probes designed according to established molecular principles. Adhering to these parameters ensures optimal amplification efficiency, specificity, and accurate quantification.
Table 1: Essential Design Parameters for Primers and Probes
| Parameter | Primers | Probes | Key Considerations |
|---|---|---|---|
| Length | 18–30 bases [40]; 18–24 nucleotides is ideal [41] | 15–30 bases [41]; 20–30 bases for single-quenched [40] | Long primers (>30 bp) hybridize slower and reduce efficiency [41]. |
| Melting Temperature (Tm) | 58–60°C [42]; Optimal 60–64°C [40] | 5–10°C higher than primers [40] [42] | Primer Tms should be within 1–2°C of each other [40] [42]. |
| Annealing Temperature (Ta) | 3–5°C below primer Tm [12] | N/A | Ta too low causes nonspecific binding; too high reduces efficiency [40]. |
| GC Content | 35–65% [40]; Ideal 40–60% [41] | 35–60% [40] [41] | Avoid consecutive G residues (e.g., >4 Gs) [40] [12]. |
| GC Clamp | 1–3 G/C bases in last 5 at 3' end [41] | Avoid 'G' at 5' end [40] [41] | Prevents quenching of 5' fluorophore on probes [40]. |
| Amplicon Length | 70–150 bp for optimal efficiency [40] [42] | N/A | Longer amplicons (up to 500 bp) require extended cycling times [40]. |
Specificity and Secondary Structures
- Complementarity: Screen designs for self-dimers, heterodimers, and hairpins. The ΔG value for any secondary structure should be weaker (more positive) than –9.0 kcal/mol [40].
- On-Target Binding: Always run a BLAST alignment to ensure primers are unique to the desired target sequence and to avoid off-target interactions [40] [42].
- Amplicon Location: For gene expression analysis, design assays to span an exon-exon junction to prevent amplification of contaminating genomic DNA [40] [42].
Troubleshooting Guide: FAQs and Solutions
This section addresses common challenges in RT-PCR experiments related to primer and probe design, providing targeted solutions to reduce workflow variance.
Table 2: Troubleshooting Common RT-PCR Issues
| Problem | Possible Causes | Recommended Solutions |
|---|---|---|
| No or Low Amplification | Poor primer design (low Tm, self-dimers) [12]; Suboptimal Ta [12]; Low template quality/quantity [12]. | Redesign primers following parameters in Table 1. Optimize Ta stepwise in 1–2°C increments [12]. Re-purify template DNA; increase input amount or cycle number [12]. |
| Nonspecific Bands/High Background | Low Ta [12]; High primer concentration [12]; Problematic primer design [12]. | Increase Ta [12]. Optimize primer concentration (typically 0.1–1 μM) [12]. Use hot-start DNA polymerases to prevent nonspecific amplification [12]. |
| Primer-Dimer Formation | High primer concentration [12]; Excessive complementarity at 3' ends [12]; Low Ta [12]. | Lower primer concentration [12]. Redesign primers to avoid 3' complementarity [41]. Increase Ta [12]. |
| Poor PCR Efficiency/Inaccurate Quantification | Long amplicon length [42]; Probe Tm too low [40]; Incorrect probe design/validation [42]. | Keep amplicons between 50–150 bp [42]. Ensure probe Tm is 5–10°C higher than primers [40]. Verify probe sequence, reporter, and quencher [42]. |
Experimental Validation and Optimization
Protocol: Primer and Probe Validation
A robust validation protocol is essential for confirming assay performance. The following methodology, adapted from published work on malaria diagnostics and SARS-CoV-2 detection, provides a framework [43] [44].
- In-silico Validation: Use tools like the IDT OligoAnalyzer or Primer3Plus to confirm Tm, check for secondary structures, and perform BLAST analysis for specificity [44] [40].
- Experimental Specificity Test:
- Setup: Perform RT-PCR reactions using the designed primers/probes with the target template (e.g., a specific virus variant) and non-target templates (e.g., other variants or closely related species) [44].
- Analysis: Specific primers should only amplify the target sequence. For example, in a study for SARS-CoV-2 variants, primers designed for the B.1.1.7 (Alpha) variant successfully amplified only that strain and not the Wuhan reference strain, confirming high specificity [44].
- Efficiency and Sensitivity Determination:
- Standard Curve: Serially dilute (e.g., 10-fold dilutions) a known quantity of target template and run it with the designed assay.
- Calculation: A slope between -3.1 and -3.6 (90–100% efficiency) with a linear R² value >0.98 is considered optimal [45].
- Comparison to Reference Methods: Validate new primer sets against established, commercially available kits or sequencing results to benchmark performance. For instance, the AI-designed primer set "UtrechtU-ORF3a" showed comparable performance to two commercial kits for detecting SARS-CoV-2, correctly identifying all positive (15/15) and negative (5/5) samples [44].
Primer and Probe Design and Validation Workflow
The Scientist's Toolkit: Essential Research Reagents
Table 3: Key Reagents for RT-PCR Assay Development
| Reagent / Tool | Function / Explanation | Example Use Case |
|---|---|---|
| Hot-Start DNA Polymerase | Enzyme inactive at room temperature, reducing non-specific amplification and primer-dimer formation [12]. | Essential for maximizing specificity and yield in all RT-PCR assays, especially multiplex reactions. |
| Double-Quenched Probes | Probes with an internal quencher (e.g., ZEN/TAO) lower background fluorescence, increasing signal-to-noise ratio [40]. | Provides clearer, more accurate quantification, especially for longer probe sequences. |
| Propidium Monoazide (PMA) | Photo-reactive dye that penetrates dead cells with compromised membranes, binding to and suppressing their DNA in PCR [46]. | Viability PCR (vPCR) to detect only live pathogens (e.g., S. aureus in food safety), avoiding false positives from dead cells [46]. |
| PCR Additives (e.g., DMSO) | Co-solvents that help denature GC-rich templates and resolve secondary structures [12]. | Added to reaction mixes to improve amplification efficiency of complex or difficult targets. |
| Online Design Tools (e.g., IDT SciTools, Eurofins) | Automated platforms that apply sophisticated algorithms to design primers and probes based on key parameters [40] [47]. | First step in assay development to generate multiple candidate sequences that meet optimal design criteria. |
Reaction Setup and Plate Layout Strategies to Minimize Pipetting Errors
FAQs
Why is pipetting accuracy so critical in RT-PCR?
Pipetting is a major source of technical variability in RT-PCR. Slight differences in the amounts of template, polymerase, or primers delivered to each well are exponentially amplified during the PCR process, which can significantly alter your Cycle threshold (Ct) values and confound your final results. Minimizing this error is therefore essential for generating high-quality, reproducible data [48].
What is the simplest thing I can do to improve my pipetting accuracy?
Banish distractions. If you are hungry, angry, or distracted, it can negatively impact your technique and your experiment. Try to ensure you have a clear mind when performing critical pipetting steps. Furthermore, for greater accuracy, always pipette larger volumes where possible within your reaction setup, as this reduces the impact of any minor volumetric error [48].
How should I organize my plate layout to minimize errors?
Adopt a systematic, pre-determined strategy. You should consistently set up your plates in the same logical way. For example:
- Load reagents in a set order: For instance, load your master mix first, then your diluted cDNA.
- Organize samples and targets logically: Arrange biological replicates in columns and primer sets for different genes in rows, or vice versa. Pipetting your samples and primers in a fixed order (e.g., control replicates first, then experimental ones, or primers alphabetically) means you can recover your place even if you become distracted [48] [49]. Using a systematic layout also makes the process faster and easier to document.
Are multichannel pipettes less accurate than single-channel pipettes?
Not necessarily. While older multichannel and multi-dispensing pipettes were associated with decreased accuracy, the technology has been greatly improved. Modern multichannel pipettes are now often more accurate than single-channel pipettors and should be utilized to streamline and improve the consistency of your qPCR reactions, especially when loading many identical replicates [48].
What is reverse pipetting and when should I use it?
Reverse pipetting is a technique used for accurate pipetting of viscous liquids. Standard pipetting can lead to under-delivery of viscous solutions like many SYBR-Green master mixes, which contain detergents and glycerol. Reverse pipetting pre-wets the pipette tip and helps to ensure you deliver the intended, accurate volume [48].
Troubleshooting Guide
Problem: High variability between technical replicates
Potential Cause & Solution:
- Cause: Inconsistent pipetting technique or uncalibrated pipettes.
- Solution: Ensure your pipettes are professionally calibrated every 6-12 months. Focus on consistent, deliberate pipetting technique. Practice reverse pipetting for viscous master mixes. Implement a "no distractions" rule during critical setup steps [48].
Potential Cause & Solution:
- Cause: Pipetting errors leading to under-delivery of critical reaction components like template DNA.
- Solution: Pipette larger volumes where possible. For example, instead of a 10 µL total reaction, consider a 20 µL reaction. This reduces the relative impact of any pipetting inaccuracy. Furthermore, verify your template DNA concentration; very low template levels are inherently more variable and can produce unreliable data [48] [50].
Problem: Evidence of contamination or false positives
Potential Cause & Solution:
- Cause: Carryover contamination from previous PCR products, potentially exacerbated by pipetting errors.
- Solution: In addition to standard decontamination protocols, consider using a UDG (uracil DNA glycosylase) carryover prevention system. This involves substituting dTTP with dUTP in your PCR master mix. Any contaminating amplicons from previous runs will contain uracil and can be selectively degraded by UDG treatment before the PCR amplification begins, preventing false positives [50].
Experimental Protocols
Protocol 1: Systematic Plate Layout Design
This protocol uses the concept of row and column keys to create an error-resistant plate plan [49].
- Define Experimental Variables: List all your unique
target_id(e.g., genes: ACT1, BFG2),sample_id(e.g., biological replicates: rep1, rep2, rep3), andprep_type(e.g., +RT, -RT). - Create a Row Key: Assign each
target_idto a specific row on the plate (e.g., Row A: ACT1, Row B: BFG2). - Create a Column Key: Assign each unique combination of
sample_idandprep_typeto a specific column (e.g., Col 1: rep1 +RT, Col 2: rep2 +RT). - Generate Plate Plan: Use software or a spreadsheet to combine the row and column keys, automatically populating the well location (e.g., A1, B2) with the correct experimental variables. This creates a map where the contents of every well are predetermined.
- Visualize the Layout: Before starting the wet-lab work, generate a visual plate layout to confirm the design is logical and covers all necessary controls and replicates.
The workflow for this systematic setup is outlined in the diagram below.
Protocol 2: Stepwise Optimization of qPCR Assays
Before running full experiments, optimize primer and reaction conditions to ensure efficiency and specificity, which makes your system more robust to minor pipetting variances [51].
- Primer Design: Design sequence-specific primers, paying special attention to single-nucleotide polymorphisms (SNPs) in homologous genes. Follow general rules: primers 15-30 nt long, Tm 55–70°C (within 5°C for a pair), GC content 40–60% [50] [51].
- Annealing Temperature Gradient: Perform a thermal gradient PCR to determine the optimal annealing temperature for your primer set that provides a single, specific product.
- Primer Concentration Optimization: Test a range of primer concentrations (e.g., 0.1 – 1 μM) to find the concentration that yields the lowest Ct and highest fluorescence with minimal nonspecific amplification [50].
- cDNA Concentration Curve: Create a serial dilution of your cDNA to determine the optimal input range. A plot of log cDNA concentration vs. Ct value should be linear. The goal is to achieve a reaction efficiency (E) of 100 ± 5% and a correlation coefficient (R²) ≥ 0.99, making the 2–ΔΔCt method of analysis valid [51].
Data Presentation
Table 1: Common Pipetting Errors and Mitigation Strategies
| Error Type | Impact on RT-PCR | Mitigation Strategy |
|---|---|---|
| Volumetric Inaccuracy | Incorrect reaction component ratios, affecting amplification efficiency and Ct values [48]. | Use calibrated pipettes; pipette larger volumes; use reverse pipetting for viscous solutions [48]. |
| Cross-Contamination | False positives from sample or amplicon carryover [50]. | Use filter tips; establish unidirectional workflow; consider UDG treatment [50]. |
| Inconsistent Technique | High variability between technical replicates [48]. | Eliminate distractions; use multi-dispense and multichannel pipettes; follow a systematic plate plan [48]. |
| Wrong Annealing Temperature | Nonspecific amplification or low yield, complicating analysis [52]. | Use kits with universal annealing or perform temperature gradient optimization [52]. |
The Scientist's Toolkit
Table 2: Essential Research Reagent Solutions
| Item | Function in Minimizing Error |
|---|---|
| Calibrated Pipettes | The foundational tool for accurate and precise liquid delivery. Regular calibration is non-negotiable [48]. |
| Multichannel Pipettes | Streamlines plate setup, improves consistency across replicates, and reduces setup time and user fatigue [48]. |
| Ready-to-Use Master Mixes | Pre-mixed solutions of enzymes, dNTPs, and buffers reduce pipetting steps, decreasing the opportunity for error and contamination [52]. |
| Color-Changing Buffers | Visual indicators (e.g., dyes that change color when mixed) help track which wells have received which components, preventing omissions or double-loading [52]. |
| UDG (Uracil-DNA Glycosylase) | Enzyme used in carryover prevention systems to degrade contaminating amplicons from previous PCR runs, preventing false positives [50]. |
Accurate normalization is a prerequisite for reliable gene expression data in real-time quantitative reverse transcription PCR (qPCR). Inadequate normalization can lead to false positives, mask genuine biological changes, and ultimately compromise research validity and drug development outcomes. While the use of a single housekeeping gene for normalization was once commonplace, evidence demonstrates this approach is insufficient for high-fidelity research. Variations in housekeeping gene expression across different tissues and experimental conditions can introduce significant errors. This guide explores advanced normalization strategies, moving beyond single controls to methods incorporating multiple reference genes and data-driven algorithms, providing a framework for reducing workflow variance and enhancing data reliability.
Core Concepts: Normalization Strategies and Selection Workflow
Why Move Beyond a Single Housekeeping Gene?
The conventional use of a single internal control gene, without proper validation of its expression stability, is a major source of inaccuracy. Research shows that a single control gene can lead to relatively large errors, with one study reporting an average 75th percentile error of 3-fold, meaning that in a quarter of the samples tested, the expression difference was overestimated or underestimated threefold due to poor normalization alone [53]. Housekeeping genes can vary considerably due to:
- Cellular State Changes: Overall transcriptional activity can differ between samples.
- Experimental Treatment: The experimental conditions themselves may influence the expression of commonly used reference genes [54].
- Tissue Specificity: A gene stable in one tissue may be highly variable in another.
The following table summarizes the primary advanced normalization methods available to researchers.
Table 1: Advanced Normalization Strategies for qPCR
| Strategy | Core Principle | Key Advantage | Best Suited For |
|---|---|---|---|
| Multiple Housekeeping Genes | Normalization to the geometric mean of several carefully validated internal control genes [55] [53]. | Controls for sample-to-sample variation; wet-lab method. | Most qPCR studies, especially when sample composition is heterogeneous. |
| Data-Driven Normalization | Uses statistical properties of the entire dataset to correct for technical variation (e.g., Quantile normalization) [56]. | Does not rely on reference genes which might be regulated; robust for large-scale studies. | High-throughput qPCR experiments screening dozens to thousands of targets. |
| RNA Spike-In Controls | Addition of a known quantity of exogenous RNA to each sample during purification [57]. | Controls for variations in RNA extraction, reverse transcription, and PCR efficiency. | Samples where RNA recovery is variable (e.g., limited clinical samples). |
The following diagram outlines a logical workflow for selecting and validating an appropriate normalization strategy.
Experimental Protocols and Methodologies
Protocol: Implementing the Multiple Housekeeping Gene Strategy with GeNorm
This protocol allows for the systematic identification and validation of the most stable reference genes for a given experimental setup [55] [53].
- Select Candidate Genes: Choose a panel of 8-10 candidate housekeeping genes from different functional classes to minimize the chance of co-regulation.
- Perform qPCR: Run qPCR reactions for all candidate genes across all test samples.
- Input Data into GeNorm: Input the raw quantification cycle (Cq) values into the geNorm software (a freely available algorithm).
- Calculate Gene Stability Measure (M): geNorm calculates a stability measure (M) for each gene, which is the average pairwise variation of that gene with all others. A lower M value indicates more stable expression.
- Rank and Exclude Genes: Rank the genes from most stable (lowest M) to least stable (highest M). Exclude the gene with the highest M value.
- Recalculate and Determine the Optimal Number:
- Recalculate M values for the remaining genes.
- Repeat the exclusion process until the two most stable genes remain.
- To determine how many genes are needed, calculate the pairwise variation (V) between sequential normalization factors (NFn and NFn+1). A large variation (e.g., V > 0.15) indicates that adding the next gene improves the normalization factor significantly.
- Calculate the Normalization Factor (NF): For each sample, calculate the NF as the geometric mean of the Cq values of the top-ranked, most stable housekeeping genes.
Protocol: Data-Driven Normalization for High-Throughput qPCR
For large-scale qPCR studies (e.g., 50+ targets), data-driven methods like quantile normalization can be more robust than using pre-selected housekeeping genes [56].
- Data Collection: Obtain the raw Cq or linearized expression data for all targets across all samples.
- Data Preprocessing: Log-transform the data if necessary and handle missing values appropriately (e.g., set to a maximum Cq value).
- Apply Quantile Normalization:
- Sort the expression values for each sample independently.
- Calculate the average expression value for each rank across all samples.
- Replace each value in the original data matrix with the average value corresponding to its rank.
- Software Implementation: This method is implemented in freely available software such as the
qpcRNormpackage in R/Bioconductor, which automates the process.
Troubleshooting Guide and FAQs
Troubleshooting Common Normalization Problems
Table 2: Troubleshooting Normalization and qPCR Issues
| Problem | Possible Causes | Recommended Solutions |
|---|---|---|
| High Variation in Reference Gene Cq | 1. True biological variation of the gene.2. Poor RNA quality or integrity.3. PCR inhibitors in the sample. | - Re-evaluate gene stability using geNorm.- Check RNA integrity (RIN > 8).- Re-purify RNA to remove inhibitors (e.g., salts, phenol) [12]. |
| geNorm Recommends Too Many Genes | High heterogeneity in sample types or treatments. | - Accept the recommendation for increased accuracy. The pairwise variation (V) calculation guides the optimal number.- If impractical, consider data-driven methods [53]. |
| Low Correlation in Data-Driven Normalization | Underlying assumption that most genes are not differentially expressed is violated. | - Use a subset of known stable genes or a different normalization algorithm.- Validate with a separate method (e.g., multiple housekeeping genes) [56]. |
| Inconsistent Results After Normalization | 1. Suboptimal thermal cycler performance (well-to-well variation).2. Inaccurate pipetting. | - Verify thermal cycler block uniformity [57].- Use calibrated pipettes and master mixes to minimize technical variance. |
Frequently Asked Questions (FAQs)
Q1: What is the minimum number of housekeeping genes I should use? It is strongly recommended to start with a minimum of three carefully validated housekeeping genes. Using the geometric mean of multiple genes provides a more reliable normalization factor than any single gene [53].
Q2: Can I use 18S or 28S rRNA for normalizing qPCR data? This is generally not recommended. Total RNA (predominantly rRNA) is not always representative of the mRNA fraction. Furthermore, rRNA transcription can be affected by biological factors and drugs, and its high abundance makes accurate baseline subtraction difficult in qPCR analysis [54] [53].
Q3: How do I validate my normalization method? Validation can be done by showing that the chosen method (multiple genes or data-driven) minimizes the variation of your reference genes across sample groups. Additionally, if possible, include an RNA spike-in control to track efficiency through the entire workflow [57]. The stability measures (M in geNorm) provide a quantitative validation metric.
Q4: Are data-driven methods a complete replacement for housekeeping genes? Not always. They represent a powerful alternative, especially in situations where standard housekeeping genes are regulated by the experimental condition or in very large studies. For smaller, targeted qPCR studies, the multiple housekeeping gene approach remains a robust and widely accepted method [56].
The Scientist's Toolkit: Essential Research Reagents and Materials
Table 3: Key Reagent Solutions for Advanced qPCR Normalization
| Item | Function in Normalization | Considerations |
|---|---|---|
| Validated Housekeeping Gene Panels | Pre-selected primers/probes for genes known to be stable in specific tissues or organisms. | Saves time on initial validation; ensures primers span introns to avoid genomic DNA amplification [53]. |
| RNA Spike-In Controls | Exogenous, non-competitive RNA sequences added to the sample lysate. | Controls for technical variation from RNA isolation to PCR amplification; critical for low-input samples [57]. |
| Hot-Start DNA Polymerase | Reduces non-specific amplification and primer-dimer formation. | Improves assay specificity and efficiency, leading to more precise Cq values [12]. |
| SYBR Green Master Mix | Fluorescent dye that binds double-stranded DNA. | For monitoring amplification; ensure the mix is optimized for your cycler and has appropriate buffer additives for difficult templates (e.g., GC-rich) [12]. |
| GeNorm or BestKeeper Software | Algorithms to determine the most stable reference genes from a panel of candidates. | Essential for implementing the multiple housekeeping gene strategy; both are freely available [53]. |
Troubleshooting Common Pitfalls and Optimizing Assay Performance
How do I interpret a normal qPCR amplification curve?
A normal quantitative PCR (qPCR) amplification curve has three distinct phases that provide crucial information about your reaction's progress and efficiency [58].
- Baseline Phase: The initial cycles (typically 5-15) show little change in fluorescence as the signal accumulates below the detection level. This baseline represents the background "fluorescence noise" in your reaction [59].
- Exponential Phase: The curve shows a sharp, sigmoidal increase where fluorescence accumulates exponentially. This is the most critical phase for quantification, as the reaction efficiency is most consistent here. The quantification cycle (Cq) or threshold cycle (Ct) is determined in this phase [58].
- Plateau Phase: In later cycles, the reaction slows and eventually stops as components become depleted, leveling off the curve [58].
The threshold is set sufficiently above the baseline where a significant increase in fluorescence is detected. The Ct value is the cycle number at which the amplification curve crosses this threshold, providing a relative measure of the starting target concentration [59].
What are the most common abnormal amplification curves and how do I fix them?
Abnormal amplification curves indicate underlying issues with your qPCR reaction. The table below summarizes common patterns, their causes, and solutions.
Table 1: Common Abnormal Amplification Curves and Troubleshooting Strategies
| Observation | Potential Causes | Corrective Steps |
|---|---|---|
| Exponential amplification in No Template Control (NTC) | Contamination, primer-dimer formation | Use fresh reagents, redesign primers, improve lab practices to prevent contamination [58] |
| Jagged signal throughout amplification | Instrument optics issues, poor probe hydrolysis, air bubbles in wells | Centrifuge plates before run, ensure adequate probe concentration, check instrument function [58] |
| Plateau much lower than expected | Poor reagent quality, enzyme inhibition, probe degradation | Use fresh dNTPs, check reagent storage conditions, aliquot probes to avoid freeze-thaw cycles [58] |
| Slope of standard curve ≠ -3.34 R² < 0.98 | Pipetting errors, poor reaction efficiency, inhibitor presence | Practice precise pipetting, optimize primer design, purify template [58] |
| No amplification | Template degradation, enzyme inhibition, incorrect thermal cycling conditions | Check RNA/DNA quality, use internal controls, verify cycling parameters [6] |
| Non-specific amplification | Low annealing temperature, primer design issues, excessive Mg²⁺ concentration | Increase annealing temperature, redesign primers, optimize Mg²⁺ concentration [6] |
| Unexpected Cq values | Incorrect template quantification, reaction inhibitors, poor primer efficiency | Quantify template accurately, dilute potential inhibitors, check primer efficiency [58] |
| Technical replicates with Cq differences > 0.5 cycles | Pipetting inaccuracies, inadequate mixing, well position effects | Calibrate pipettes, mix reactions thoroughly, use identical consumables [58] |
What is a systematic approach to diagnose amplification failure?
Follow this logical workflow to systematically identify and resolve amplification problems:
Critical Validation Steps:
Template Quality Assessment: Verify template concentration using spectrophotometry (A260/A280 ratio of 1.8-2.0) or fluorometry. For RNA templates in RT-qPCR, ensure RNA Integrity Number (RIN) > 7 [6].
Reaction Component Checklist: Prepare fresh working stocks of all reagents. Use a master mix to minimize pipetting errors. Verify that essential components like Mg²⁺ or primers were not unintentionally omitted [60].
Master Mix Batch Testing: Unexpected complete amplification failure can sometimes trace to batch-specific issues with reaction mixes, even when the same product from the same manufacturer worked previously [60]. Always compare new batches against old ones using a validated assay before implementing for critical experiments.
How do I calculate and interpret PCR efficiency?
PCR efficiency determines how accurately your qPCR assay reflects the true starting template quantity. The efficiency percentage indicates the average fold-increase of amplicons per cycle.
Experimental Protocol for Efficiency Calculation:
- Prepare a serial dilution series of your template (e.g., 1:10, 1:100, 1:1000, 1:10000 dilutions) [59].
- Run qPCR for these dilution samples with at least three technical replicates per dilution.
- Record the average Ct values for each dilution.
- Plot the log(10) of the dilution factor against the average Ct values.
- Calculate the slope of the trendline.
- Apply the efficiency formula: Efficiency (%) = (10^(-1/slope) - 1) × 100 [59].
Table 2: Interpreting PCR Efficiency Values
| Efficiency Range | Interpretation | Recommended Action |
|---|---|---|
| 90-110% | Optimal | Proceed with experimental analysis |
| 85-90% or 110-115% | Acceptable with caution | Use for relative quantification with efficiency correction |
| <85% or >115% | Unacceptable | Requires thorough troubleshooting and optimization |
| >100% | Possibly inhibited reactions or assay issues | Check for inhibitors, optimize primer concentrations [59] |
Example Calculation: If your serial dilution slope is -3.62, then: Efficiency = (10^(-1/-3.62) - 1) × 100 = (10^0.276 - 1) × 100 = (1.888 - 1) × 100 = 88.8% [59]
What are essential research reagent solutions for reliable qPCR?
Table 3: Key Research Reagent Solutions for Robust qPCR Workflows
| Reagent/Component | Function | Optimization Guidelines |
|---|---|---|
| DNA Polymerase | Enzymatic amplification of DNA | Use hot-start polymerases to prevent non-specific amplification; select high-fidelity enzymes for cloning applications [18] |
| Mg²⁺ Concentration | Essential cofactor for polymerase activity | Optimize between 1.5-5.0 mM; higher concentrations increase enzyme activity but may reduce specificity [18] [61] |
| dNTPs | Building blocks for DNA synthesis | Use equal concentrations of all four dNTPs (typically 20-200μM each); avoid freeze-thaw cycles [18] |
| Primers | Target-specific sequence binding | Design primers with 40-60% GC content, length of 15-30 nt, Tm of 52-58°C; avoid 3' complementarity [18] |
| Additives (DMSO, BSA, Betaine) | Modify reaction stringency and efficiency | Use DMSO (1-10%) for GC-rich templates; BSA (400ng/μL) to counteract inhibitors [18] |
| Reverse Transcriptase (RT-qPCR) | Synthesizes cDNA from RNA | Choose enzymes with appropriate RNase H activity; optimize temperature and time [61] |
What preventive practices reduce amplification failure?
Implement these proactive strategies to minimize qPCR workflow variance:
Implementation Details:
Reagent Management: Establish automated inventory systems to track reagent usage, expiration dates, and storage conditions. Implement just-in-time ordering to prevent excessive stockpiling while ensuring critical reagents are available [20].
Contamination Control: Establish dedicated pre- and post-PCR workspaces with separate equipment. Use high-quality filtered pipette tips and regularly clean surfaces with DNA-degrading solutions. Enforce strict pipetting protocols and glove-changing practices [20].
Workflow Automation: Implement automated liquid handling systems for precise reagent dispensing. Utilize high-throughput thermal cyclers with advanced temperature control. Employ data analysis platforms that automatically flag abnormal amplification curves [20].
How do I properly design and validate a qPCR experiment?
Critical Experimental Design Considerations:
Controls: Always include:
- No Template Control (NTC) to detect contamination
- Positive control with known concentration
- Internal control to monitor inhibition
- Reference genes for normalization (RT-qPCR) [61]
Replicates: Perform at least three technical replicates for each biological sample to account for pipetting errors. Include multiple biological replicates to ensure statistical significance [61].
Threshold Setting: Set the threshold within the exponential phase of amplification where the log-linear plot shows parallel lines with a positive slope. Avoid setting thresholds in the curved region where precision worsens [62] [63].
Batch Validation: When receiving new reagent batches, compare them with old batches using multiple validated assays, as some assays may show unexpected sensitivity to batch-to-batch variations [60].
By systematically applying these interpretation techniques, troubleshooting strategies, and preventive practices, researchers can significantly reduce RT-PCR workflow variance and obtain more reliable, reproducible results in their molecular analyses.
Identifying and Eliminating PCR Inhibitors from Complex Sample Types
Polymerase Chain Reaction (PCR) and Reverse Transcription PCR (RT-PCR) are foundational techniques in molecular biology, but their accuracy is frequently compromised by inhibitors present in complex sample types. These substances, which can co-purify with nucleic acids during extraction, interfere with the enzymatic reactions, leading to reduced sensitivity, inaccurate quantification, and even complete amplification failure [64] [65]. Effective management of PCR inhibition is therefore a critical component of any strategy aimed at reducing variance in the RT-PCR workflow and ensuring the reliability of results in research and diagnostic applications.
Inhibitors originate from a wide variety of sources. Common organic inhibitors include humic acids from environmental samples, polysaccharides from plants and feces, collagen and melanin from tissues, hemoglobin from blood, and urea from urine [65] [66]. Inorganic inhibitors include calcium ions that compete with essential magnesium co-factors, and EDTA from buffer solutions that chelates magnesium [67] [66]. Other substances like phenols, detergents, and heparin can also be potent inhibitors [64] [66].
Identifying PCR Inhibition: A Troubleshooting Guide
Recognizing the signs of inhibition is the first step in troubleshooting. The table below outlines common symptoms and their interpretations, particularly in quantitative PCR (qPCR).
Table 1: Diagnostic Patterns of PCR Inhibition in qPCR
| Symptom | Possible Cause | Underlying Mechanism |
|---|---|---|
| Increase in Cq value (with normal curve shape) | Inhibition of reverse transcriptase or DNA polymerase [65] | Partial enzyme inactivation, leading to reduced amplification efficiency |
| Flattened amplification curve with increased background fluorescence | Interference with fluorescent signal [65] | Inhibitor competes with amplicon for binding to fluorescent dye (e.g., SYBR Green) |
| Complete amplification failure (no Cq value) | Severe inhibition of polymerase or fluorescent signal interference [65] | Complete enzyme inactivation or severe signal quenching |
| Smaller-than-expected Cq shift in serial dilutions | Presence of inhibitors in the template [65] | A 10-fold dilution should cause a ~3.3 cycle shift; less than this suggests inhibition |
| Inconsistent results between technical replicates | Sample heterogeneity and pipetting errors [2] | Uneven distribution of inhibitors or template, or pipette inaccuracy |
To definitively confirm the presence of inhibitors, include an Internal Positive Control (IPC) in your reactions. The IPC consists of a known quantity of synthetic nucleic acid and corresponding primers. A substantial delay in the IPC Cq value in a test sample compared to a negative control (e.g., nuclease-free water) confirms the sample contains inhibitors [65].
Strategies for Eliminating PCR Inhibitors
A multi-faceted approach is often required to overcome PCR inhibition. Strategies can be implemented at the sample preparation, reaction setup, and data analysis stages.
Sample Preparation and Purification
The goal at this stage is to remove inhibitors before the PCR reaction begins.
- Dilution of Template: A simple and effective strategy is to dilute the extracted nucleic acid. This dilutes the inhibitors along with the template, potentially restoring amplification. A 10-fold dilution is commonly used, but the optimal factor depends on the inhibitor concentration and type [64]. The major drawback is a concurrent reduction in target template concentration, which can lead to underestimation of viral load or gene copy number, especially for low-abundance targets [64].
- Advanced Purification Techniques:
- Silica Membranes: Silica-based DNA purification kits are highly effective at removing a wide range of inhibitors. One study on clinical samples reduced the overall inhibition rate from 12.5% to 1.1% by adding a silica membrane purification step [68].
- Polymeric Adsorbents: Adsorbents like Supelite DAX-8 can permanently remove humic acids from environmental water samples. One study found that applying 5% DAX-8 led to a significant increase in viral RNA detection by qPCR compared to other methods [67]. Note: It is crucial to test for potential adsorption of the target nucleic acid to the polymer.
Reaction Setup Modifications
These methods aim to neutralize or tolerate inhibitors within the PCR reaction itself.
- Use of Inhibitor-Tolerant Enzymes: Selecting polymerases and reverse transcriptases known for high resistance to inhibitors is a direct and efficient strategy. These enzymes are often engineered for this purpose and can be particularly effective with challenging sample types like wastewater or blood [64] [5].
- PCR Enhancers and Additives: Adding specific compounds to the reaction mix can counteract inhibitors. The following table summarizes common enhancers, their mechanisms, and effective concentrations based on recent studies.
Table 2: PCR Enhancers and Their Applications
| Enhancer | Mechanism of Action | Reported Effective Concentration | Notes and Considerations |
|---|---|---|---|
| Bovine Serum Albumin (BSA) | Binds to and neutralizes inhibitors like humic acids and polyphenols [64] [67] | 0.1 - 1.0 μg/μL [64] | A widely used, cost-effective general-purpose enhancer. |
| T4 Gene 32 Protein (gp32) | Binds to single-stranded nucleic acids, preventing denaturation and inhibitor binding [64] | 0.1 - 0.5 nM [64] | Especially useful for samples rich in humic substances. |
| Dimethyl Sulfoxide (DMSO) | Destabilizes DNA secondary structure, lowers melting temperature [64] | 2 - 5% [64] | Helpful for templates with high GC content. Can be inhibitory at high concentrations. |
| Tween-20 | A detergent that counteracts inhibitory effects on Taq DNA polymerase [64] | 0.1 - 0.5% [64] | Effective for fecal samples. |
| Dithiothreitol (DTT) | A reducing agent that can help counteract certain inhibitors [67] | 10 mM [67] | Often used in combination with other agents. |
| Glycerol | Stabilizes enzymes, protecting them from degradation [64] | 5 - 10% [64] | Improves enzyme stability and reaction efficiency. |
Alternative Detection Technologies
- Digital PCR (dPCR): dPCR has been shown to be more tolerant of inhibitors than qPCR. This is because the partitioning step effectively dilutes inhibitors into thousands of individual reactions, and the endpoint detection method is less affected by factors that impair amplification efficiency [64] [2]. However, severe inhibition can still lead to misclassification of partitions and inaccurate quantification [2].
Experimental Protocols for Inhibitor Removal
This protocol is designed for concentrated environmental water samples.
- Materials: Supelite DAX-8 resin, concentrated water sample, centrifuge.
- Procedure: a. After the sample re-concentration step (e.g., via PEG precipitation), add 5% (w/v) DAX-8 resin to the concentrate. b. Mix thoroughly for 15 minutes at room temperature to allow the inhibitors to adsorb to the resin. c. Centrifuge the mixture at 8000 rpm for 5 minutes at 4°C to pellet the insoluble DAX-8 resin. d. Carefully transfer the supernatant (now treated sample) to a fresh tube. e. Proceed with nucleic acid extraction using your preferred kit (e.g., QIAamp DNA Mini kit).
- Validation: To test for potential loss of virus/NNA during treatment, spike a known quantity of a control virus (e.g., Murine Norovirus) into inhibitor-free water and process it with and without DAX-8 treatment. Compare the recovery rates by qPCR.
This protocol evaluates different enhancers directly in the PCR mix.
- Materials: Extracted nucleic acids (potentially inhibited), PCR master mix, primers/probes, enhancers (BSA, gp32, DMSO, etc.).
- Procedure: a. Prepare separate PCR master mixes, each containing one enhancer at the desired concentration (see Table 2 for ranges). b. Include a negative control (no enhancer) and a positive control (inhibitor-free template). c. Run the RT-qPCR using standard cycling conditions. d. Compare the Cq values and amplification curve morphology across the different reactions. The most effective enhancer will show the lowest Cq and most robust curve shape for the inhibited sample, without affecting the positive control.
- Note: A study on wastewater found that BSA and gp32 were among the most effective enhancers for recovering viral targets, outperforming other additives like DMSO and formamide [64].
The Scientist's Toolkit: Research Reagent Solutions
Table 3: Essential Reagents for Managing PCR Inhibition
| Reagent / Kit | Function | Example Application |
|---|---|---|
| Inhibitor-Tolerant Polymerase | Engineered enzyme resistant to salts, organics, and other common inhibitors [64] [66] | Amplification from direct crude lysates (e.g., blood, soil). |
| Silica Membrane Purification Kit | Binds nucleic acids, allowing wash steps to remove impurities and inhibitors [68] | General-purpose purification of DNA from complex samples (e.g., tissues, sputum). |
| DAX-8 Resin | Polymeric adsorbent that removes humic and fulvic acids [67] | Pre-treatment of environmental water and soil extracts. |
| Bovine Serum Albumin (BSA) | Protein that binds a wide array of inhibitors, neutralizing their effect [64] [67] | Low-cost additive to PCR reactions for samples like wastewater and plants. |
| RNase Inhibitor | Protects RNA from degradation by RNases during cDNA synthesis [5] [67] | Essential for RT-PCR from samples with high RNase activity (e.g., pancreas, leukocytes). |
| Internal Positive Control (IPC) | Distinguishes between true target absence and PCR failure due to inhibition [65] | Mandatory for diagnostic assays and critical quantification studies. |
FAQs on PCR Inhibition
Q1: My negative control is clean, but my sample shows no amplification. Is this always caused by inhibitors? A: Not necessarily. While severe inhibition is a prime suspect, other issues can cause this, including: degraded template nucleic acid, erroneous primer design, suboptimal PCR conditions (e.g., annealing temperature too high), or a failed reaction component. Use an IPC to confirm inhibition. If the IPC also fails to amplify, inhibition is likely. If the IPC amplifies normally, the problem may lie with your target-specific primers or the template itself [65] [66].
Q2: I am working with formalin-fixed, paraffin-embedded (FFPE) tissue. What are my main inhibition challenges? A: FFPE tissues are challenging due to the presence of formalin-induced cross-links that fragment nucleic acids and make them poor templates, and residual paraffin. Optimized commercial kits for FFPE nucleic acid extraction that include extensive deparaffinization and cross-link reversal steps are recommended. Using a robust, inhibitor-tolerant polymerase and including BSA in the reaction can also improve results [69].
Q3: How does digital PCR (dPCR) help with inhibition, and when is it the best choice? A: dPCR partitions a sample into thousands of nanoreactions. This effectively dilutes inhibitors, meaning many partitions will contain template but no inhibitor, allowing amplification to proceed. It is particularly advantageous for absolute quantification of low-abundance targets in inhibited samples where qPCR results are unreliable [64] [2]. However, it is not immune to very high levels of inhibition, which can still cause false negatives by preventing amplification in affected partitions [2].
Q4: What are the best practices to avoid introducing inhibitors during sample preparation? A: Follow these guidelines:
- Do not overload your extraction protocol with too much starting material.
- Ensure complete lysis of the sample.
- Perform all wash steps thoroughly to remove contaminants.
- Elute in the recommended buffer or nuclease-free water, not in EDTA-containing buffers if magnesium is critical [5] [66].
- For plant tissues, use extraction protocols specifically designed to remove polyphenols and polysaccharides.
Workflow Diagram for Troubleshooting PCR Inhibition
The following diagram provides a logical, step-by-step guide to diagnosing and addressing PCR inhibition.
Optimizing Primer and Probe Concentrations for Maximum Signal-to-Noise Ratio
In the context of RT-PCR workflow variance reduction, achieving an optimal signal-to-noise ratio is paramount for assay reliability and reproducibility. Proper primer and probe concentration optimization directly influences key performance metrics, including amplification efficiency, specificity, and the threshold cycle (Cq) value, while minimizing background fluorescence and non-specific amplification. This guide provides detailed strategies and troubleshooting protocols to assist researchers in systematically optimizing these critical parameters for robust experimental outcomes.
Core Principles of Concentration Optimization
Understanding the Components
The relationship between primer and probe concentrations significantly impacts the signal-to-noise dynamics in RT-qPCR assays. Primers are short, single-stranded DNA sequences that initiate amplification by binding complementary template sequences. Hydrolysis probes are oligonucleotides with a reporter fluorophore and quencher that generate fluorescent signal upon cleavage during amplification. The signal-to-noise ratio refers to the magnitude of specific amplification signal relative to non-specific background fluorescence, which is crucial for detecting true positive amplification, especially in samples with low target abundance [70].
Optimal Concentration Ranges
Extensive empirical studies have established optimal concentration ranges for primers and probes that provide maximum signal-to-noise ratio while maintaining amplification efficiency between 90-110% [71].
Table 1: Recommended Concentration Ranges for RT-qPCR Components
| Component | Recommended Concentration | Function | Impact on Signal-to-Noise Ratio |
|---|---|---|---|
| Primers | 100-900 nM (400 nM optimal) | Initiate template amplification | Excessive concentrations increase non-specific binding and background noise |
| Hydrolysis Probes | 100-500 nM (200 nM optimal) | Generate fluorescent signal upon cleavage | Insufficient probe reduces signal intensity; excess probe increases background fluorescence |
| Template RNA | 100 ng-10 pg total RNA | Provides target for amplification | Excessive template can inhibit reaction; insufficient template reduces sensitivity |
Experimental Optimization Protocols
Systematic Optimization Using Design of Experiments (DOE)
A statistical Design of Experiments (DOE) approach efficiently optimizes multiple parameters simultaneously, reducing experimental burden compared to traditional one-factor-at-a-time methods [72].
Protocol 1: Primer and Probe Titration Matrix
- Prepare master mix containing all reaction components except primers and probe
- Create a two-dimensional titration matrix with primer concentrations (100, 200, 400, 600, 900 nM) against probe concentrations (100, 200, 300, 400, 500 nM)
- Perform RT-qPCR amplification using standardized cycling conditions
- Analyze results based on the following criteria:
- Lowest Cq value with highest fluorescence intensity
- Amplification efficiency between 90-110%
- Minimal background fluorescence in no-template controls
- Select optimal combination that delivers the best signal-to-noise characteristics
Multiplex Assay Optimization
For multiplex RT-qPCR assays detecting multiple targets, additional optimization is required to prevent interference between primer-probe sets [70].
Protocol 2: Multiplex Assay Balancing
- Initially test each primer-probe set individually to establish baseline performance
- Systematically combine primer-probe sets while adjusting concentrations to balance Cq values
- Assign brighter fluorophores to lower abundance targets and dimmer fluorophores to higher abundance targets
- Verify minimal spectral overlap between different fluorophore emission spectra
- Validate assay performance with known control samples
Table 2: Performance Metrics for Optimal vs. Suboptimal Concentrations
| Performance Metric | Optimal Concentrations | Excessive Primers | Insufficient Probe |
|---|---|---|---|
| Cq Value | Low (early amplification) | Unaffected or slightly lower | High (delayed amplification) |
| Signal Intensity | High specific fluorescence | High with increased background | Low specific fluorescence |
| Background Noise | Minimal | Significantly increased | Minimal |
| Amplification Efficiency | 90-110% | Often reduced | Often reduced |
| Specificity | High | Reduced due to non-specific priming | High |
Troubleshooting Guide: Common Optimization Issues
FAQ: Frequently Encountered Problems and Solutions
Q1: What are the indicators of suboptimal primer or probe concentrations in my RT-qPCR assay?
- High background fluorescence in no-template controls indicates excessive probe concentration [71]
- Delayed Cq values (above 37 cycles) with low signal suggests insufficient primer or probe concentration [70]
- Reduced amplification efficiency (outside 90-110% range) indicates improper reagent balancing [71]
- Multiple amplification curves or non-specific products suggest excessive primer concentration [73]
Q2: How can I improve signal-to-noise ratio for low-abundance targets?
- Increase primer concentration up to 900 nM while monitoring for non-specific amplification [71]
- Extend amplification cycles to 45 for very low input samples [71]
- Utilize bright fluorophores matched to low abundance targets in multiplex assays [70]
- Verify probe design ensures Tm is 5-10°C higher than primers for optimal hybridization [71]
Q3: What specific strategies help reduce variance in RT-PCR workflows?
- Implement statistical DOE approaches to efficiently optimize multiple parameters simultaneously, significantly reducing experimental iterations [72]
- Prepare fresh template dilutions for each experiment to maintain consistency [71]
- Run reactions in triplicate to account for technical variability [70]
- Include appropriate controls (no-template, no-RT) in every run to identify contamination sources [73]
Q4: How do I balance different primer-probe sets in multiplex assays?
- Test individual primer-probe sets first to establish baseline Cq values [70]
- Adjust concentrations of high-abundance target primers downward while maintaining low-abundance target primers at higher concentrations [71]
- Select fluorophores with minimal spectral overlap to reduce signal bleed-through [70]
- Verify each target amplifies with similar efficiency to prevent competitive inhibition [70]
The Scientist's Toolkit: Essential Research Reagents
Table 3: Key Reagent Solutions for RT-PCR Optimization
| Reagent/Category | Specific Examples | Function in Optimization |
|---|---|---|
| One-Step RT-qPCR Kits | Luna Universal One-Step RT-qPCR Kit | Provides unified buffer system for combined reverse transcription and amplification |
| High-Fidelity DNA Polymerases | Q5 High-Fidelity DNA Polymerase | Reduces misincorporation errors in amplification [73] |
| Hot-Start Enzymes | OneTaq Hot Start DNA Polymerase | Minimizes non-specific amplification during reaction setup [73] |
| PCR Additives | GC Enhancer, DMSO, BSA | Improve amplification efficiency through difficult templates and secondary structures [74] |
| Nucleic Acid Cleanup | Monarch PCR & DNA Cleanup Kit | Removes contaminants that inhibit amplification [73] |
| UDG Treatment | Antarctic Thermolabile UDG | Prevents carryover contamination between experiments [71] |
Advanced Optimization Techniques
Probe Design Considerations for Enhanced Performance
Advanced probe optimization extends beyond concentration adjustments to fundamental design parameters [72]:
- Probe length should be 15-30 nucleotides to ensure sufficient fluorophore quenching [71]
- Probe Tm should be 5-10°C higher than primer Tm to ensure target saturation prior to amplification [71]
- Dimer stability between mediator probes and universal reporters significantly impacts PCR efficiency [72]
- Avoid 5' guanine bases adjacent to fluorophores as they can quench reporter signals [71]
Variance Reduction Through Systematic Approaches
Implementing statistical DOE methodologies can reduce optimization experiments by up to 44% compared to traditional one-factor-at-a-time approaches while providing comprehensive interaction data between parameters [72]. This systematic reduction in experimental variance ensures more reproducible and reliable RT-PCR workflows, particularly crucial for diagnostic applications and drug development research where result consistency is paramount.
Q: Why is contamination a particularly critical issue in RT-PCR, and what are the main strategies to address it?
The exquisite sensitivity of RT-PCR, which allows for the detection of low-abundance RNA targets, also makes it exceptionally vulnerable to contamination from even trace amounts of foreign nucleic acids [75]. This can lead to false-positive results, data misinterpretation, and compromised research outcomes, especially in high-stakes applications like clinical diagnostics and drug development [76] [75]. Two foundational strategies for mitigating this risk are the implementation of physical controls, primarily through dedicated work areas, and the use of chemical/enzymatic controls, most effectively implemented with Uracil-N-Glycosylase (UNG) [77] [78].
The following table summarizes the primary sources of contamination and the core functions of the two main strategies discussed in this guide.
| Contamination Source | Description | Primary Mitigation Strategy |
|---|---|---|
| Amplicon Carryover | Aerosols from PCR products from previous runs; most potent source [75] [78]. | UNG protocol [77] |
| Cross-Contamination | Transfer of DNA between samples during handling [75]. | Dedicated work areas & good pipetting practice [78] |
| Environmental DNA | DNA from skin cells, bacteria, or fungi in the lab environment [78]. | Dedicated work areas & surface decontamination [75] |
| Contaminated Reagents | Reagents or consumables that harbor nucleic acids [78]. | Reagent aliquoting & use of clean materials [78] |
Implementing the UNG (UDG) Carryover Prevention Protocol
Q: What is the precise mechanism by which UNG prevents carryover contamination, and what is the standard experimental protocol?
A: Uracil-N-Glycosylase (UNG) is an enzyme that excises uracil bases from DNA by cleaving the N-glycosidic bond, but it has no effect on natural thymine-containing DNA [77]. The strategy involves making past PCR products vulnerable to UNG, while protecting the new reaction.
- Mechanism: In the first-round PCR, dTTP is partially or fully replaced with dUTP. All subsequent amplification products (amplicons) will then contain uracil instead of thymine [77]. Before a new PCR is run, the reaction mixture is treated with UNG. The enzyme recognizes and removes uracil bases from any contaminating uracil-containing amplicons, creating apyrimidinic (AP) sites in the DNA backbone [77]. These AP sites block DNA polymerases during the subsequent PCR amplification, preventing the replication of the contaminating DNA. The UNG enzyme is then thermally inactivated during the initial denaturation step of the new PCR cycle, protecting the new, uracil-free amplicons that are synthesized with dTTP [77].
Standard Experimental Protocol for UNG Use:
- Reaction Assembly: Prepare the PCR master mix on ice. Include all standard components, substituting dTTP entirely with dUTP, or using a dUTP/dTTP mixture as validated for your assay [77].
- UNG Addition: Add Uracil-N-Glycosylase (typically 0.2 - 1 unit per 50 µL reaction) to the master mix.
- Incubation: Incubate the assembled reaction at 25°C - 37°C for 5 - 10 minutes. This allows UNG to actively degrade any uracil-containing contaminating DNA.
- Enzyme Inactivation & Amplification: Transfer the reaction tubes to the thermal cycler and start the program. The initial denaturation step (e.g., 95°C for 2-5 minutes) will permanently inactivate UNG. The proceeding PCR cycles will then amplify only the intended, natural template.
Establishing Dedicated Work Areas for Spatial Separation
Q: What is the optimal laboratory design for preventing contamination through spatial separation, and what specific practices should be enforced in each area?
A: The most effective physical control is the strict spatial separation of pre- and post-PCR activities [78]. This eliminates the flow of amplified DNA back into areas where new reactions are set up.
Workflow for Spatial Separation:
Enforced Practices by Area:
| Work Area | Primary Function | Key Practices & Equipment |
|---|---|---|
| Reagent Preparation Area | Preparation of PCR master mixes, aliquoting of reagents [78]. | Dedicated pipettes, aerosol-resistant filter tips, UV-equipped PCR hood, fresh gloves [75] [78]. |
| Sample Preparation Area | Addition of DNA/RNA template to the master mix [78]. | Dedicated pipettes, filter tips, separate from reagent stock area. |
| Post-PCR Area | Thermal cycling, gel electrophoresis, and analysis of amplified products [78]. | Never bring anything from this area (including gloves, tubes, or equipment) back into pre-PCR areas. |
Integrated Contamination Troubleshooting Guide
Q: What systematic steps should be taken when contamination is suspected in a PCR experiment?
A: A systematic approach is essential for efficient troubleshooting. The following action plan should be initiated when a No-Template Control (NTC) shows amplification.
| Step | Action | Objective & Details |
|---|---|---|
| 1. Confirm | Re-run the NTC. | Rule out a one-off pipetting error or mishap. A consistently positive NTC confirms a persistent contamination problem [78]. |
| 2. Isolate | Set up a series of reactions, each omitting one master mix component (water, primers, buffer, dNTPs, polymerase) or substituting it with a fresh, new aliquot [78]. | Identify the specific contaminated reagent. Replace the component that, when omitted or swapped, results in a clean NTC. |
| 3. Escalate | If the source is not identified, implement broad decontamination. Discard all suspect reagents and aliquots. Decontaminate surfaces and equipment with 10% bleach or DNA-degrading solutions [75]. UV-irradiate workstations [75]. | A "nuclear option" to eliminate pervasive, low-level contamination from the workspace and stocks. |
| 4. Validate | After cleanup, prepare fresh aliquots from stock solutions and run a new NTC. | Confirm that the decontamination efforts were successful before proceeding with valuable samples. |
Research Reagent Solutions for Contamination Control
The following toolkit is essential for implementing robust contamination control protocols.
| Item | Function in Contamination Control |
|---|---|
| Uracil-N-Glycosylase (UNG) | Enzymatically digests uracil-containing DNA from previous amplifications to prevent carryover contamination [77]. |
| dUTP | Substituted for dTTP in PCR to incorporate uracil into amplicons, making them susceptible to UNG digestion [77]. |
| Aerosol-Resistant Filter Tips | Create a barrier within the pipette tip to prevent aerosol transfer from samples and reagents, a major source of cross-contamination [75]. |
| PCR-Grade Water | Nuclease-free and DNA-free, ensuring no exogenous nucleic acids are introduced via the reaction solvent [78]. |
| 10% Bleach Solution | Effective chemical decontaminant for destroying DNA on benchtops, pipettes, and equipment [75]. |
| ULPA/HEPA Filtered Hood | Provides a clean, particle-free air environment for setting up pre-PCR reactions, protecting both the sample and the reagents [79]. |
Frequently Asked Questions (FAQs)
Q: Can the UNG method be used if my target DNA is ancient or potentially contains uracil from damage? A: Caution is advised. The UNG method is designed to cleave uracil, and if your genuine DNA template has undergone cytosine deamination (a common form of damage in ancient DNA), UNG treatment will destroy the authentic target. In such fields, UNG is sometimes used diagnostically to distinguish between intact ancient DNA and modern contaminants, but it should not be used as a routine carryover prevention method [77].
Q: My lab lacks separate rooms. Can I still implement spatial separation? A: Yes. While separate rooms are ideal, the principle can be applied within a single lab. Designate specific benches or cabinet spaces as "pre-PCR" and "post-PCR." The key is maintaining strict uni-directional workflow and using dedicated equipment (pipettes, centrifuges, etc.) for each zone. A Class II Biological Safety Cabinet, especially one that is UV-equipped, can serve as an excellent dedicated pre-PCR station [79].
Q: Besides UNG and spatial separation, what is the single most important practice to prevent contamination? A: Meticulous pipetting technique is paramount. Always use aerosol-resistant filter tips, avoid touching the inside of tube lids or rims, open tubes gently to minimize aerosol formation, and change gloves frequently, especially after handling amplified products or moving between work zones [75] [78].
Validating Assay Specificity with Melt Curve Analysis and Gel Electrophoresis
In reverse transcription polymerase chain reaction (RT-PCR) workflows, ensuring the specificity of your amplification reaction is paramount for generating reliable and reproducible data. False positive results or overestimation of target concentration can occur due to amplification of non-specific products, such as primer-dimers or off-target amplicons. This is particularly critical in SYBR Green-based assays, where the dye binds to any double-stranded DNA (dsDNA) present in the reaction [80]. To combat this, two fundamental and complementary techniques are employed: melt curve analysis and gel electrophoresis. Within the context of reducing variance in RT-PCR workflows, consistent application of these validation methods is not just a best practice—it is a essential strategy for identifying and eliminating a major source of experimental variability, thereby ensuring data integrity for researchers and drug development professionals.
Core Principles: Melt Curve and Gel Electrophoresis
Melt Curve Analysis
Melt curve analysis is a powerful quality control step performed at the end of a SYBR Green qPCR run to assess the purity of the amplified PCR product [80].
- How It Works: After amplification is complete, the thermal cycler gradually increases the temperature, causing the dsDNA amplicons to denature, or "melt," into single strands. SYBR Green dye is released during this process, resulting in a decrease in fluorescence. The instrument plots this change in fluorescence as a function of temperature [81] [80].
- The Derivative Plot: The raw data is often presented as a derivative melt curve, which plots the negative derivative of fluorescence relative to temperature (-dF/dT) against temperature. This converts the gradual melt curve into distinct peaks, where each peak represents a specific PCR product and its peak position corresponds to the melting temperature (Tm) [80]. The Tm is the temperature at which 50% of the DNA is denatured and is primarily determined by the amplicon's length, GC content, and nucleotide sequence [82].
Gel Electrophoresis
Agarose gel electrophoresis is a classical molecular biology technique that separates DNA fragments based on their size.
- How It Works: A portion of the PCR product is loaded onto a porous agarose gel and an electric current is applied. Negatively charged DNA migrates through the gel towards the positive electrode, with smaller fragments moving faster and farther than larger ones. The DNA is then visualized using a stain like ethidium bromide, appearing as distinct bands under UV light [81] [83].
- The Gold Standard: The presence of a single, sharp band at the expected molecular weight is considered the gold standard for confirming that a single, specific amplicon has been generated [81] [80]. A smear or multiple bands indicate non-specific amplification or the presence of primer-dimers.
A Practical Workflow for Combined Specificity Validation
The most robust approach to validating assay specificity involves the sequential use of melt curve analysis and gel electrophoresis. The following workflow diagram illustrates this integrated process:
Troubleshooting Guide: Interpreting Abnormal Melt Curves
Abnormal melt curves are a common indicator of assay problems. The table below summarizes frequent issues, their potential causes, and recommended solutions.
Table 1: Troubleshooting Abnormal Melt Curves and Gel Electrophoresis Results
| Observation | Potential Cause(s) | Recommended Solution(s) |
|---|---|---|
| Single peak, but broad or not sharp [82] | Reagent composition; less sensitive instrument; minor non-specific products. | Ensure temperature span ≤ 7°C. If usable, run gel to confirm single band [82]. |
| Double peaks: Minor peak < 80°C [82] | Primer-dimer formation. | Redesign primers; lower primer concentration; increase annealing temperature [82] [80]. |
| Double peaks: Minor peak > 80°C [82] | Non-specific amplification. | Increase annealing temperature; remove genomic DNA contamination; redesign primers for higher specificity [82]. |
| Irregular or noisy peaks [82] | Contaminated template; uncalibrated instrument; incompatible consumables. | Check template quality; perform instrument maintenance; use compatible consumables [82]. |
| Multiple peaks from a single amplicon [81] | Complex, multi-state DNA melting (e.g., in GC-rich regions). | Use prediction software (e.g., uMelt); confirm single product via gel electrophoresis [81]. |
| Smear or multiple bands on gel [83] | Non-specific amplification; primer-dimer formation. | Optimize annealing temperature using a gradient; verify primer specificity; adjust Mg2+ concentration [83]. |
Frequently Asked Questions (FAQs)
Q1: If my melt curve shows a single, sharp peak, do I still need to run a gel? While a single peak strongly suggests a single amplification product, it does not conclusively prove it. Different DNA products with identical or very similar Tm values can coalesce into a single peak [81]. For a new assay, always confirm the results with gel electrophoresis to ensure the peak represents a single band of the correct size [80]. Once an assay is fully validated, the melt curve alone may suffice for routine runs.
Q2: My primers used to give a single peak, but now show a double peak with a new reagent batch. Why? The melting temperature (Tm) of an amplicon can be influenced by the buffer environment, including ionic strength and pH [82]. Differences in the composition or concentration of components between reagent batches can cause slight shifts in Tm or even reveal underlying primer design issues that were previously masked [82]. Re-optimization of annealing temperature or primer concentration may be necessary.
Q3: What does a "shoulder" on the main melt peak indicate? A shoulder on the main peak typically suggests the presence of a secondary product with a very similar, but not identical, Tm. This is a form of non-specific amplification and should be addressed by optimizing reaction conditions or redesigning primers for greater specificity [80].
Q4: How can I predict if my amplicon will produce a complex melt curve? Tools like the free online uMelt software can predict the melt curve behavior of your amplicon based on its sequence [81]. This is especially useful during the assay design phase to anticipate and avoid amplicons with inherent complex melting behavior due to factors like high GC content or secondary structures.
Table 2: Key Research Reagent Solutions for Assay Validation
| Item | Function in Validation |
|---|---|
| SYBR Green qPCR Master Mix | A premixed solution containing DNA polymerase, dNTPs, buffer, and the SYBR Green dye. Simplifies reaction setup and reduces pipetting variability [82] [84]. |
| Agarose | A polysaccharide used to create gels for electrophoresis. Standard agarose is sufficient for resolving most PCR amplicons. |
| DNA Ladder | A mixture of DNA fragments of known sizes. Essential for determining the precise size of your amplicon band on the gel. |
| uMelt Software | A free, web-based tool that predicts the theoretical melt curve of an input amplicon sequence, helping to distinguish between specific and non-specific products during troubleshooting [81]. |
| DNase I (RNase-free) | An enzyme used to degrade contaminating genomic DNA in RNA samples prior to cDNA synthesis, preventing false positives in RT-PCR [85]. |
Validated Experimental Protocol: A Case Study
A 2022 study developed a cost-effective one-step multiplex RT-PCR assay for SARS-CoV-2 detection using SYBR Green and melt curve analysis, providing an excellent example of a rigorous validation workflow [84].
- Primer Design: Primers were meticulously designed for the N, E, RdRp, and S genes of SARS-CoV-2, as well as for the human β-actin gene as an internal control. Specificity was verified in silico using Primer-BLAST.
- Singleplex Assay Optimization: Each primer set was first optimized individually using singleplex RT-PCR. The resulting amplicons were analyzed by melt curve analysis and gel electrophoresis to confirm each produced a single, distinct Tm peak and a single band of the expected size.
- Multiplex Assay Development: Optimized primer sets were combined into multiplex reactions (duplex, triplex). The melt curve was critically analyzed to ensure each target produced a distinct and reproducible Tm peak (e.g., N gene: ~82.3°C, E gene: ~79.4°C, β-actin: ~85.8°C). This allowed for the specific detection of multiple targets in a single tube.
- Validation vs. Gold Standard: The final multiplex assay (targeting N, E, and β-actin) was validated against a commercial TaqMan probe-based kit (Sansure) using 180 clinical samples. The SYBR Green melt curve assay demonstrated 97% specificity and 93% sensitivity, confirming its reliability [84].
This protocol underscores that successful assay development relies on a foundation of careful, stepwise validation using both melt curve analysis and gel electrophoresis.
Establishing Assay Validation Frameworks and Comparative Analyses
Frequently Asked Questions (FAQs)
What is the fundamental difference between LOD and LOQ? The Limit of Detection (LOD) is the lowest concentration of an analyte that can be reliably distinguished from a blank sample (containing no analyte), but it cannot be quantified with precision. In contrast, the Limit of Quantitation (LOQ) is the lowest concentration that can be measured with acceptable precision and accuracy, defined by pre-set goals for bias and imprecision [86].
Why is the dynamic range important for my assay? The dynamic range defines the span of concentrations, from the LOQ to the upper limit of quantification, over which your assay provides reliable quantitative results. An assay's dynamic range must encompass the entire range of clinically or biologically relevant concentrations for the analyte to be useful for diagnosis or research. A range that is too narrow can lead to unreportable results for samples with high or low concentrations [87].
How do I determine the LOD and LOQ for my RT-PCR assay? Two common approaches are the signal-to-noise ratio and the calibration curve method. The signal-to-noise method defines LOD and LOQ as concentrations that yield signals 3.3 and 10 times greater than the background noise, respectively [88]. The calibration curve method uses the standard deviation of the response and the slope of the curve: LOD = 3.3σ/S and LOQ = 10σ/S, where σ is the standard deviation and S is the slope [88].
My RT-PCR assay has high variability at low concentrations. What can I optimize? High variability often stems from suboptimal pre-PCR steps. Key areas to optimize include:
- Primer Design: Design primers based on single-nucleotide polymorphisms (SNPs) to ensure specificity, especially for homologous genes. Avoid using primer design tools without manual verification [13].
- cDNA Synthesis: This step is a major source of variance. Use high-quality reverse transcriptase and ensure accurate RNA quantification [89].
- Reaction Components Systematically optimize primer concentrations, annealing temperatures, and cDNA input concentration to achieve a reaction efficiency between 95-105% [13].
Troubleshooting Guides
Problem: Inconsistent LOD/LOQ values during validation.
- Potential Cause 1: High imprecision in replicate measurements of low-concentration samples or blank samples.
- Solutions:
- Potential Cause 2: The provisional LOD or LOQ concentration is too close to the actual limit of the assay.
- Solutions:
- Empirically test samples at concentrations slightly above your calculated LOD/LOQ.
- For the LOD, ensure no more than 5% of results from a sample at the LOD fall below the Limit of Blank (LoB) [86].
- For the LOQ, the results must meet your pre-defined precision (e.g., %CV) and accuracy (bias) goals [86].
Problem: Dynamic range is too narrow.
- Potential Cause 1: Assay sensitivity is insufficient for the low end, or signal saturation occurs too early at the high end.
- Solutions:
- For the low end: Improve sample preparation to reduce inhibitors. Optimize primer sequences and reaction conditions to enhance amplification efficiency [13].
- For the high end: For digital PCR, ensure an appropriate dilution factor is used to avoid saturation of positive partitions [90]. For RT-PCR, ensure the sample is diluted to fall within the linear range of the standard curve [7].
Experimental Protocols and Data Presentation
Protocol 1: Determining LOD and LOQ using the Calibration Curve Method [88] This method is widely accepted and supported by regulatory guidelines like ICH Q2(R1).
- Prepare a Calibration Curve: Run a standard curve with at least 5 concentrations covering the expected low range of your assay.
- Perform Linear Regression: Analyze the data using linear regression. From the output, obtain the slope (S) and the standard error (σ) of the regression.
- Calculate LOD and LOQ: Use the formulas:
- LOD = 3.3 × σ / S
- LOQ = 10 × σ / S
- Experimental Validation: The calculated values are estimates. You must validate them by preparing and analyzing multiple replicates (e.g., n=6) at the LOD and LOQ concentrations. The LOD samples should be reliably detected, and the LOQ samples should meet your precision and accuracy criteria.
Protocol 2: Establishing Limits per CLSI EP17 Guidelines [86] This protocol is rigorous and specifically designed for clinical laboratory methods.
- Determine the Limit of Blank (LoB):
- Measure a minimum of 20 replicates of a blank sample (contains no analyte).
- Calculate the mean and standard deviation (SD~blank~).
- LoB = mean~blank~ + 1.645 × SD~blank~ (assuming a 5% false-positive rate).
- Determine the Limit of Detection (LoD):
- Measure a minimum of 20 replicates of a low-concentration sample.
- Calculate the mean and standard deviation (SD~low~).
- LoD = LoB + 1.645 × SD~low~ (assuming a 5% false-negative rate).
- Determine the Limit of Quantitation (LoQ):
- Test samples at various low concentrations, including at or above the LoD.
- The LoQ is the lowest concentration at which the assay meets predefined performance goals for total error (i.e., both bias and imprecision). It is therefore always ≥ LoD.
The table below summarizes the two primary calculation methods.
Table 1: Methods for Calculating LOD and LOQ
| Method | Key Formula(s) | Data Required | Advantages |
|---|---|---|---|
| Calibration Curve [88] | LOD = 3.3σ/SLOQ = 10σ/S | Slope (S) and standard error (σ) from a linear regression analysis. | Simple, uses standard validation data; supported by ICH guidelines. |
| CLSI EP17 [86] | LoB = mean~blank~ + 1.645(SD~blank~)LoD = LoB + 1.645(SD~low~) | Replicates of a blank sample and a low-concentration sample. | Statistically robust; clearly separates blank and low-concentration sample analysis. |
The following diagram illustrates the statistical relationship and workflow for establishing LoB, LoD, and LoQ according to the CLSI EP17 guideline.
The Scientist's Toolkit: Key Research Reagent Solutions
Table 2: Essential Materials for RT-PCR Optimization and Validation
| Item | Function in Validation | Key Considerations |
|---|---|---|
| High-Quality Primers [13] | Ensure specific amplification of the target. Critical for achieving high sensitivity and a broad dynamic range. | Design based on SNPs to distinguish homologous genes. Verify specificity and optimize concentration. |
| Standard/Calibrator Material [7] [88] | Used to construct the calibration curve for determining the slope (S) for LOD/LOQ calculations and for defining the quantitative range. | Purified plasmid DNA, in vitro transcribed RNA, or cDNA with known concentration. Must be accurately quantitated. |
| Nuclease-Free Water | Serves as the blank sample for establishing the Limit of Blank (LoB) and as a no-template control (NTC). | Confirms the absence of background signal or contamination in the assay. |
| Reverse Transcriptase & Master Mix [89] [91] | Essential for cDNA synthesis and PCR amplification efficiency. | A major source of variance. Use consistent, high-quality kits. Optimization of the master mix composition is crucial for digital assays. |
| DNA Intercalating Dye (e.g., SYBR Green) [7] | Allows detection of amplified PCR products in real-time. | Inexpensive and simple, but can bind to non-specific products. Requires extensive optimization. For ddPCR, select dyes that do not diffuse into the oil phase [91]. |
Assessing Analytical Specificity and Sensitivity Against Reference Materials
In reverse transcription polymerase chain reaction (RT-PCR) experiments, analytical sensitivity and analytical specificity are fundamental performance indicators that ensure the reliability of your results.
- Analytical Sensitivity refers to the lowest concentration of a target that an assay can reliably detect. It is often expressed as the limit of detection (LoD) and is crucial for avoiding false-negative results [92].
- Analytical Specificity refers to the ability of an assay to detect only the intended target and not cross-react with non-target organisms or genetic sequences, which is key to preventing false-positive results [92].
Establishing these parameters using well-characterized reference materials is a core strategy for reducing variance and enhancing reproducibility in the RT-PCR workflow [2].
Frequently Asked Questions (FAQs)
FAQ 1: What is the difference between diagnostic and analytical sensitivity/specificity?
While the terms are sometimes used interchangeably, their contexts differ. In this technical guide:
- Analytical performance is determined by testing against well-defined reference materials (e.g., synthetic RNA) in a controlled setting and relates to the technical capability of the assay itself [92].
- Diagnostic or clinical performance is evaluated using clinical samples (e.g., nasopharyngeal swabs) and describes how the test performs in a real-world patient population [93]. The figures in the table below, derived from kit validation studies, represent analytical performance.
FAQ 2: My positive control is amplifying, but my patient samples are negative. Could my assay sensitivity be the problem?
This is a common troubleshooting issue. If your positive control (a high-titer reference material) is working, the problem may lie with the limit of detection (LoD) of your assay for samples with low viral load. The assay might be technically functional but not sensitive enough to detect low-concentration targets in patient samples. This underscores the importance of verifying the LoD for each specific assay and sample type [92].
FAQ 3: How do viral mutations affect my assay's specificity and sensitivity?
Viral mutations, especially in the primer or probe binding regions, can significantly impact assay performance. A mutation can cause:
- Reduced Sensitivity or False Negatives: If a primer can no longer bind efficiently, amplification fails or is delayed, leading to a false negative or a higher Ct value [94].
- Altered Specificity: While less common, mutations could theoretically create new sequences that lead to non-specific binding.
One observed phenomenon is S-gene target failure in some SARS-CoV-2 variants, where mutations in the spike gene prevent its detection by specific assays, serving as a useful marker for variant screening [94]. Using assays that target multiple conserved genes (e.g., ORF1ab and N) can mitigate this risk [94].
FAQ 4: Why do different commercial kits have varying performance even when targeting the same gene?
As shown in the table above, different kits exhibit different sensitivity and specificity profiles. This variance can stem from several factors [94]:
- Primer/Probe Sequences: Slight differences in the design of primers and probes can affect binding efficiency.
- Reaction Chemistry: The master mix composition, including polymerase and buffer, can influence amplification efficiency.
- Probe Chemistry: The use of different fluorophores and quenchers (e.g., TaqMan, Molecular Beacons) can alter signal strength and background noise [7].
Troubleshooting Guides
Problem 1: High False Positive Rate
A high false positive rate indicates a problem with assay specificity.
| Possible Cause | Troubleshooting Action |
|---|---|
| Probe Degradation or Contamination | Prepare fresh aliquots of primers/probes. Use nuclease-free water and sterile techniques. |
| Non-specific Primer Binding | Re-optimize annealing temperature. Perform a temperature gradient PCR (e.g., 55°C–65°C) to find the temperature that maximizes specific product yield. |
| Amplification of Primer-Dimers (common with SYBR Green) | Use a primer design tool to check for self-complementarity. Switch to a probe-based chemistry (e.g., TaqMan) for higher specificity [7]. |
| Threshold Set Too Low | In real-time PCR data analysis, ensure the fluorescence threshold is set within the exponential phase of amplification, above the background noise. |
Problem 2: High False Negative Rate
A high false negative rate indicates a problem with assay sensitivity.
| Possible Cause | Troubleshooting Action |
|---|---|
| Suboptimal Reverse Transcription | The RNA-to-cDNA step is a major source of inefficiency. Use a robust reverse transcriptase and consider adding an external process control to monitor this step [95] [92]. |
| PCR Inhibition | Dilute the template nucleic acid to dilute potential inhibitors. Add a known quantity of synthetic control to the sample to test for inhibition. |
| Low Amplification Efficiency | Check primer design and re-optimize primer concentration and annealing temperature. Aim for an amplification efficiency between 90% and 110% [13]. |
| Incorrect Data Analysis Threshold | A threshold set too high might cause low-level positive samples to be misclassified as negative. |
The following workflow diagram illustrates the key steps for a robust validation process to minimize variance, integrating the troubleshooting points above.
Figure 1: A workflow for the validation of analytical specificity and sensitivity, incorporating key troubleshooting actions to reduce variance at each stage.
The Scientist's Toolkit: Research Reagent Solutions
The following table lists essential materials and their functions for establishing a reliable RT-PCR assay.
| Item | Function & Rationale |
|---|---|
| Synthetic RNA Standards | In vitro transcribed RNA of known concentration is the gold standard for determining the Limit of Detection (LoD) and constructing standard curves for absolute quantification [92]. |
| Characterized Clinical Samples | Well-defined positive and negative patient samples are crucial for initial validation and for assessing diagnostic sensitivity and specificity in a real-world matrix [93] [94]. |
| External Process Control (EPC) | A non-target synthetic RNA (e.g., from a plant virus) spiked into the sample. It controls for the entire process from nucleic acid extraction to amplification, identifying PCR inhibition or extraction failures [92]. |
| No-Template Control (NTC) | A reaction mix containing nuclease-free water instead of a sample template. It is essential for detecting contamination or reagent-borne background signal [2]. |
| Probe-Based Chemistry (TaqMan) | Hydrolysis probes offer superior specificity compared to intercalating dyes like SYBR Green because they require hybridization of a probe to the target sequence for signal generation, virtually eliminating false positives from primer-dimers [7]. |
| Automated Nucleic Acid Extraction System | Automated platforms (e.g., MagNA Pure 96) reduce user-dependent variation in one of the most variable steps of the workflow, improving precision and throughput [92]. |
Experimental Protocol: Determining Limit of Detection (LoD)
This protocol outlines the steps to determine the analytical sensitivity (LoD) of an RT-qPCR assay using synthetic RNA standards.
1. Preparation of Reference Material
- Obtain a synthetic dsDNA fragment (gBlock) containing the target sequence [92].
- Perform in vitro transcription to generate the RNA standard.
- Quantify the RNA accurately using a fluorometric method (e.g., Qubit RNA HS Assay) [92].
- Calculate the copy number/μL based on the molecular weight and concentration.
2. Sample Dilution Series
- Prepare a 10-fold serial dilution of the synthetic RNA in a background that mimics the clinical matrix (e.g., nucleic acid extract from a known negative nasopharyngeal sample) [92]. A typical range might be from 10^8 to 10^1 copies per PCR reaction.
3. RT-qPCR Run
- Run each dilution level in multiple replicates (at least 5-10 replicates per level are recommended for LoD determination) [2].
- Include the appropriate negative controls (NTC).
4. Data Analysis and LoD Calculation
- Plot the mean Ct value against the logarithm of the starting concentration for each dilution. The slope of the standard curve is used to calculate the amplification efficiency [92].
- The LoD is defined as the lowest concentration at which ≥95% of the replicates test positive [92].
This structured approach to validation and troubleshooting will significantly reduce workflow variance and enhance the reliability of your RT-PCR data.
Within the context of optimizing reverse transcription polymerase chain reaction (RT-PCR) workflows, the choice between Laboratory-Developed Tests (LDTs) and commercial in vitro diagnostic (IVD) kits is a critical strategic decision. This analysis directly compares these testing approaches based on key parameters essential for reducing variance in research and clinical settings. The focus is on providing a clear, actionable framework for researchers, scientists, and drug development professionals to select the most appropriate test format for their specific needs, thereby enhancing the reliability and reproducibility of their experimental data.
Fundamental Definitions and Regulatory Landscape
What are LDTs and IVDs?
Laboratory-Developed Tests (LDTs) are diagnostic test services developed, validated, and performed within a single laboratory entity [96]. They are often developed to meet specific clinical needs when no commercial IVD options are available [96]. LDTs are regulated under the Clinical Laboratory Improvement Amendments (CLIA) framework, which ensures analytical validity and reproducibility [96].
In Vitro Diagnostics (IVDs) are commercially distributed diagnostic products, typically packaged as test kits that include reagents, instruments, and instructions for use [97]. They undergo a premarket review process by regulatory bodies like the FDA to ensure safety and effectiveness before they can be marketed to multiple laboratories [96] [97].
Current Regulatory Framework
A significant recent development is the March 2025 court ruling from the U.S. District Court for the Eastern District of Texas, which vacated the FDA's Final Rule on LDTs [98]. The court held that the FDA lacked statutory authority to regulate LDTs as medical devices, affirming that CLIA remains the primary regulatory framework for these tests [98]. This decision preserves laboratories' ability to develop and offer LDTs without the additional burden of FDA premarket review.
Direct Comparison: LDTs vs. Commercial IVD Kits
Table 1: Comparative analysis of LDTs and IVD kits across key parameters
| Parameter | Laboratory-Developed Tests (LDTs) | Commercial IVD Kits |
|---|---|---|
| Development & Regulatory Pathway | Developed and used within a single lab; regulated under CLIA [96] [98]. | Developed by a manufacturer; requires FDA premarket review (clearance/approval) [96] [97]. |
| Customization & Flexibility | High flexibility to adapt to specific research needs, rare diseases, or emerging threats [98]. | Low flexibility; standardized protocols and reagents for consistent widespread use [97]. |
| Intended Use & Availability | Single laboratory entity; not marketed or sold to other labs [96]. | Commercially distributed to multiple laboratories and healthcare facilities [96] [97]. |
| Speed to Implementation | Rapid development and deployment, crucial for emerging pathogens or novel biomarkers [98]. | Slower due to extensive development and regulatory review processes [97] [98]. |
| Reported Diagnostic Accuracy (Example) | One study on PD-L1 testing for NSCLC reported 73% accuracy [97]. | The same PD-L1 study reported 93% accuracy for an IVD [97]. |
| Cost & Reimbursement Considerations | Potentially lower cost per test; coverage depends on payer policies, not regulatory status [96]. | Higher development cost; coverage depends on payer policies, not regulatory status [96]. |
Table 2: Impact analysis on RT-PCR workflow variance reduction
| Variance Factor | Impact of LDTs | Impact of IVD Kits |
|---|---|---|
| Reagent Lot Consistency | Variable; depends on lab's sourcing and quality control. | High; strict manufacturer controls ensure lot-to-lot consistency. |
| Protocol Standardization | Variable; protocols are lab-specific, potentially leading to inter-lab variance. | High; standardized protocols and instructions minimize operational variance. |
| Analytical Performance | Dependent on the individual lab's validation rigor [96]. | Pre-validated with defined performance characteristics (e.g., sensitivity, specificity) [97]. |
| Instrument Dependency | Can be optimized for a lab's specific equipment. | Often optimized for specific, recommended instruments. |
| Troubleshooting & Support | Lab relies on in-house expertise. | Manufacturer provides technical support and application expertise. |
Troubleshooting Guides and FAQs
This section addresses common technical issues encountered in RT-PCR workflows, providing targeted strategies for both LDT and IVD kit users to minimize variance.
Troubleshooting Common RT-PCR Amplification Issues
Table 3: Troubleshooting guide for common RT-PCR issues
| Problem | Possible Causes | Recommended Solutions for Variance Reduction |
|---|---|---|
| Low or No Amplification | Poor RNA integrity, low RNA purity/presence of inhibitors, suboptimal reverse transcriptase [5]. | - Assess RNA integrity pre-synthesis (gel/electrophoresis) [5].- Repurify RNA to remove inhibitors (e.g., salts, heparin) [5] [99].- Use a robust, inhibitor-resistant reverse transcriptase [5]. |
| Nonspecific Amplification (e.g., multiple bands, smearing) | Low annealing temperature, genomic DNA (gDNA) contamination, problematic primer design [5] [99]. | - Optimize annealing temperature using a gradient PCR cycler [99].- Treat RNA with DNase and include a no-RT control [5].- Design primers to span exon-exon junctions [5]. |
| Poor Reproducibility (High Well-to-Well or Run-to-Run Variance) | Pipetting inaccuracies, reagent degradation, inconsistent thermal cycling, contaminating amplicons [100] [20]. | - Automate liquid handling for precision [100] [20].- Implement strict reagent management (track expiration, use aliquots) [20].- Establish separate pre- and post-PCR workspaces [20]. |
Frequently Asked Questions (FAQs)
Q: Does FDA clearance guarantee that my insurance will cover a test?
- A: No. Coverage and reimbursement by Medicare or commercial insurers are evaluated separately from FDA authorization. Payers make decisions based on clinical utility and medical necessity, meaning both LDTs and IVDs require individual efforts to secure coverage [96].
Q: For an LDT, what is the most critical step to ensure accuracy comparable to an IVD?
- A: Rigorous internal validation is paramount. This involves establishing and documenting the test's analytical sensitivity, specificity, precision, and reportable range under CLIA standards. A thoroughly validated LDT can achieve performance metrics on par with an IVD [96].
Q: What is the primary cause of nonspecific amplification in PCR, and how can it be fixed?
- A: The most common cause is an annealing temperature that is too low [99]. The most effective solution is to use a gradient PCR function to empirically determine the optimal annealing temperature for your specific primer-template combination, which increases stringency and minimizes off-target binding [99].
Q: How can automation reduce variance in high-throughput RT-PCR workflows?
Experimental Protocols for Key Comparative Analyses
Protocol: Evaluating Reverse Transcriptase Performance for LDTs
Objective: To systematically compare the efficiency and sensitivity of different reverse transcriptase enzymes for use in an LDT.
- RNA Template Preparation: Serially dilute a high-quality, standardized RNA sample (e.g., Universal Human Reference RNA) in nuclease-free water to create a range from 1 pg to 1 µg.
- Reverse Transcription Setup: For each reverse transcriptase under evaluation, set up identical reactions using the same master mix containing primers (e.g., random hexamers and oligo(dT)), dNTPs, and RNase inhibitor. Aliquot the master mix and add the different enzymes according to their optimized protocols.
- cDNA Synthesis: Perform the reverse transcription reaction in a thermal cycler using the manufacturers' recommended conditions (time and temperature).
- qPCR Amplification: Use an aliquot of the synthesized cDNA to perform qPCR for a stable, medium-abundance reference gene (e.g., GAPDH, β-actin) using a pre-validated assay.
- Data Analysis: Plot the log of the input RNA quantity against the Cq value obtained from qPCR. The slope of the curve indicates amplification efficiency. The Cq values at lower RNA inputs indicate sensitivity. The enzyme yielding the lowest Cq values across dilutions with a steep, linear slope is the most efficient and sensitive.
Protocol: Determining Optimal Annealing Temperature
Objective: To empirically determine the optimal annealing temperature (Ta) for a primer pair to maximize specificity and yield, a critical step for both LDTs and IVDs.
- Reaction Setup: Prepare a standard PCR master mix containing buffer, dNTPs, polymerase, template DNA, and forward/reverse primers.
- Gradient PCR: Using a thermal cycler with a gradient function, program a range of annealing temperatures (e.g., 50°C to 65°C) for a single cycle during the annealing step. All other cycles use a standard, non-gradient temperature.
- Analysis: Run the PCR products on an agarose gel. The optimal annealing temperature is the highest temperature that produces a single, intense band of the expected size. Higher temperatures promote specificity but may reduce yield.
Workflow and Decision Pathways
The Scientist's Toolkit: Essential Reagents and Materials
Table 4: Key research reagent solutions for RT-PCR optimization
| Reagent/Material | Critical Function | Role in Variance Reduction |
|---|---|---|
| High-Fidelity Reverse Transcriptase | Converts RNA to cDNA with high efficiency and low error rates, even with challenging samples [5]. | Reduces variation in cDNA synthesis, the foundational step for all downstream qPCR results. |
| RNase Inhibitors | Protects RNA templates from degradation by RNases during reaction setup [5]. | Prevents loss of signal and introduction of noise due to RNA degradation, ensuring consistent input material. |
| Nuclease-Free Water | Serves as a pure solvent for preparing reaction mixes without nucleases that degrade nucleic acids [5]. | Eliminates a common, hidden source of reaction failure and inconsistent results. |
| DNase I (RNase-free) | Digests and removes contaminating genomic DNA from RNA preparations prior to RT [5]. | Prevents false positive signals and nonspecific amplification, leading to more accurate Cq values. |
| dNTP Mix | Provides the essential nucleotides (dATP, dCTP, dGTP, dTTP) for DNA synthesis by polymerase enzymes. | Consistent quality and concentration are vital for efficient amplification and maintaining reaction fidelity. |
| PCR Additives (e.g., DMSO, Betaine) | DMSO helps denature GC-rich secondary structures; Betaine homogenizes base stability [99]. | Improves amplification efficiency of difficult templates, reducing dropouts and variance in complex samples. |
| MgCl₂ Solution | Serves as an essential cofactor for DNA polymerase activity; concentration critically affects specificity and yield [99]. | Fine-tuning Mg²⁺ concentration is a primary method for optimizing reaction specificity and minimizing nonspecific products. |
| Automated Liquid Handler | Precisely dispenses microliter-to-nanoliter volumes of reagents and samples [100]. | Dramatically reduces human error and well-to-well variation, the largest source of technical variance in manual setups. |
Implementing Continuous Monitoring with Internal and External Quality Controls
In the context of research dedicated to RT-PCR workflow variance reduction, implementing a robust system of internal and external quality controls (QCs) is paramount. Continuous monitoring through these controls is not merely a best practice but a fundamental requirement for generating reliable, reproducible, and clinically actionable data. This technical support center provides a comprehensive guide to establishing these monitoring systems, complete with troubleshooting guides and frequently asked questions (FAQs) to address specific issues encountered during experiments. Adherence to these protocols is critical for mitigating technical errors, reagent drift, and contamination, thereby ensuring the integrity of research and drug development outcomes [101] [102].
Core Concepts and Workflow
A comprehensive quality control system integrates both internal and external controls at critical points in the RT-PCR workflow to monitor performance from sample receipt to data analysis. The following diagram illustrates the strategic placement of these controls and the continuous monitoring feedback loop.
Troubleshooting Guide
This section addresses common experimental issues, their potential causes, and recommended corrective actions to reduce workflow variance.
| Problem | Potential Causes | Corrective Actions |
|---|---|---|
| Amplification in No-Template Control (NTC) | - Contaminated reagents or consumables- Amplicon contamination in lab environment | - Prepare fresh master mix and reagents- Decontaminate workspaces and equipment- Use dedicated pre- and post-PCR areas [101] [103] |
| No Amplification in Target & IPC | - PCR inhibitors in sample- Reverse transcription failure- Defective PCR reagents or thermal cycler | - Assess RNA purity (A260/A280 ratio)- Check reverse transcription protocol and reagents- Test with a new batch of master mix [103] [104] |
| Delayed Ct in Target Samples | - Low RNA quality or quantity- Suboptimal reverse transcription efficiency- Poor primer/probe design | - Check RNA integrity (e.g., RIN number)- Increase RNA input within validated range- Re-design and validate primers/probe [103] |
| High Variation in EQC Replicates | - Pipetting inaccuracy- Improper mixing of reagents- Instrumental drift | - Calibrate pipettes regularly- Mix reaction components thoroughly- Perform instrument maintenance and calibration [101] |
| EQC Ct Value Out of Acceptable Range | - Reagent degradation (e.g., enzymes, primers)- Lot-to-lot reagent variability- Thermal cycler block temperature error | - Use fresh aliquots of reagents- Re-calibrate assay with new reagent lot- Verify thermal cycler calibration [101] |
Frequently Asked Questions (FAQs)
Q1: What is the difference between an Internal and an External Quality Control?
A: An Internal Control (IPC), such as an RNA or DNA sequence spiked into the sample, is co-processed with the test sample through the entire workflow, including nucleic acid extraction. It detects inhibition and monitors extraction efficiency. An External Quality Control (EQC) is a known reference material processed in parallel with patient samples but not necessarily through the extraction step. It is used to monitor the precision and accuracy of the amplification process itself and is essential for detecting reagent degradation or instrument drift [101].
Q2: How many quality controls should be included in each PCR run?
A: At a minimum, every qPCR run should include:
- One negative control (No-Template Control, NTC) to detect contamination.
- One positive amplification control (EQC) to confirm the assay is working.
- For diagnostic or absolute quantification, a calibrator or standard curve with known concentrations is needed.
- When monitoring sample-specific inhibition, an Internal Positive Control (IPC) should be added to each sample [101]. Including both high and low-level EQC is considered a best practice [101].
Q3: My baseline fluorescence settings appear incorrect. How should I adjust them?
A: Most instrument software can set the baseline automatically, but manual adjustment may be needed. The baseline should typically be set within the cycle range where the fluorescence signal is flat and stable, prior to any noticeable increase from the amplification of the target. Review your instrument's guidance on understanding baselines for visual examples [103].
Q4: What should I do if my melt curve shows multiple peaks when using SYBR Green?
A: Multiple peaks in a melt curve typically indicate the presence of non-specific products, such as primer-dimers or unintended amplicons. Since SYBR Green binds to any double-stranded DNA, this is a critical check for assay specificity. You should re-optimize your PCR conditions, which may involve adjusting annealing temperature, magnesium concentration, or re-designing your primers to improve specificity [103].
Q5: How do I establish acceptable ranges for my External Quality Controls?
A: Acceptance limits for EQC materials (e.g., mean Ct value ± a variation) must be established through a validation study in your own laboratory. You should run the EQC over at least 10-20 independent runs to determine the mean Ct value and the standard deviation. Acceptance limits are then typically set based on this historical data, for example, as mean Ct ± 2SD or ± 1 Ct [101].
The Scientist's Toolkit: Research Reagent Solutions
The following table details key reagents and materials essential for implementing effective quality control in RT-PCR workflows.
| Item | Function & Rationale |
|---|---|
| Validated EQC Material | Known reference samples (e.g., synthetic RNA, inactivated virus) used to assess the full assay process from extraction to amplification. They must be traceable, consistent across lots, and stable [101]. |
| Internal Positive Control (IPC) | A non-interfering nucleic acid sequence spiked into each sample to monitor for PCR inhibition and confirm successful nucleic acid extraction within each individual sample [101] [105]. |
| Hot-Start DNA Polymerase | A modified enzyme that remains inactive at room temperature, preventing non-specific amplification and primer-dimer formation during reaction setup, thereby enhancing assay specificity and sensitivity [106]. |
| Nucleic Acid Extraction Kits | Kits optimized for specific sample types (e.g., TRIzol-based for muscle tissue) are crucial for obtaining high-yield, high-purity RNA, which is the foundation of reliable RT-PCR results [104]. |
| No-Template Control (NTC) | A well containing all reaction components except the template nucleic acid. It is a critical control for detecting contamination in reagents or environmental amplicons [101] [103]. |
In reverse transcription quantitative PCR (RT-qPCR) workflows, normalization is not merely a data processing step; it is a fundamental prerequisite for accurate gene expression analysis. This process minimizes non-biological technical variability introduced during sample collection, RNA extraction, reverse transcription, and PCR amplification, thereby ensuring that observed expression differences reflect true biological variation [107] [53]. The established Minimum Information for Publication of Quantitative Real-Time PCR Experiments (MIQE) guidelines strongly recommend validating reference gene stability for each specific experimental condition, moving beyond the traditional use of single housekeeping genes like GAPDH or ACTB without proper verification [108] [26].
Data-driven normalization strategies represent a paradigm shift. Instead of relying on a priori assumptions about gene stability, these methods leverage the dataset itself to correct for technical variance. Among these, quantile and rank-invariant set normalization have emerged as robust alternatives, particularly for high-throughput qPCR experiments where dozens to thousands of genes are profiled simultaneously [107]. When implemented correctly within a comprehensive variance reduction strategy, these methods significantly enhance the rigor, reproducibility, and biological accuracy of RT-PCR data interpretation [26].
Understanding Quantile Normalization
Core Principle and Algorithm
Quantile normalization operates on a fundamental assumption: the overall distribution of gene transcript levels remains approximately constant across the samples being compared. The method forces the expression value distributions of all samples to be identical across all quantiles [107]. This approach was adapted from microarray analysis and has proven particularly valuable for qPCR data, especially when dealing with multi-plate experiments where plate-specific effects can introduce significant bias [107].
The algorithm proceeds through these computational steps:
- Data Structuring: qPCR data from multiple samples are arranged into a matrix where each column represents a sample and each row represents a gene.
- Sorting: Each column (sample) is sorted independently in ascending order, creating a new matrix of sorted expression values.
- Averaging: The average expression value for each row across all samples is computed, generating an "average quantile distribution."
- Replacement: Each sorted column is replaced with this average quantile distribution.
- Reordering: The data is rearranged back to the original gene order, resulting in normalized expression values where all samples now share the same distribution [107].
For experiments where a single sample's analysis is distributed across multiple PCR plates, the method can be applied in two stages: first to remove plate-to-plate variability within each sample, and then to normalize across different samples [107].
Troubleshooting and FAQs: Quantile Normalization
Q1: When is quantile normalization most appropriate for my RT-PCR data? A: Quantile normalization performs best in these scenarios:
- High-throughput qPCR studies profiling dozens to thousands of genes.
- Experiments with genes randomly assigned to plates, ensuring no systematic bias in gene distribution across plates.
- Situations where you can reasonably assume the global transcript distribution is similar across your sample groups [107].
Q2: I normalized my data using quantile normalization, and now my positive control appears altered. What might be wrong? A: This is a common pitfall. Quantile normalization assumes most genes are not differentially expressed. If your experimental conditions cause widespread transcriptional changes (a global shift in expression), this assumption is violated, and quantile normalization may introduce artifacts by forcing distributions to be identical. In such cases, rank-invariant set normalization or carefully selected reference genes may be more appropriate [109].
Q3: Are there specific data quality checks I should perform before applying quantile normalization? A: Yes, always:
- Inspect distributions visually using boxplots of raw Cq values to see if the overall shapes and medians are reasonably similar across samples.
- Verify random gene assignment to plates. If genes with expected similar expression levels (e.g., highly expressed genes) are grouped on the same plate, plate-specific normalization may be biased.
- Check for missing data, as the algorithm may handle missing values by padding, which can affect the results [107].
Understanding Rank-Invariant Set Normalization
Core Principle and Algorithm
Rank-invariant set normalization identifies a subset of genes that maintain their relative expression ranks across experimental conditions. Rather than assuming global distribution consistency, this method assumes that a specific set of genes—which may vary from experiment to experiment—shows stable expression and can serve as an internal benchmark for normalization [107] [109]. This approach is particularly valuable when global transcript levels are expected to shift significantly between conditions, such as in cancer cells versus normal cells or different tissue types [109].
The algorithm follows this sequence:
- Reference Selection: A common reference sample is chosen. This could be a control sample (e.g., time zero in a time course), the sample with the median profile, or an average of all samples.
- Rank-Invariant Gene Identification: For each sample compared to the reference, genes are identified whose expression ranks remain largely unchanged. This involves ordering genes by expression in both the test and reference samples and selecting those within a pre-defined rank difference threshold.
- Stable Gene Set Formation: The intersection of these rank-invariant genes across all sample comparisons creates a final, robust set of stable genes.
- Scale Factor Calculation: For each sample, the average expression of the rank-invariant gene set is calculated. A scale factor is derived for each sample
jasβ_j = α_ref / α_j, whereαis the average expression of the invariant set. - Data Normalization: All expression values in sample
jare multiplied by its scale factorβ_j[107].
Troubleshooting and FAQs: Rank-Invariant Set Normalization
Q1: How many rank-invariant genes are typically found, and is there a minimum number required? A: The number varies significantly by experiment. In a study of macrophage-like cells, only five rank-invariant genes (GAPDH, ENO1, HSP90AB1, ACTB, EEF1A1) were identified from 2,396 profiled genes [107]. There is no universal minimum, but the set must be sufficiently large to provide a stable average. If too few genes (<5-10) are identified, the normalization factor may be sensitive to outliers.
Q2: What if my experiment has no obvious control sample to use as a reference? A: The reference does not have to be a biological control. You can use the geometric mean of all samples or select the sample whose profile is closest to the median of all samples as a data-driven reference. The key is consistency in applying the chosen reference across all analyses [107] [110].
Q3: After normalization, my target gene's variance seems higher. What could be the cause? A: This can occur if your target gene is inadvertently included in the rank-invariant set. The algorithm assumes the invariant genes are not differentially expressed. If a true differentially expressed target gene is misclassified as invariant, its biological variation will be incorrectly "corrected" during normalization, potentially increasing apparent variance or creating false negatives. Ensure your target genes are excluded from the invariant selection process.
Performance Comparison and Application Guide
Method Selection and Comparative Performance
The choice between quantile and rank-invariant normalization depends on your experimental design, the number of genes profiled, and the expected biological changes. A 2025 study on canine gastrointestinal tissues found that while stable reference genes (RPS5, RPL8, HMBS) were effective, the global mean (GM) method—conceptually similar to quantile—outperformed other strategies when profiling more than 55 genes [111].
Table 1: Comparison of Data-Driven Normalization Methods for RT-PCR
| Feature | Quantile Normalization | Rank-Invariant Set Normalization |
|---|---|---|
| Core Principle | Forces identical expression value distributions across all samples [107]. | Identifies and uses genes with stable rank order across samples for normalization [107]. |
| Optimal Use Case | High-throughput qPCR with random gene assignment to plates; stable global transcript levels [107]. | Experiments with expected global expression shifts (e.g., different tissues, cancer vs. normal) [109]. |
| Key Advantage | Effective removal of plate-based technical effects; robust performance in large datasets [107] [111]. | Does not assume global distribution stability; uses a data-derived stable gene set [107]. |
| Primary Limitation | Can introduce bias if global transcript levels differ significantly between conditions [109]. | Relies on finding a sufficient number of rank-invariant genes; performance drops if few are found [107]. |
| Recommended Minimum Genes | >50 genes for reliable performance [111]. | No strict minimum, but stability increases with more invariant genes. |
Advanced Strategy: Stable Combinations of Genes
Emerging evidence suggests that a carefully selected combination of genes, even if individually unstable, can outperform classic "stable" reference genes. A 2024 study demonstrated that finding an optimal combination of genes whose expressions balance each other across conditions provides superior normalization. This method uses RNA-Seq data to identify in silico the best gene combinations for a given experimental context, which are then validated by qPCR [110]. This represents a next-generation data-driven approach that leverages public datasets to enhance normalization accuracy.
Successful implementation of data-driven normalization requires both wet-lab and computational tools. The following table lists key reagents and resources referenced in the studies discussed.
Table 2: Research Reagent Solutions for Data-Driven Normalization Workflows
| Reagent / Resource | Function / Description | Example Use in Context |
|---|---|---|
| High-Throughput qPCR Platform | Enables profiling of dozens to thousands of genes across many samples. | Foundation for applying quantile or rank-invariant methods; required to generate sufficient data points [107]. |
| RNA Later Preservation Solution | Stabilizes RNA in tissues immediately after collection, preserving expression profiles. | Used in canine intestinal study to ensure RNA integrity pre-extraction, reducing technical variation [111]. |
| SYBR Green Master Mix | Fluorescent dye for real-time PCR product detection. | Used in HEK293 cell line study for reference gene validation; requires melt curve analysis for specificity [112]. |
| Transcriptor First Strand cDNA Synthesis Kit | High-efficiency reverse transcription of RNA to cDNA. | Used to create cDNA libraries from HEK293 total RNA for reference gene stability assessment [112]. |
| geNorm Algorithm [53] | Software to determine the most stable reference genes from a candidate set. | Ranked 12 candidate genes in HEK293 cells; found UBC and TOP1 most stable [112]. |
| NormFinder Algorithm [108] | Algorithm to evaluate candidate reference gene stability. | Used alongside geNorm in mouse brain ageing study to identify region-specific stable genes [108]. |
R/Bioconductor qpcrNorm Package |
Implements quantile and rank-invariant normalization for qPCR data. | Provides a standardized, reproducible computational environment for applying these methods [107]. |
Conclusion
Minimizing variance in RT-PCR is not a single intervention but a holistic commitment to quality at every stage of the workflow, from initial sample handling to final data analysis. By understanding variance sources, implementing standardized methodologies, proactively troubleshooting, and adhering to rigorous validation frameworks, researchers can generate data that is both precise and biologically meaningful. The widespread adoption of these strategies, guided by the MIQE principles, is paramount for enhancing the reproducibility of biomedical research, accelerating robust biomarker discovery, and ensuring the reliability of molecular diagnostics in clinical and drug development settings.
References
- 1. Quantitative PCR (qPCR) Data Analysis [https://www.thermofisher.com/us/en/home/life-science/pcr/real-time-pcr/real-time-pcr-learning-center/gene-expression-analysis-real-time-pcr-information/precision-qpcr.html]
- 2. Impact of variance components on reliability of absolute ... [https://pmc.ncbi.nlm.nih.gov/articles/PMC4261249/]
- 3. Factors Contributing to Variability of Quantitative Viral PCR ... [https://pmc.ncbi.nlm.nih.gov/articles/PMC3264161/]
- 4. Real-Time Quantitative RT-PCR: Design, Calculations, and ... [https://pmc.ncbi.nlm.nih.gov/articles/PMC2685626/]
- 5. Reverse transcription troubleshooting guide [https://www.thermofisher.com/us/en/home/life-science/cloning/cloning-learning-center/invitrogen-school-of-molecular-biology/rt-education/reverse-transcription-troubleshooting.html]
- 6. PCR Troubleshooting: Common Problems and Solutions [https://www.mybiosource.com/learn/pcr-troubleshooting-common-problems-and-solutions/]
- 7. The Basics: RT-PCR [https://www.thermofisher.com/us/en/home/references/ambion-tech-support/rtpcr-analysis/general-articles/rt--pcr-the-basics.html]
- 8. Pre-Analytical Variation | myadlm.org [https://myadlm.org/cln/articles/2016/july/preanalytical-variation-the-leading-cause-of-error-in-laboratory-medicine]
- 9. Preanalytical Variables and Their Influence on the Quality ... [https://pmc.ncbi.nlm.nih.gov/articles/PMC6238383/]
- 10. Pre-Analytical Variables [https://www.practical-haemostasis.com/Quality%20Assurance/pre_analytical_variables.html]
- 11. The Votes Are In- What Causes qPCR and RNA-Seq ... [https://nanostring.com/blog/the-votes-are-in-what-causes-qpcr-and-rna-seq-variability/]
- 12. PCR Troubleshooting Guide | Thermo Fisher Scientific - US [https://www.thermofisher.com/us/en/home/life-science/cloning/cloning-learning-center/invitrogen-school-of-molecular-biology/pcr-education/pcr-reagents-enzymes/pcr-troubleshooting.html]
- 13. An optimized protocol for stepwise optimization of real-time ... [https://www.nature.com/articles/s41438-021-00616-w]
- 14. Assessing the integrity of SARS-CoV-2 and F-specific RNA ... [https://www.sciencedirect.com/science/article/pii/S0043135425019050]
- 15. Enzyme- and gene-specific biases in reverse transcription ... [https://www.nature.com/articles/s41598-020-65005-0]
- 16. The reproducibility of biomedical research: Sleepers awake! [https://pmc.ncbi.nlm.nih.gov/articles/PMC5121206/]
- 17. PCR Troubleshooting Guide [https://www.neb.com/en-us/tools-and-resources/troubleshooting-guides/pcr-troubleshooting-guide?srsltid=AfmBOoopvPojPiVCkRbKy9E3-bjUJSS0AaCY3rz0oDRpWTxSZQc38zIy]
- 18. Optimizing PCR: Proven Tips and Troubleshooting Tricks [https://www.the-scientist.com/optimizing-pcr-proven-tips-and-troubleshooting-tricks-71660]
- 19. Real-Time PCR Reagents and Kits [https://www.thermofisher.com/us/en/home/life-science/pcr/real-time-pcr/reagents-kits.html]
- 20. Optimizing PCR Workflows: 4 Strategies for Lab Managers [https://www.labmanager.com/optimizing-pcr-workflows-4-strategies-for-lab-managers-33688]
- 21. Enzyme Assay Analysis: What Are My Method Choices? [https://www.thermofisher.com/blog/analyteguru/enzyme-assay-analysis-what-are-my-method-choices/]
- 22. A General Guide for the Optimization of Enzyme Assay ... [https://www.sciencedirect.com/science/article/pii/S247255522206779X]
- 23. Real-time PCR Thermal Cyclers Market Size & Share 2025 ... [https://www.360iresearch.com/library/intelligence/real-time-pcr-thermal-cyclers]
- 24. High-performance Thermal Cycler Market Challenges 2025 [https://www.linkedin.com/pulse/high-performance-thermal-cycler-market-challenges-gyhlc/]
- 25. The Impact of the Variability of RT-qPCR Standard Curves ... [https://pmc.ncbi.nlm.nih.gov/articles/PMC12029521/]
- 26. Analyzing qPCR data: Better practices to facilitate rigor and ... [https://www.sciencedirect.com/science/article/pii/S2405580825004431]
- 27. PCR Troubleshooting Tips [https://www.sigmaaldrich.com/US/en/technical-documents/technical-article/genomics/pcr/pcr-troubleshooting-tips?srsltid=AfmBOorwMm8YoiNsHe51razK40x15kNsc-ktdYCZM6wBAYVtVfybu0g8]
- 28. Development of real-time PCR methods for quality control ... [https://www.frontiersin.org/journals/public-health/articles/10.3389/fpubh.2025.1572201/full]
- 29. Tech Tip: Tips & Best Practices for Working with RNA [https://biotium.com/tech-tips-protocols/tips-best-practices-for-working-with-rna/]
- 30. Top Ten Ways to Improve Your RNA Isolation [https://www.thermofisher.com/us/en/home/references/ambion-tech-support/rna-isolation/general-articles/ten-ways-to-improve-your-rna-isolation.html]
- 31. When It's All About Quality: The Importance of Purity and ... [https://www.bioecho.com/blog/when-its-all-about-quality-the-importance-of-purity-and-integrity-estimation]
- 32. The Most Comprehensive Guide to RNA Extraction [https://rna.cd-genomics.com/resource/guide-rna-extraction.html]
- 33. Overcoming the Challenges of High Quality RNA Extraction ... [https://pmc.ncbi.nlm.nih.gov/articles/PMC8143498/]
- 34. One-Step vs Two-Step RT-PCR [https://www.thermofisher.com/us/en/home/brands/thermo-scientific/molecular-biology/molecular-biology-learning-center/molecular-biology-resource-library/spotlight-articles/onestep-vs-twostep-rtpcr.html]
- 35. Basic Principles of RT-qPCR [https://www.thermofisher.com/us/en/home/brands/thermo-scientific/molecular-biology/molecular-biology-learning-center/molecular-biology-resource-library/spotlight-articles/basic-principles-rt-qpcr.html]
- 36. Choice Of One Step RT-qPCR Or Two Step RT-qPCR [https://www.neb.com/en-us/applications/dna-amplification-pcr-and-qpcr/choice-of-one-step-rt-qpcr-or-two-step-rt-qpcr?srsltid=AfmBOorcpDrPzea_XcsFhsnCV7JuHdg3DcEZOSZOg6uhJ3q3u1fiPDYz]
- 37. Starting with RNA—One-step or two-step RT-qPCR? | IDT [https://www.idtdna.com/page/support-and-education/decoded-plus/one-step-two-step/]
- 38. cDNA Synthesis Troubleshooting | Blog [https://go.zageno.com/blog/cdna-synthesis-troubleshooting]
- 39. Troubleshooting Tips for cDNA Library Preparation in Next ... [https://www.stackwave.com/antibody-discovery-faqs/troubleshooting-tips-for-cdna-library-preparation-in-next-generation-sequencing]
- 40. Rules and Tips for PCR & qPCR Primer Design | IDT [https://www.idtdna.com/page/support-and-education/decoded-plus/how-to-design-primers-and-probes-for-pcr-and-qpcr/]
- 41. Primer design guide - 5 tips for best PCR results [https://the-dna-universe.com/2022/09/05/primer-design-guide-the-top-5-factors-to-consider-for-optimum-performance/]
- 42. Top Ten Pitfalls in Quantitative Real-time PCR Primer ... [https://www.thermofisher.com/us/en/home/references/ambion-tech-support/rtpcr-analysis/general-articles/top-ten-pitfalls-in-quantitative-real-time-pcr-primer.html]
- 43. Optimization of the real-time PCR platform method using ... [https://www.nature.com/articles/s41598-025-16972-9]
- 44. An Innovative AI-based primer design tool for precise and ... [https://www.nature.com/articles/s41598-023-42348-y]
- 45. Design of primers and probes for quantitative real-time ... [https://pubmed.ncbi.nlm.nih.gov/25697650/]
- 46. Optimization of the viability PCR for accurate detection of ... [https://journals.plos.org/plosone/article?id=10.1371/journal.pone.0324819]
- 47. qPCR Primer & Probe Design Tool [https://eurofinsgenomics.eu/en/ecom/tools/qpcr-assay-design/]
- 48. Control your error! How to minimize pipetting error and get ... [https://bitesizebio.com/25261/control-your-error-how-to-minimize-pipetting-error-and-get-low-sds-in-qrt-pcr/]
- 49. Introduction to designing an experiment and ... [https://docs.ropensci.org/tidyqpcr/articles/platesetup_vignette.html]
- 50. PCR Setup—Six Critical Components to Consider [https://www.thermofisher.com/us/en/home/life-science/cloning/cloning-learning-center/invitrogen-school-of-molecular-biology/pcr-education/pcr-reagents-enzymes/pcr-component-considerations.html]
- 51. An optimized protocol for stepwise optimization of real-time RT ... [https://pmc.ncbi.nlm.nih.gov/articles/PMC8325682/]
- 52. Single-Tube Analysis Can Help You Avoid These 5 ... [https://www.thermofisher.com/blog/life-in-the-lab/single-tube-analysis-can-help-you-avoid-these-5-common-rt-pcr-challenges/]
- 53. Accurate normalization of real-time quantitative RT - PCR data by... [https://genomebiology.biomedcentral.com/articles/10.1186/gb-2002-3-7-research0034]
- 54. Real-time RT - PCR ; strategies and considerations normalisation [https://www.nature.com/articles/6364190?error=cookies_not_supported&code=57bd970c-cc51-4408-8bf9-0478c0075da3]
- 55. Accurate normalization of real-time quantitative RT - PCR data by... [https://pubmed.ncbi.nlm.nih.gov/12184808/]
- 56. Data-driven normalization strategies for high-throughput ... [https://pubmed.ncbi.nlm.nih.gov/19374774/]
- 57. Minimizing Variation in qPCR Workflows [https://www.genengnews.com/insights/minimizing-variation-in-qpcr-workflows/]
- 58. qPCR troubleshooting: interpreting amplification curves ... [https://www.linkedin.com/pulse/qpcr-troubleshooting-interpreting-amplification-]
- 59. How To Interpret RT-qPCR Results [https://www.goldbio.com/blogs/articles/how-to-interpret-rt-qpcr-results?srsltid=AfmBOoqQKY2t1gIG865GlouVMBHvgzQBZYpcI29f3tIk30ftLFjKjwVm]
- 60. Pitfalls in PCR troubleshooting: Expect the unexpected? [https://pmc.ncbi.nlm.nih.gov/articles/PMC4822207/]
- 61. Tech Support: 8 Tips to Improve Your RT-qPCR Workflow [https://www.quantabio.com/tech-support-8-tips-to-improve-your-rt-qpcr-workflow/]
- 62. Understanding Ct Values in Real-Time PCR [https://www.thermofisher.com/blog/behindthebench/understanding-ct-values/]
- 63. Note on the PCR threshold standard curve - PMC [https://pmc.ncbi.nlm.nih.gov/articles/PMC5725963/]
- 64. Evaluation of PCR-enhancing approaches to reduce ... [https://www.sciencedirect.com/science/article/abs/pii/S0048969724069250]
- 65. Dealing with PCR Inhibitors [https://www.promegaconnections.com/dealing-with-pcr-inhibitors/]
- 66. Troubleshooting your PCR [https://www.takarabio.com/learning-centers/pcr/faq/troubleshooting?srsltid=AfmBOooKxoEO0qaFj0b0CVREpSWsIzTELZhqM6zs6T1VLolvPB8C8zcY]
- 67. Assessment of PCR Inhibitor Removal Methods to Monitor ... [https://link.springer.com/article/10.1007/s11270-023-06821-8]
- 68. Removal of PCR Inhibitors by Silica Membranes [https://pmc.ncbi.nlm.nih.gov/articles/PMC88425/]
- 69. real-time PCR optimisation (1) [https://www.gene-quantification.de/optimization.html]
- 70. Development and Optimization of a Multiplex Real-Time ... [https://pmc.ncbi.nlm.nih.gov/articles/PMC10948217/]
- 71. Optimization Tips for Luna® One-Step RT-qPCR [https://www.neb.com/en-us/tools-and-resources/usage-guidelines/optimization-tips-for-luna-one-step-rt-qpcr?srsltid=AfmBOoq3cJCSWLbRN24N4-i2aYK1tYpl5eSUVWEGqx_t_EzPxxLj40X4]
- 72. Real-time PCR probe optimization using design of ... [https://www.sciencedirect.com/science/article/pii/S2214753515300139]
- 73. PCR Troubleshooting Guide [https://www.neb.com/en-us/tools-and-resources/troubleshooting-guides/pcr-troubleshooting-guide?srsltid=AfmBOoqFeQd9nttfuq8bQAJvhAtRDPGgL-qbA40esa85c7HavVkUxNwG]
- 74. Polymerase Chain Reaction: Basic Protocol Plus ... [https://pmc.ncbi.nlm.nih.gov/articles/PMC4846334/]
- 75. Is Contamination Compromising Your RT-PCR Results? ... [https://www.abdoslifesciences.com/is-contamination-compromising-your-rt-pcr-results-heres-how-to-detect-it-and-stop-it-effectively/]
- 76. Minimizing errors in RT-PCR detection and quantification of ... [https://pmc.ncbi.nlm.nih.gov/articles/PMC8386095/]
- 77. Uracil-DNA glycosylase [https://en.wikipedia.org/wiki/Uracil-DNA_glycosylase]
- 78. Your Ultimate Guide to PCR Contamination Troubleshooting [https://www.clyte.tech/post/guide-to-pcr-contamination-troubleshooting?srsltid=AfmBOoqlxCZGTK-SXp0iHPHXgQ4wp_tyz84KV281oqMo0Qwz2c10_F3e]
- 79. Biological Safety Cabinet Fume Hood [https://labs-usa.com/laboratory-fume-hoods/biological-safety-cabinet-fume-hood/]
- 80. Trust your SYBR Green qPCR Data [https://www.thermofisher.com/blog/behindthebench/trust-your-sybr-green-qpcr-data/]
- 81. Explaining multiple peaks in qPCR melt curve analysis | IDT [https://www.idtdna.com/page/support-and-education/decoded-plus/interpreting-melt-curves-an-indicator-not-a-diagnosis/]
- 82. Why Does Your Melt Curve Look So Strange? - Yeasen [https://www.yeasenbio.com/blogs/molecular-biology/why-does-your-melt-curve-look-so-strange]
- 83. Tips for successful PCR and Troubleshooting PCR-qPCR [https://info.abmgood.com/polymerase-chain-reaction-pcr-qpcr-troubleshooting]
- 84. Development and validation of cost-effective one-step ... [https://www.nature.com/articles/s41598-022-10413-7]
- 85. From RNA to results: the essential guide to RT-PCR [https://www.integra-biosciences.com/united-states/en/blog/article/rna-results-essential-guide-rt-pcr]
- 86. Limit of Blank, Limit of Detection and Limit of Quantitation [https://pmc.ncbi.nlm.nih.gov/articles/PMC2556583/]
- 87. Optical Biosensors – Basic Concepts [https://www.pyroistech.com/optical-biosensors-basic-concepts-2/]
- 88. Determining LOD and LOQ Based on the Calibration Curve [https://www.sepscience.com/hplc-solutions-126-chromatographic-measurements-part-5-determining-lod-and-loq-based-on-the-calibration-curve-6959]
- 89. RT-PCR Optimization Strategies [https://www.caister.com/hsp/abstracts/pcr-troubleshooting/05.html]
- 90. Dynamic Ranges of Detection & Quantification - Gene Pi [https://www.gene-pi.com/item/dynamic-ranges-of-detection-and-quantification/]
- 91. Critical aspects of droplet digital reverse transcription loop ... [https://www.nature.com/articles/s41378-025-00982-8]
- 92. Analytical Sensitivity and Specificity of Two RT-qPCR ... [https://www.mdpi.com/2073-4425/11/10/1183]
- 93. Diagnostic accuracy of a set of clinical and radiological criteria ... [https://bmcpulmmed.biomedcentral.com/articles/10.1186/s12890-023-02369-9]
- 94. Evaluation of RT-PCR assays for detection of SARS-CoV-2 ... [https://www.nature.com/articles/s41598-023-28275-y]
- 95. The importance of reverse transcription efficiency ... [https://www.sciencedirect.com/science/article/pii/S2214753517302188]
- 96. LDT vs. IVD: Comparisons, misconceptions & FDA ... [https://www.labcorp.com/content/labcorp/us/en/education-events/articles/understanding-labcorps-laboratory-developed-tests-ldt-and-vitro-diagnostics-ivd.html]
- 97. IVD vs LDT - Which should you be using? | LabLeaders [https://diagnostics.roche.com/global/en/article-listing/lab-leaders/article/ivd-vs-ldt.html]
- 98. March 2025 Court Ruling on FDA Regulation of LDTs [https://www.streamlinesci.com/blog/understanding-the-march-2025-court-ruling-regarding-ldt-regulation-by-the-fda]
- 99. Optimizing PCR Reaction Conditions for High Fidelity and ... [https://www.labx.com/resources/optimizing-pcr-reaction-conditions-for-high-fidelity-and-yield/5579]
- 100. PCR Workflow Optimization: Mastering Liquid Handling ... [https://dispendix.com/blog/pcr-workflow-optimization-mastering-liquid-handling-techniques-how-automation-helps]
- 101. Implementing External Quality Control in PCR Workflows [https://www.mapi-research.fr/implementing-external-quality-control-in-pcr-workflows-a-step-by-step-laboratory-guide/]
- 102. MIQE 2.0 and the Urgent Need to Rethink qPCR Standards [https://pmc.ncbi.nlm.nih.gov/articles/PMC12154065/]
- 103. Real-Time PCR Basics Support—Troubleshooting [https://www.thermofisher.com/us/en/home/technical-resources/technical-reference-library/real-time-digital-PCR-applications-support-center/real-time-pcr-basics-support/real-time-pcr-basics-support-troubleshooting.html]
- 104. An overview of technical considerations when using ... [https://journals.plos.org/plosone/article?id=10.1371/journal.pone.0196438]
- 105. Minimizing errors in RT-PCR detection and quantification ... [https://www.sciencedirect.com/science/article/pii/S0048969721049524]
- 106. Maximizing Efficiency: Best Practices for Real-Time PCR in ... [https://www.brutnelllab.org/2025/08/25/maximizing-efficiency-best-practices-for-real-time-pcr-in-molecular-biology-labs/]
- 107. Data-driven normalization strategies for high-throughput ... [https://bmcbioinformatics.biomedcentral.com/articles/10.1186/1471-2105-10-110]
- 108. Normalization of Reverse Transcription Quantitative PCR ... [https://pmc.ncbi.nlm.nih.gov/articles/PMC5639144/]
- 109. Normalization Methods for the Analysis of Unbalanced ... [https://pmc.ncbi.nlm.nih.gov/articles/PMC6988798/]
- 110. A stable combination of non-stable genes outperforms ... [https://www.nature.com/articles/s41598-024-82651-w]
- 111. Evaluation of normalisation strategies for qPCR data ... [https://www.nature.com/articles/s41598-025-06657-8]
- 112. Normalization of Gene Expression by Quantitative RT-PCR ... [https://pmc.ncbi.nlm.nih.gov/articles/PMC6308757/]