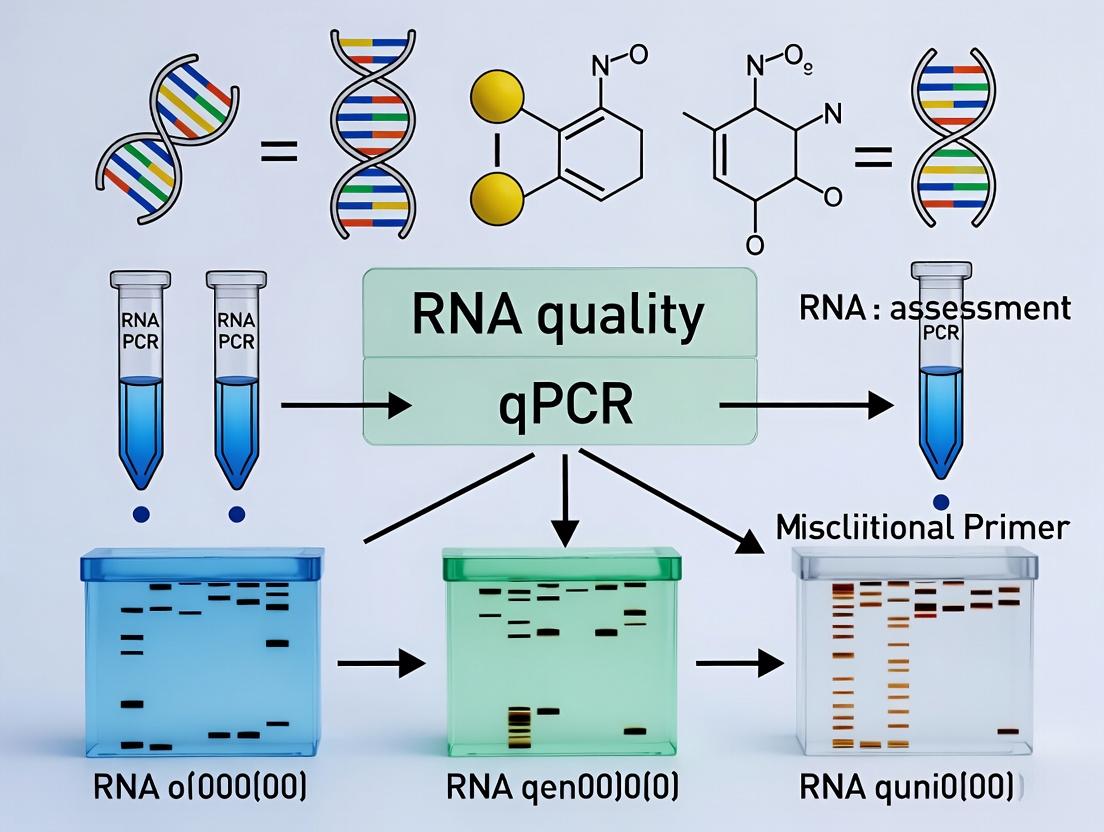
MIQE-Compliant RNA QC for qPCR: The Complete Guide to Accurate Gene Expression Analysis
Accurate quantitative PCR (qPCR) begins with high-quality RNA.
MIQE-Compliant RNA QC for qPCR: The Complete Guide to Accurate Gene Expression Analysis
Abstract
Accurate quantitative PCR (qPCR) begins with high-quality RNA. This comprehensive guide details the implementation of Minimum Information for Publication of Quantitative Real-Time PCR Experiments (MIQE) guidelines for rigorous RNA quality assessment. We cover foundational principles of RNA integrity metrics (RIN, DV200), methodological best practices for QC during extraction and storage, advanced troubleshooting for degraded or contaminated samples, and validation strategies to ensure data reliability. Targeted at researchers, scientists, and drug development professionals, this article provides actionable protocols to uphold reproducibility, meet publication standards, and enhance the translational value of gene expression data in biomedical and clinical research.
Why RNA Quality is Non-Negotiable: The MIQE Foundation for Reproducible qPCR
Application Notes: The Imperative for MIQE-Compliant qPCR in RNA Quality Assessment
Accurate quantification of gene expression via reverse transcription quantitative polymerase chain reaction (RT-qPCR) is fundamental to molecular biology, diagnostics, and drug development. However, a lack of standardized reporting has historically led to irreproducible and non-comparable data. The Minimum Information for Publication of Quantitative Real-Time PCR Experiments (MIQE) guidelines were established to rectify this. Within a thesis focused on MIQE-compliant RNA quality assessment, adherence to these guidelines ensures that qPCR data is technically sound, biologically relevant, and reproducible.
The core principle is that reliable gene expression quantification is contingent upon the quality of the starting RNA template. Therefore, RNA quality assessment is not a separate prelude but an integral, documented component of the MIQE framework. Key application points include:
- Pre-Analytical Phase Rigor: All steps from sample acquisition, stabilization, and RNA extraction must be documented (MIQE items: sample, nucleic acid extraction). The RNA integrity number (RIN) or equivalent is a critical MIQE parameter for assessing degradation.
- Assay Validation: Every qPCR assay must be validated for its specificity (e.g., via melt curve analysis or sequencing), amplification efficiency (from a standard curve), and linear dynamic range. This is non-negotiable for MIQE compliance.
- Normalization Strategy: MIQE mandates the use of multiple, validated reference genes for normalization to account for variations in input RNA quality and quantity. Normalization to a single gene or total RNA without validation is insufficient.
- Comprehensive Reporting: The ultimate goal is to provide all necessary information for an independent researcher to exactly replicate the experiment. This transparency is the bedrock of scientific rigor in qPCR research.
Experimental Protocols
Protocol 1: MIQE-Compliant Total RNA Extraction and Quality Assessment for qPCR
Objective: To isolate high-quality total RNA from mammalian cultured cells and perform a comprehensive MIQE-compliant quality assessment prior to cDNA synthesis.
Materials:
- Cell monolayer or pellet
- TRIzol Reagent or equivalent phenol-guanidine isothiocyanate solution
- Chloroform
- Isopropyl alcohol
- Nuclease-free 75% ethanol (in DEPC-treated water)
- Nuclease-free water
- DNase I, RNase-free
- Spectrophotometer (NanoDrop or equivalent)
- Bioanalyzer 2100 or Fragment Analyzer (Agilent) or similar capillary electrophoresis system
- RNase-free microcentrifuge tubes and pipette tips
Procedure:
A. RNA Extraction (Using TRIzol Method)
- Homogenize cells directly in culture dish by adding 1 mL TRIzol per 10 cm² area. Pipette to lyse.
- Transfer lysate to a nuclease-free microcentrifuge tube. Incubate for 5 minutes at room temperature.
- Add 0.2 mL chloroform per 1 mL TRIzol. Cap tube and shake vigorously for 15 seconds.
- Incubate at room temperature for 3 minutes.
- Centrifuge at 12,000 × g for 15 minutes at 4°C. The mixture separates into three phases.
- Transfer the upper, aqueous phase (containing RNA) to a new tube.
- Precipitate RNA by adding 0.5 mL isopropyl alcohol per 1 mL TRIzol used initially. Incubate at room temperature for 10 minutes.
- Centrifuge at 12,000 × g for 10 minutes at 4°C. The RNA forms a gel-like pellet.
- Remove supernatant. Wash pellet with 1 mL of 75% ethanol.
- Centrifuge at 7,500 × g for 5 minutes at 4°C. Discard supernatant.
- Air-dry pellet for 5-10 minutes. Do not over-dry.
- Dissolve RNA in 30-50 µL nuclease-free water.
B. DNase Treatment
- Add 1 µL of DNase I and 5 µL of 10x reaction buffer per 10 µg of RNA. Adjust volume with nuclease-free water.
- Incubate at 37°C for 20-30 minutes.
- Inactivate DNase by adding 1 µL of 50 mM EDTA and heating at 65°C for 10 minutes.
C. RNA Quality and Quantity Assessment (MIQE Critical Steps)
- Spectrophotometric Analysis:
- Dilute 1-2 µL RNA in nuclease-free water.
- Measure absorbance at 230 nm, 260 nm, and 280 nm.
- Record concentrations and purity ratios (A260/280 and A260/230). See Table 1.
- Capillary Electrophoresis:
- Follow manufacturer's protocol for the Bioanalyzer RNA 6000 Nano kit.
- Load 1 µL of RNA sample.
- The assay provides the RNA Integrity Number (RIN), an electrophoretogram, and a gel-like image. Record the RIN value.
Protocol 2: MIQE-Compliant Assay Validation for a qPCR Primer Set
Objective: To determine the amplification efficiency, linear dynamic range, and specificity of a qPCR primer pair.
Materials:
- High-quality, pooled cDNA sample (from Protocol 1)
- Forward and reverse primers (10 µM stock)
- SYBR Green I Master Mix (2x concentration)
- qPCR instrument (e.g., Applied Biosystems QuantStudio, Bio-Rad CFX)
- MicroAmp Optical 96-well reaction plate or equivalent
- Optical adhesive film
Procedure:
- Prepare a Serial Dilution of Template:
- Create a 5-point, 10-fold serial dilution of the pooled cDNA (e.g., undiluted, 1:10, 1:100, 1:1000, 1:10,000).
- Set Up qPCR Reactions:
- For each dilution, prepare a 20 µL reaction mix in triplicate:
- SYBR Green Master Mix (2x): 10 µL
- Forward Primer (10 µM): 0.8 µL
- Reverse Primer (10 µM): 0.8 µL
- cDNA template: variable volume for desired dilution
- Nuclease-free water: to 20 µL
- Include No-Template Controls (NTCs) in triplicate (water instead of cDNA).
- For each dilution, prepare a 20 µL reaction mix in triplicate:
- Run qPCR Program:
- Stage 1: Polymerase activation / Initial denaturation: 95°C for 2 min.
- Stage 2: 40 cycles of:
- Denaturation: 95°C for 15 sec.
- Annealing/Extension: 60°C for 1 min (acquire SYBR Green signal).
- Stage 3: Melt curve analysis: 60°C to 95°C, increment 0.5°C for 5 sec/step.
- Data Analysis for Validation:
- Standard Curve: Plot the mean quantification cycle (Cq) value for each dilution against the log of its dilution factor. The slope is used to calculate efficiency: Efficiency % = [10^(-1/slope) - 1] * 100.
- Specificity: Analyze the melt curve. A single, sharp peak indicates specific amplification. Multiple peaks suggest primer-dimer or non-specific products.
- Linear Dynamic Range: The range of dilutions over which the Cq values maintain a linear relationship (R² > 0.99) with the log input. See Table 2.
Data Presentation
Table 1: RNA Quality Assessment Metrics (MIQE Requirements)
| Assessment Method | Metric | Optimal Value (MIQE Guide) | Interpretation | Sample Result |
|---|---|---|---|---|
| Spectrophotometry | A260/280 Ratio | 1.8 - 2.0 | Indicates protein contamination if low. | 2.05 |
| Spectrophotometry | A260/230 Ratio | > 2.0 | Indicates salt/organic solvent contamination if low. | 2.15 |
| Spectrophotometry | Concentration (ng/µL) | Sample Dependent | Required for input normalization. | 245 ng/µL |
| Capillary Electrophoresis | RNA Integrity Number (RIN) | ≥ 7.0 for RT-qPCR* | Measures degradation (10= intact, 1=degraded). | 8.5 |
Table 2: qPCR Assay Validation Results (MIQE Requirements)
| Validation Parameter | MIQE Requirement | Experimental Result | Pass/Fail |
|---|---|---|---|
| Amplification Efficiency | 90% - 110% | 98.5% | Pass |
| Standard Curve Slope | -3.6 to -3.1 | -3.35 | Pass |
| Correlation Coefficient (R²) | > 0.99 | 0.999 | Pass |
| Linear Dynamic Range (Log10) | At least 3 orders of magnitude | 4 orders (undiluted to 1:10,000) | Pass |
| Melt Curve Peaks | Single, sharp peak | Single peak at Tm=78.5°C | Pass |
| No-Template Control (NTC) Cq | > 5 cycles above lowest sample Cq or undetected | Undetected (Cq = 0) | Pass |
Diagrams
MIQE-Compliant qPCR Workflow
qPCR Assay Validation Pathway
The Scientist's Toolkit: Research Reagent Solutions
| Reagent / Material | Function in MIQE-Compliant Workflow | Key Consideration |
|---|---|---|
| RNA Stabilization Reagent (e.g., RNAlater) | Immediately stabilizes and protects cellular RNA in fresh tissues/cells, halting degradation. Critical for reproducible pre-analytical phase. | Must be used according to tissue size/sample volume ratios. |
| Monophasic Lysis Reagent (e.g., TRIzol) | Simultaneously denatures proteins and RNases while isolating RNA, DNA, and proteins from a single sample. | Contains phenol; requires careful handling and proper waste disposal. |
| DNase I, RNase-free | Removes contaminating genomic DNA from RNA preparations prior to RT-qPCR. Essential for accurate gene expression quantification. | A dedicated on-column or in-solution digestion step must be included and documented. |
| SYBR Green I Master Mix | Contains all components (polymerase, dNTPs, buffer, dye) for qPCR. Simplifies setup and improves reproducibility. | Must be validated for efficiency. Use a master mix with a built-in passive reference dye (ROX) if required by instrument. |
| Reverse Transcriptase Kit (with Random Hexamers & Oligo-dT) | Synthesizes cDNA from RNA template. Using a mix of primers ensures representation of both mRNA and non-polyadenylated RNAs. | Document the kit, priming strategy, and reaction conditions as per MIQE. |
| Validated qPCR Primer Assays | Target-specific primers (and probes for probe-based assays) designed to span exon-exon junctions. Pre-validated assays save time. | Must still be re-validated in the user's own laboratory system (efficiency, specificity). |
| RNA Quality Assessment Kit (e.g., Bioanalyzer RNA Kit) | Provides automated, objective, and quantitative assessment of RNA integrity (RIN). A core MIQE requirement for RNA quality. | The platform (e.g., Bioanalyzer, Fragment Analyzer, TapeStation) and result (RIN, DV200, RQN) must be reported. |
| Nuclease-Free Water | Used for all reagent resuspension and reaction setups. Prevents sample degradation by environmental RNases. | A dedicated, certified source is mandatory for RNA work. |
The Direct Impact of RNA Integrity on qPCR Accuracy and Variability
Application Notes
High-quality, intact RNA is a fundamental prerequisite for accurate and reproducible quantitative PCR (qPCR) gene expression analysis. Within the framework of MIQE (Minimum Information for Publication of Quantitative Real-Time PCR Experiments) guidelines, RNA quality assessment is a critical pre-analytical step (QC1). Degraded RNA, characterized by fragmentation and chemical modifications, directly introduces bias, increases technical variability, and compromises biological interpretation.
Key Impacts of RNA Degradation:
- Quantification Bias: Degradation disproportionately affects longer transcripts. A target amplicon placed in a degraded region may fail to amplify or yield a significantly reduced Cq value compared to an amplicon in a preserved region, skewing expression ratios.
- Increased Variability: Non-uniform degradation across samples leads to high inter-sample Cq variance, reducing statistical power and obscuring true biological differences.
- Altered Normalization: The utility of classic reference genes (e.g., GAPDH, ACTB) is compromised if their transcripts degrade at rates different from target genes, leading to erroneous normalization.
Quantitative Data Summary:
Table 1: Correlation of RNA Integrity Number (RIN) with qPCR Outcomes
| RIN Value Range | Typical RNA State | Impact on ΔCq (Target vs. Reference)* | Expected Increase in Inter-Replicate Cq Variance | Suitability for qPCR |
|---|---|---|---|---|
| 9-10 | Intact | Minimal (Baseline) | < 0.3 | Excellent |
| 7-8 | Slightly Degraded | Moderate (0.5 - 1.5) | 0.3 - 0.8 | Acceptable with caution |
| 5-6 | Degraded | Significant (1.5 - 3.0+) | 0.8 - 2.0+ | Poor; requires re-isolation |
| <5 | Highly Degraded | Severe/Unpredictable | > 2.0 | Unacceptable |
*ΔCq shift is target-dependent and related to amplicon position.
Table 2: Recommended QC Thresholds for MIQE-Compliant Studies
| QC Parameter | Method | Recommended Threshold | Purpose |
|---|---|---|---|
| RNA Integrity | RIN (Bioanalyzer) | ≥ 7.0 for most studies | Assesses fragmentation. Lower thresholds may be justified for FFPE. |
| RNA Purity | A260/A280 Ratio | 1.8 - 2.1 | Detects protein/phenol contamination. |
| RNA Purity | A260/A230 Ratio | ≥ 2.0 | Detects chaotropic salt/carbohydrate contamination. |
| RNA Quantity | Fluorometry | As required for input | Ensures sufficient, accurate input mass. |
Experimental Protocols
Protocol 1: Comprehensive RNA Quality Assessment for qPCR Workflow
Objective: To assess RNA integrity, purity, and quantity prior to cDNA synthesis to ensure MIQE compliance and qPCR data reliability.
Materials (Research Reagent Solutions Toolkit):
- Agilent RNA 6000 Nano Kit: Provides reagents and chips for microfluidic capillary electrophoresis to generate an RNA Integrity Number (RIN).
- Qubit RNA HS Assay Kit: Fluorometric quantification specific for RNA, unaffected by contaminants.
- NanoDrop One/OneC: UV-Vis spectrophotometer for rapid assessment of purity (A260/A280, A260/A230).
- RNase-free Water: For dilutions to prevent degradation.
- RNaseZAP or equivalent: To decontaminate work surfaces and equipment.
Procedure:
- Decontaminate work area and equipment with RNaseZAP.
- Spectrophotometric Purity Check: Using 1-2 µL of RNA sample, measure A260/A280 and A260/A230 ratios. Record values. (Note: This step is insufficient alone for integrity assessment).
- Fluorometric Quantification: Dilute 2 µL of RNA in Qubit working solution. Measure concentration using the Qubit fluorometer. This value determines reverse transcription input.
- Integrity Analysis (Bioanalyzer): a. Prepare an RNA Nano chip according to kit instructions. b. Load 1 µL of RNA sample (recommended concentration ~50 ng/µL). c. Run the chip on the Agilent Bioanalyzer 2100. d. Analyze the electropherogram and record the RIN (or equivalent metric like RQN for TapeStation).
- Decision Point: Proceed to cDNA synthesis only if samples meet all pre-defined thresholds (e.g., RIN ≥ 7.0, A260/A280 ~2.0).
Protocol 2: Amplicon-Length-Dependent qPCR Assay to Detect Degradation Bias
Objective: To empirically test the impact of RNA integrity on qPCR accuracy by designing target assays with varying amplicon lengths.
Materials:
- High-Capacity cDNA Reverse Transcription Kit: Includes random hexamers and MultiScribe RT for robust cDNA synthesis from intact and degraded samples.
- TaqMan Gene Expression Master Mix or equivalent SYBR Green Master Mix: For qPCR amplification.
- Primer/Probe Sets: Designed for the same target gene exon-exon junction, but generating amplicons of different lengths (e.g., 70 bp, 150 bp, 300 bp).
- qPCR Instrument: e.g., Applied Biosystems QuantStudio, Bio-Rad CFX.
Procedure:
- Sample Preparation: Select RNA samples spanning a range of RIN values (e.g., 10, 8, 6, 4).
- cDNA Synthesis: Convert 500 ng (as quantified by Qubit) of each RNA sample to cDNA using the reverse transcription kit in a 20 µL reaction. Include a no-reverse transcriptase (-RT) control.
- qPCR Setup: Dilute cDNA 1:10. Perform triplicate qPCR reactions for each target amplicon (short, medium, long) across all cDNA samples. Use a uniform 2 µL cDNA input per 20 µL reaction.
- Data Analysis: Calculate the mean Cq for each amplicon/target. For a given RNA sample, plot the Cq value against the amplicon length. Intact RNA (RIN 10) will show minimal Cq difference. Degraded RNA will show a strong positive correlation between Cq and amplicon length, visually demonstrating the bias.
Mandatory Visualizations
Title: RNA Quality Control Workflow for qPCR
Title: Impact of RNA Degradation on Amplicon Detection
In MIQE-compliant qPCR research, accurate and reliable gene expression quantification is fundamentally dependent on the quality of the input RNA. Systematic assessment using standardized metrics is mandatory to ensure experimental integrity, reproducibility, and meaningful data interpretation. This Application Note details four principal RNA quality metrics—RIN, RQN, DV200, and 28S/18S ratios—within the framework of MIQE guidelines, providing protocols for their determination and application in preclinical and clinical research.
Key RNA Quality Metrics: Definitions and Interpretation
RNA Integrity Number (RIN)
The RIN algorithm, developed for the Agilent Bioanalyzer system, assigns an integrity score from 1 (completely degraded) to 10 (perfectly intact). It evaluates the entire electrophoretic trace of eukaryotic total RNA, including the presence of 18S and 28S ribosomal RNA (rRNA) peaks and the region between them.
RNA Quality Number (RQN)
The RQN is the equivalent metric generated by the Fragment Analyzer or TapeStation systems (Agilent). It similarly scores RNA integrity from 1 to 10 but uses a proprietary algorithm. While RIN and RQN are highly correlated, they are not directly interchangeable.
DV200
The DV200 represents the percentage of RNA fragments larger than 200 nucleotides. This metric is particularly crucial for assessing RNA suitability for next-generation sequencing (NGS) applications, especially from formalin-fixed paraffin-embedded (FFPE) or other challenging samples where ribosomal peaks may be absent.
28S/18S Ratio
This traditional metric compares the peak areas of the 28S and 18S ribosomal RNA subunits. In a perfect mammalian RNA sample, this ratio is approximately 2.0. Deviations indicate degradation, as the 28S rRNA is more susceptible to breakdown.
Table 1: Comparison of Key RNA Quality Assessment Metrics
| Metric | Instrument Platform | Range | Ideal Value | Primary Use Case | Key Limitation |
|---|---|---|---|---|---|
| RIN | Agilent Bioanalyzer | 1 (degraded) to 10 (intact) | ≥ 8.0 for most applications | Standard total RNA QC from fresh/frozen sources. | Less reliable for FFPE or non-eukaryotic RNA. |
| RQN | Agilent Fragment Analyzer/TapeStation | 1 (degraded) to 10 (intact) | ≥ 8.0 for most applications | Standard total RNA QC; higher-throughput option. | Algorithm differs from RIN; scores not directly equivalent. |
| DV200 | Bioanalyzer, Fragment Analyzer, TapeStation | 0% to 100% | ≥ 70% for RNA-Seq; ≥ 30% for FFPE | Critical for NGS library prep, esp. from degraded samples. | Does not assess intactness of ribosomal peaks. |
| 28S/18S Ratio | Bioanalyzer, Fragment Analyzer, TapeStation, Gel | 0 to >2.5 | ~2.0 (mammalian) | Historical standard; quick visual assessment. | Misleading if degradation is non-uniform or in non-eukaryotes. |
Protocols for RNA Quality Assessment
Protocol 1: RNA Quality Analysis using Agilent Bioanalyzer (RIN & DV200)
Objective: To assess RNA integrity and calculate RIN and DV200 values using the Agilent 2100 Bioanalyzer system with the RNA Nano or Pico Kit.
Materials (Research Reagent Solutions):
- Agilent RNA Nano Kit or RNA Pico Kit: Contains gel matrix, dye concentrate, RNA Nano/Pico chip, and ladder.
- RNaseZap or equivalent: To decontaminate workspace and equipment.
- Nuclease-free water: For sample dilution.
- Thermal cycler or heat block: Set to 72°C.
- Vortexer and centrifuge: For mixing and spinning down reagents.
- Agilent 2100 Bioanalyzer Instrument.
Procedure:
- Chip Priming: Load the gel-dye mix into the appropriate well on a primed chip according to the kit manual.
- Sample Preparation: Dilute the RNA ladder and samples in nuclease-free water. Heat denature at 72°C for 2 minutes, then immediately place on ice.
- Chip Loading: Load 1 µL of ladder into the designated well. Load 1 µL of each prepared sample into separate sample wells.
- Chip Run: Place the chip in the Bioanalyzer and start the run using the appropriate assay (e.g., Eukaryote Total RNA Nano).
- Data Analysis: The Bioanalyzer software automatically generates the electrophoretogram, calculates the RIN based on the entire trace, and reports the DV200 value.
Protocol 2: Determining the 28S/18S Ratio from Electropherogram Data
Objective: To manually calculate the 28S/18S ratio from data generated by capillary electrophoresis systems.
Procedure:
- Run the RNA sample following Protocol 1 or its equivalent on a Fragment Analyzer/TapeStation.
- In the analysis software, ensure the baselines for the 18S and 28S rRNA peaks are correctly set.
- Record the peak area (not height) for the 18S and 28S rRNA species.
- Calculate the ratio using the formula: 28S/18S Ratio = (Area of 28S Peak) / (Area of 18S Peak)
- Interpret: A ratio near 2.0 indicates high-quality mammalian RNA. A lowering ratio suggests degradation.
Protocol 3: MIQE-Compliant Integration of RNA QC into qPCR Workflow
Objective: To formally document RNA quality metrics as required by the MIQE guidelines when performing qPCR experiments.
Procedure:
- Assessment: Determine and record the RIN (or RQN) and the DV200 value for every RNA sample used for cDNA synthesis.
- Thresholding: Apply pre-defined quality thresholds (e.g., RIN ≥ 7.0, DV200 ≥ 50%) for inclusion in the study. Justify thresholds in the methods section.
- Reporting: In the manuscript's methods section, explicitly state:
- The instrument and kit used for QC.
- The mean/median and range of the integrity metric (RIN/RQN) for each sample group.
- The DV200 value if working with degraded samples or for NGS.
- The software and algorithm version used (e.g., Bioanalyzer 2100 Expert software, RIN algorithm).
- Correlation (Optional but Recommended): For critical assays, correlate RNA integrity metrics with qPCR outcomes, such as
Cqvalues of reference genes or the yield of cDNA synthesis.
Title: Workflow for MIQE-Compliant RNA Quality Assessment in qPCR
The Scientist's Toolkit: Essential Reagents for RNA QC
Table 2: Key Research Reagent Solutions for RNA Quality Assessment
| Item | Function & Importance in RNA QC |
|---|---|
| Agilent Bioanalyzer RNA Kits (Nano/Pico) | Provide all consumables (chips, gel, dye, ladder) for microfluidic capillary electrophoresis to generate RIN and DV200 data. |
| Agilent Fragment Analyzer/TapeStation Kits | Higher-throughput consumables for capillary electrophoresis, generating RQN and DV200 metrics. |
| RNase Decontamination Solution (e.g., RNaseZap) | Critical for eliminating ubiquitous RNases from work surfaces, pipettes, and equipment to prevent sample degradation. |
| Nuclease-Free Water | Used for diluting RNA samples and ladder; ensures no enzymatic degradation occurs during preparation. |
| RNA Integrity Standard/Ladder | Provides a reference peak pattern for the software to align samples and calculate integrity scores accurately. |
| Fluorescent RNA Binding Dye | Intercalates with RNA for detection during electrophoresis; a key component of the assay kits. |
Within the framework of MIQE (Minimum Information for Publication of Quantitative Real-Time PCR Experiments)-compliant research, the assessment of RNA integrity is a critical pre-analytical variable. The accuracy of any downstream application, including qPCR, RNA-Seq, and microarray analysis, is fundamentally dependent on the quality of the input RNA. Degradation can occur at every stage from sample acquisition to cDNA synthesis, introducing bias and compromising data reproducibility. This Application Note details the primary sources of RNA degradation and provides robust, actionable protocols to mitigate these risks, ensuring data reliability for research and drug development.
RNA degradation is catalyzed by ubiquitous and robust ribonucleases (RNases). The following table summarizes the primary sources, vectors, and typical impact metrics.
Table 1: Primary Sources of RNA Degradation and Their Impact
| Process Stage | Major Source/Vector | Key Degradative Agent | Typical Impact (if uncontrolled) | MIQE-Relevant QC Metric |
|---|---|---|---|---|
| Cell/Tissue Collection | Delayed stabilization, ischemia | Endogenous RNases (e.g., RNase A family) | RIN/RNA Quality Number (RQN) drop of 2-3 units within minutes. | RIN/RQN, DV200 |
| Cell Lysis & Homogenization | Physical shear, heat generation | Released endogenous RNases | Fragmentation; reduced yield. Visual smear on bioanalyzer. | Electropherogram profile |
| RNA Isolation | Contaminated surfaces/reagents | Environmental RNases (e.g., RNase B, RNase C) | Inconsistent yields; poor reproducibility between samples. | A260/A280, A260/A230 |
| RNA Storage | Improper temperature, repeated freeze-thaw | Residual RNase activity, hydrolysis | Gradual fragmentation over time. | RIN/RQN comparison pre/post storage |
| cDNA Synthesis | Suboptimal reaction conditions, contaminants | RNase H activity of reverse transcriptase, chemical hydrolysis | Truncated cDNA, 3' bias in amplification. | qPCR amplification efficiency, Cq values for long vs. short amplicons |
Detailed Protocols for RNA Integrity Preservation
Protocol 1: Rapid Tissue Stabilization and Lysis for High-Quality RNA
Objective: To immediately inactivate endogenous RNases during sample collection.
Materials:
- Fresh tissue sample (< 100 mg)
- RNA stabilization reagent (e.g., RNAlater)
- Pre-chilled (liquid N2) mortar and pestle or a bead mill homogenizer
- Lysis buffer containing a strong denaturant (e.g., guanidinium thiocyanate)
- β-Mercaptoethanol (if using TRIzol-like reagents)
- Nuclease-free tubes and pipette tips
Procedure:
- Dissection & Stabilization: Excise tissue rapidly. For RNAlater, submerge tissue completely in ≥10 volumes of reagent immediately. Incubate at 4°C overnight for penetration, then store at -80°C.
- Homogenization: For stabilized tissue, mince and transfer to a tube with lysis buffer. For fresh tissue, flash-freeze in liquid N2 and immediately grind to a fine powder. Transfer powder to lysis buffer.
- Immediate Inactivation: Ensure the tissue is fully submerged and homogenized in the denaturing lysis buffer within minutes. Use a bead homogenizer for 1-2 minutes at 4°C.
- Proceed directly to RNA purification. Do not allow lysates to sit at room temperature.
Protocol 2: DNase I Treatment and RNA Clean-up (Column-Based)
Objective: To remove genomic DNA contamination without introducing RNase-mediated degradation.
Materials:
- RNA eluate (in nuclease-free water or TE buffer)
- DNase I, RNase-free
- 10X DNase I Reaction Buffer (with Mg2+)
- RNA clean-up/concentration kit (silica-membrane columns)
- Nuclease-free water (pre-heated to 55°C for elution)
Procedure:
- Set Up Reaction: In a nuclease-free tube, combine:
- RNA sample (up to 8 µg): X µL
- 10X DNase I Buffer: 10 µL
- RNase-free DNase I (1 U/µL): 5 µL
- Nuclease-free H2O: to 100 µL final volume.
- Incubate: Mix gently and incubate at 37°C for 20-30 minutes.
- Stop & Clean-up: Add 350 µL of the provided binding buffer from the clean-up kit to the reaction. Mix thoroughly.
- Column Purification: Apply the mixture to the column. Centrifuge, wash with wash buffers as per kit instructions.
- Elution: Elute RNA in 30-50 µL of pre-heated (55°C) nuclease-free water. Store at -80°C.
Protocol 3: Assessment of RNA Integrity via Fragment Analyzer/Bioanalyzer
Objective: To obtain RIN/RQN and electropherogram data as required by MIQE guidelines.
Materials:
- RNA sample (≥ 5 ng/µL)
- RNA Sensitivity Kit (e.g., Fragment Analyzer, Agilent Bioanalyzer RNA Nano)
- Nuclease-free tubes and strips
- Heat block set to 70°C
Procedure:
- Preparation: Thaw RNA samples and all kit reagents on ice. Prepare the gel-dye mix as per kit instructions.
- Priming: Load the gel-dye mix into the appropriate well. Prime the chip or cartridge as specified.
- Sample Denaturation: For each sample, mix 1 µL of RNA with ladder or dye. Denature at 70°C for 2 minutes, then immediately chill on ice.
- Loading: Load the denatured samples and ladder into designated wells.
- Run & Analysis: Insert the chip/cartridge into the instrument and run the appropriate program. Software will generate an electropherogram, calculate RIN/RQN, and provide concentration.
Protocol 4: Reverse Transcription with RNase H– Minimization
Objective: To synthesize high-fidelity, full-length cDNA while minimizing RNase H–mediated RNA degradation.
Materials:
- High-quality, intact RNA (100 pg – 1 µg)
- Reverse Transcriptase with low/absent RNase H activity (e.g., Moloney Murine Leukemia Virus (M-MLV) RNase H– point mutant)
- Anchored Oligo(dT) primers and/or random hexamers
- dNTP mix (10 mM each)
- RNase inhibitor (recombinant)
- 5X First-Strand Buffer
- Nuclease-free water
Procedure:
- Primer-Annealing Mix: In a nuclease-free tube, combine RNA, primer(s) (50 ng random hexamers OR 50 pmol oligo(dT)), and dNTPs (0.5 mM final). Add nuclease-free water to 15 µL.
- Denature & Anneal: Heat mixture to 65°C for 5 minutes, then immediately place on ice for 2 minutes.
- Master Mix: Prepare on ice: 4 µL of 5X RT buffer, 1 µL RNase inhibitor (40 U), and 1 µL reverse transcriptase (200 U).
- Combine & Incubate: Add the 6 µL master mix to the primer-annealing mix. Mix gently.
- For random hexamers: Incubate at 25°C for 10 min (primer extension), then 50°C for 50 min.
- For oligo(dT): Incubate at 50°C for 50 min.
- Enzyme Inactivation: Heat to 85°C for 5 minutes. cDNA can be stored at -20°C or used directly in qPCR.
Visualizations
Diagram 1: RNA Degradation Pathways from Sample to cDNA
Diagram 2: MIQE-Compliant RNA QC Workflow
The Scientist's Toolkit: Research Reagent Solutions
Table 2: Essential Reagents for RNA Integrity Preservation
| Item | Function & Rationale | Example Product Types |
|---|---|---|
| RNase Inactivation Reagents | Immediate chemical denaturation of RNases upon cell lysis. | Guanidinium thiocyanate (TRIzol, QIAzol), Phenol-chloroform mixtures. |
| RNase Inhibitors | Protein-based inhibitors that bind to and inactivate common RNases during enzymatic reactions. | Recombinant RNase Inhibitor (e.g., from E. coli Rnc- strain), Human Placental RNase Inhibitor. |
| RNase-Free DNase I | Removes genomic DNA contamination without degrading the RNA template, critical for accurate qPCR. | Recombinant DNase I (RNase-free), Turbo DNase. |
| RNase H– Reverse Transcriptase | Engineered RT enzymes lacking RNase H activity prevent degradation of the RNA template during cDNA synthesis, reducing 3' bias. | M-MLV RNase H–, SuperScript IV, PrimeScript RTase. |
| Nucleic Acid Binding Beads/Columns | Silica-membrane technology for rapid purification and concentration of RNA, removing salts, proteins, and other contaminants. | RNA Clean & Concentrator kits, MinElute columns, SPRI beads. |
| RNA Integrity Assessment Kits | Microfluidics-based analysis for quantitative assessment of RNA degradation (RIN/RQN) as per MIQE guidelines. | Agilent RNA 6000 Nano Kit, Fragment Analyzer RNA Kit. |
| Nuclease-Free Consumables | Certified tubes, tips, and plasticware to prevent introduction of environmental RNases. | PCR tubes, barrier tips, microcentrifuge tubes (DEPC-treated or manufactured nuclease-free). |
Establishing Baseline QC Acceptance Criteria for Your Research Application
The reproducibility crisis in biomedical research underscores the necessity for stringent Quality Control (QC) measures. For research utilizing quantitative PCR (qPCR) to assess RNA, adherence to the MIQE (Minimum Information for Publication of Quantitative Real-Time PCR Experiments) guidelines is paramount. This Application Note provides a structured framework for establishing baseline QC acceptance criteria, ensuring data integrity from sample acquisition to final Cq value, specifically within the context of MIQE-compliant RNA quality assessment.
Foundational QC Parameters & Acceptance Criteria
The first critical step is defining acceptable thresholds for RNA sample quality. The following table summarizes consensus criteria based on current literature and best practices for gene expression studies.
Table 1: Baseline QC Acceptance Criteria for RNA Samples in qPCR Research
| QC Parameter | Measurement Method | Ideal Acceptance Criteria | Minimum Acceptable Threshold | Rationale & MIQE Relevance |
|---|---|---|---|---|
| RNA Integrity | RNA Integrity Number (RIN) or RIN-equivalent (e.g., RQN, DV200) | RIN ≥ 9.0 | RIN ≥ 7.0 for most tissues; ≥ 6.5 for challenging samples (e.g., FFPE). | MIQE item #5 (sample QC). Degraded RNA (RIN<7) causes 3’ bias and inaccurate quantification. |
| RNA Purity | Spectrophotometric A260/A280 and A260/A230 ratios | A260/A280 ≈ 2.0; A260/A230 ≥ 2.0 | 1.8 ≤ A260/A280 ≤ 2.2; A260/A230 ≥ 1.8 | MIQE item #5. Indicates absence of contaminants (proteins, phenol, guanidine salts). |
| RNA Concentration | Fluorometric assay (preferred) or spectrophotometry | Assay-dependent | Sufficient for required input into cDNA synthesis without over-dilution. | MIQE item #6 (amount of RNA analyzed). Fluorometry is more accurate for low-concentration samples. |
| Genomic DNA Contamination | No-RT control qPCR assay (intergenic region) | Cq (No-RT) ≥ 5 cycles greater than +RT sample, or undetectable. | Cq (No-RT) must be ≥ 3 cycles greater than +RT. | MIQE item #11 (gDNA assessment). Critical for accurate mRNA quantification. |
| Reverse Transcription Efficiency | qPCR of a non-regulated, high-abundance transcript across a serial dilution of input RNA | Efficiency = 90–110% (slope ≈ -3.1 to -3.6) | Efficiency within 80–120% range for assay validation. | MIQE item #14 (PCR efficiency). Low RT efficiency introduces quantification bias. |
Core Experimental Protocols
Protocol 1: Comprehensive RNA QC Workflow Prior to qPCR
Objective: To assess RNA quantity, purity, integrity, and the absence of gDNA contamination.
- Quantification & Purity: Dilute RNA 1:50 in nuclease-free water. Measure absorbance at 230nm, 260nm, and 280nm using a microvolume spectrophotometer. Calculate A260/A280 and A260/A230 ratios.
- Fluorometric Quantification (Recommended): Using a fluorescent nucleic acid stain, prepare RNA standards per manufacturer's protocol. Dilute sample RNA and measure fluorescence. Calculate concentration from the standard curve. This method is more accurate for low-concentration samples.
- Integrity Analysis: Using a capillary electrophoresis system (e.g., Bioanalyzer, TapeStation), load 1 µL of RNA (≥ 50 ng/µL). Run the appropriate RNA integrity assay. Record the RIN, RQN, or DV200 value.
- gDNA Contamination Check (qPCR): For each RNA sample, set up a no-reverse transcription (No-RT) control reaction.
- Use 10–100 ng of total RNA as template.
- Use a primer set that spans a large intron or targets an intergenic genomic region.
- Compare the Cq value from the No-RT reaction to the Cq from a cDNA reaction (+RT). A difference of less than 5 cycles indicates significant gDNA contamination, necessitating DNase I treatment.
Protocol 2: Establishing RT-qPCR Assay Performance Criteria
Objective: To validate the efficiency, specificity, and dynamic range of each qPCR assay prior to experimental use.
- cDNA Synthesis: For a pool of representative RNA samples, perform reverse transcription using a fixed amount of RNA (e.g., 1 µg) and a well-defined protocol (enzyme, priming method—oligo(dT), random hexamers, or both—and buffer conditions). Document precisely (MIQE items #9, #10).
- Standard Curve for Efficiency: Create a 5-point, 1:5 serial dilution of the cDNA pool (e.g., undiluted to 1:625). Run each dilution in triplicate with the target gene assay and a reference gene assay.
- Data Analysis: Plot Cq values against the log10 of the dilution factor. Perform linear regression. The slope is used to calculate PCR efficiency: Efficiency % = (10(-1/slope) - 1) × 100. Acceptable efficiency is 90–110%.
- Specificity Assessment: Analyze the melt curve for a single, sharp peak. Optionally, run the final qPCR product on an agarose gel to confirm a single band of the expected size, or use probe-based chemistry.
Visualization of Workflows
Title: RNA Sample QC & Assay Validation Workflow
Title: Essential MIQE QC Reporting Elements
The Scientist's Toolkit
Table 2: Essential Research Reagent Solutions for RNA QC & qPCR
| Item | Function & Importance in QC |
|---|---|
| Fluorometric RNA Quantitation Kit (e.g., Qubit RNA HS/BR Assay) | Provides highly accurate RNA concentration measurements using RNA-specific dyes, superior to A260 for complex samples. Critical for MIQE-compliant reporting of input RNA mass. |
| Capillary Electrophoresis System (e.g., Agilent Bioanalyzer, Agilent TapeStation) | The gold standard for assessing RNA Integrity Number (RIN) or equivalent. Objectively evaluates degradation, essential for sample inclusion/exclusion decisions. |
| DNase I, RNase-free | Enzyme used to remove contaminating genomic DNA from RNA preparations prior to cDNA synthesis. Mandatory for accurate mRNA quantification unless demonstrated otherwise by No-RT controls. |
| Reverse Transcriptase with Defined Buffer System (e.g., MultiScribe, SuperScript IV) | High-efficiency, consistent enzyme for cDNA synthesis. The specific kit and priming method (oligo(dT), random hexamers) must be documented (MIQE #9). |
| qPCR Master Mix (Probe-based or intercalating dye) | Optimized buffer containing polymerase, dNTPs, and dye/chemistry. Choice affects sensitivity, specificity, and required validation data (MIQE #12, #13). |
| Validated & Sequence-Verified qPCR Assays | Primers and/or probes with published validation data (efficiency, specificity) for the target organism. Using assays with known performance metrics reduces validation workload. |
| Nuclease-Free Water | Certified water free of RNases, DNases, and PCR inhibitors. Used for all dilutions to prevent sample degradation and assay interference. |
Step-by-Step Protocol: Implementing MIQE-Compliant RNA QC in Your Workflow
Best Practices for RNA Extraction and Immediate Quality Assessment
Within the framework of MIQE (Minimum Information for Publication of Quantitative Real-Time PCR Experiments)-compliant research, the integrity of RNA at the point of extraction is the foundational determinant of reliable downstream qPCR results. This protocol outlines best practices for high-quality RNA extraction and immediate, pre-analytical quality assessment, critical for gene expression studies in drug development and basic research.
Part 1: RNA Extraction Best Practices
Key Principles
Successful RNA extraction hinges on effective cell lysis, immediate inhibition of RNases, separation of RNA from DNA and protein, and purification. The choice of method depends on sample type (tissues, cells, biofluids), required throughput, and downstream application.
Detailed Protocol: Guanidinium Thiocyanate-Phenol-Chloroform Extraction (Single-Phase Solution)
This manual method is considered a gold standard for yield and purity from complex samples.
Materials & Reagent Solutions:
- TRIzol or equivalent mono-phasic reagent: Contains guanidinium isothiocyanate (chaotropic salt), phenol, and a solubilizing agent. Guanidinium denatures proteins and RNases, while phenol facilitates liquid-phase separation.
- Chloroform: Organic solvent for phase separation.
- Isopropanol: For RNA precipitation.
- 75% Ethanol (in nuclease-free water): For washing RNA pellets.
- RNase-free glycogen or linear acrylamide (optional): Carrier to improve precipitation yield from low-concentration samples.
- Nuclease-free water: For resuspending the purified RNA pellet.
Procedure:
- Homogenization: Homogenize tissue or cells in TRIzol reagent (e.g., 1 ml per 50-100 mg tissue). Use a mechanical homogenizer. For cells, lyse directly in culture dish.
- Phase Separation: Incubate 5 min at room temperature (RT). Add 0.2 ml chloroform per 1 ml TRIzol. Cap tightly, shake vigorously for 15 sec, incubate 2-3 min at RT.
- Centrifugation: Centrifuge at 12,000 × g for 15 min at 4°C. The mixture separates into three phases: a red organic phase (phenol-chloroform), interphase (DNA), and a colorless upper aqueous phase (RNA).
- RNA Precipitation: Transfer the aqueous phase to a new tube. Add 0.5 ml isopropanol per 1 ml initial TRIzol. Mix and incubate at RT for 10 min.
- Pellet RNA: Centrifuge at 12,000 × g for 10 min at 4°C. The RNA forms a gel-like pellet on the side/bottom of the tube.
- Wash: Remove supernatant. Wash pellet with 1 ml 75% ethanol. Vortex briefly. Centrifuge at 7,500 × g for 5 min at 4°C.
- Resuspension: Air-dry pellet for 5-10 min (do not over-dry). Dissolve RNA in 20-50 µl nuclease-free water. Incubate at 55-60°C for 10-15 min to aid dissolution.
The Scientist's Toolkit: Essential Reagents for RNA Work
| Reagent / Solution | Primary Function |
|---|---|
| Monophasic Lysis Reagent (e.g., TRIzol) | Simultaneously lyses cells, denatures proteins/RNases, and maintains RNA integrity during homogenization. |
| RNase Inhibitors | Enzymes that bind and inhibit common RNases, crucial for RT and long-term storage. |
| DNase I (RNase-free) | Digests genomic DNA contamination during or after purification, essential for qPCR specificity. |
| Nuclease-Free Water | Solvent free of nucleases for resuspending RNA and preparing reagents. |
| RNA Storage Buffer | Stabilizes purified RNA, often containing chelating agents and buffer salts at low pH. |
| Ethanol (75%, nuclease-free) | Removes salts and residual organic solvents from the RNA pellet without dissolving RNA. |
| RNA Integrity Number (RIN) Standards | Defined RNA markers used to calibrate and validate bioanalyzer or tape station systems. |
Part 2: Immediate Post-Extraction Quality Assessment
MIQE guidelines mandate RNA quality assessment prior to cDNA synthesis. This dual assessment of purity and integrity must be performed immediately after extraction to guide sample usability.
Protocol 1: Spectrophotometric Analysis for Purity and Concentration
Method: UV absorbance measurement using NanoDrop or similar. Procedure:
- Blank the instrument with nuclease-free water.
- Apply 1-2 µl of RNA sample to the pedestal.
- Measure absorbance at 230nm, 260nm, and 280nm.
- Record concentration (ng/µl) based on A260 and purity ratios (A260/280 and A260/230).
Protocol 2: Microfluidic Electrophoresis for Integrity Assessment
Method: Use of Agilent Bioanalyzer RNA Nano Kit or TapeStation. Procedure:
- Prepare an RNA ladder and samples according to kit instructions (heat at 70°C for 2 min with dye).
- Load ladder and samples into specified wells of the RNA Nano chip.
- Run the assay on the Bioanalyzer 2100 instrument.
- Analyze electropherograms and gel-like images to determine RNA Integrity Number (RIN) or DVR (TapeStation).
Table 1: Acceptable RNA Quality Metrics for MIQE-Compliant qPCR (Typical Benchmarks).
| Assessment Method | Metric | Optimal Value | Acceptable Range | Interpretation |
|---|---|---|---|---|
| Spectrophotometry | A260/280 Ratio | ~2.1 | 1.8 - 2.2 | Ratios <1.8 indicate protein/phenol contamination. |
| A260/230 Ratio | ~2.2 | 2.0 - 2.5 | Ratios <2.0 indicate guanidine or carbohydrate contamination. | |
| Concentration | N/A | >50 ng/µl for most apps | Varies by sample. Use fluorometry for low conc. | |
| Microfluidics | RNA Integrity Number (RIN) | 10 (Intact) | ≥ 8 for sensitive qPCR | Scores 1-10. <7 indicates significant degradation. |
| DVR (TapeStation) | 10 (Intact) | ≥ 8 for sensitive qPCR | Equivalent to RIN. | |
| 28S/18S rRNA Ratio | 2.0 | ≥ 1.8 | Lower ratios suggest degradation (species-dependent). |
Part 3: Integrated Workflow for Extraction and Assessment
A streamlined, contamination-aware workflow is essential.
Diagram 1: RNA Extraction and Immediate QC Workflow.
Diagram 2: From QC'd RNA to MIQE-Compliant qPCR Data.
Adherence to these protocols for RNA extraction and immediate, rigorous quality assessment generates a reliable sample inventory. This is the non-negotiable first step in a MIQE-compliant workflow, ensuring the validity of qPCR data in thesis research, biomarker discovery, and preclinical drug development. Documenting all QC metrics (concentration, purity ratios, and RIN) is mandatory for publication and scientific rigor.
Within the context of MIQE (Minimum Information for Publication of Quantitative Real-Time PCR Experiments)-compliant research, accurate RNA quality and quantity assessment is a fundamental prerequisite. The selection of appropriate instrumentation for nucleic acid analysis directly impacts the reliability of downstream qPCR results. This application note provides a comparative overview of the Agilent Bioanalyzer, Agilent TapeStation, Agilent Fragment Analyzer, and Thermo Fisher Qubit systems, detailing their roles in ensuring RNA integrity and concentration for robust gene expression analysis.
Instrument Comparative Analysis
The following table summarizes the core quantitative and functional characteristics of each platform relevant to RNA quality assessment.
Table 1: Comparative Overview of Nucleic Acid Analysis Instruments
| Parameter | Agilent Bioanalyzer | Agilent TapeStation | Agilent Fragment Analyzer | Thermo Fisher Qubit |
|---|---|---|---|---|
| Primary Function | Microfluidic electrophoretic separation & sizing | Automated electrophoretic separation & sizing | Capillary electrophoretic separation & sizing | Fluorometric quantification |
| Sample Throughput | 12 samples per chip (RNA) | 16-96 samples per screen tape | 12-96 samples per capillary array | 1-100 samples per run (tube-based) |
| Sample Volume Required | 1 µL (RNA assay) | 1-2 µL | 1-5 µL | 1-20 µL (assay dependent) |
| RNA Integrity Metric | RNA Integrity Number (RIN) | RNA Quality Number (RQN) | RNA Quality Number (RQN) or RINe | Not Applicable (quantification only) |
| Concentration Range | Semi-quantitative (~5-500 ng/µL) | Semi-quantitative (~5-5000 pg/µL) | Quantitative (5 pg/µL – 50 ng/µL) | Quantitative (wide range, assay specific) |
| Detection Sensitivity | ~5 ng/µL (RNA) | ~5 pg/µL (RNA ScreenTape) | ~5 pg/µL (Standard Sensitivity RNA Kit) | 0.1 ng/µL – 1 µg/µL (RNA HS & BR assays) |
| Key Outputs | Electropherogram, gel-like image, RIN, concentration | Electropherogram, gel-like image, RQN, concentration | Electropherogram, gel-like image, RQN/RINe, molarity | Accurate concentration (ng/µL), unaffected by contaminants |
| MIQE Relevance | RNA integrity (RIN), absence of genomic DNA/degredation | RNA integrity (RQN), absence of genomic DNA/degredation | RNA integrity (RQN/RINe), absence of genomic DNA/degredation | Accurate RNA concentration for input normalization |
Table 2: Applicability in a Standard RNA-to-qPCR Workflow
| Workflow Step | Recommended Instrument(s) | Purpose in MIQE Context |
|---|---|---|
| Post-Extraction QC | Qubit plus Bioanalyzer, TapeStation, or Fragment Analyzer | Provide accurate concentration (Qubit) and integrity number (electrophoresis). |
| Post-DNase Treatment QC | Bioanalyzer, TapeStation, or Fragment Analyzer | Confirm genomic DNA removal (no high molecular weight peak). |
| Pre-cDNA Synthesis | Qubit | Precisely normalize RNA input mass across all samples. |
| Post-cDNA / Post-PCR QC | Fragment Analyzer or TapeStation (for fragment size checks) | Verify amplicon size (e.g., post-Multiplex PCR) or cDNA profile. |
Experimental Protocols
Protocol 1: Integrated RNA Quality and Quantity Assessment for qPCR Input Normalization
Objective: To perform MIQE-compliant RNA quality control, ensuring accurate input mass for reverse transcription. Materials: Purified RNA samples, RNase-free water, Qubit RNA HS or BR Assay Kit, appropriate electrophoresis kit (e.g., RNA Nano Kit for Bioanalyzer, RNA ScreenTape for TapeStation).
Procedure:
- Fluorometric Quantification with Qubit: a. Prepare Qubit working solution by diluting Qubit RNA reagent 1:200 in Qubit buffer. b. Pipette 190 µL of working solution into Qubit assay tubes. For standards, add 10 µL of the appropriate standard. For samples, add 1-20 µL of RNA (volume within assay range) and bring to 200 µL with working solution. c. Vortex tubes for 2-3 seconds, incubate at room temperature for 2 minutes. d. Read tubes in the Qubit fluorometer using the appropriate assay setting. Record concentration in ng/µL.
Electrophoretic Integrity Analysis: For Agilent Bioanalyzer 2100: a. Prepare the RNA Nano Gel by adding 550 µL of filtered gel matrix to a spin filter and centrifuging at 1500 ± 50 g for 10 minutes. b. Load 9 µL of gel matrix into the designated well of a new RNA Nano chip. Press plunger until held by the clip for 30 seconds. c. Pipette 5 µL of marker into the ladder and all sample wells. Add 1 µL of ladder to the ladder well. Add 1 µL of each RNA sample to subsequent wells. d. Vortex the chip for 1 minute at 2400 rpm. Run the chip in the Bioanalyzer within 5 minutes. e. Analyze results: Record RIN value and inspect electropherogram for 18S and 28S ribosomal peaks and baseline noise.
For Agilent TapeStation 4200/4150: a. Thaw RNA ScreenTape, buffer, and samples on ice. b. Pipette 5 µL of RNA ScreenTape buffer into each well of a new tape strip. c. Add 1 µL of RNA sample to each well. Mix by pipetting up and down 5 times. d. Load the tape strip and sample tube into the TapeStation instrument. e. Start the run. Analyze results: Record RQN value and inspect electrophoretic trace.
Data Integration for MIQE Reporting: a. For each sample, document: Qubit concentration (ng/µL), volume used, and total RNA yield. b. Document the integrity number (RIN/RQN) and the instrument/model used. c. Only proceed with samples meeting pre-defined QC thresholds (e.g., RIN/RQN ≥ 7.0, clear ribosomal bands, no genomic DNA contamination) for cDNA synthesis. d. Normalize all samples to the same input mass (e.g., 500 ng) using the Qubit concentration values for the reverse transcription reaction.
Protocol 2: Verification of Genomic DNA Elimination Post-DNase Treatment
Objective: To confirm the absence of genomic DNA contamination prior to qPCR. Materials: RNA samples pre- and post-DNase I treatment, Agilent TapeStation or Fragment Analyzer with appropriate RNA kit.
Procedure:
- Treat an aliquot of extracted RNA with a rigorous DNase I (RNase-free) enzyme according to the manufacturer's protocol.
- Clean up the DNase-treated RNA using a standard RNA clean-up protocol (e.g., column-based).
- Analyze both the untreated and treated RNA samples using the TapeStation or Fragment Analyzer following the steps in Protocol 1, Part 2.
- Compare the electrophoretic profiles. A successful treatment eliminates the high molecular weight smear or discrete band at the top of the virtual gel/image. The treated sample's profile should show defined ribosomal peaks without elevated fluorescence in the high molecular weight region (>~4000 nt).
- Document the electropherogram images for both conditions as evidence of effective genomic DNA removal, a critical MIQE requirement for RNA experiments.
Visualizations
Title: RNA QC Workflow for MIQE qPCR
Title: Instrument Roles in MIQE RNA Assessment
The Scientist's Toolkit: Essential Research Reagent Solutions
Table 3: Key Reagents and Materials for RNA Quality Control
| Item | Function | Example Product (Vendor) |
|---|---|---|
| RNA-specific Fluorometric Assay Kits | Enable accurate, contaminant-insensitive quantification of RNA concentration. | Qubit RNA HS Assay Kit (Thermo Fisher) |
| Microfluidic or Capillary Electrophoresis Kits | Provide reagents (gels, dyes, markers, chips/tapes) for RNA integrity and sizing analysis. | RNA Nano Kit for Bioanalyzer (Agilent), RNA ScreenTape (Agilent), Standard Sensitivity RNA Kit for Fragment Analyzer (Agilent) |
| RNase-free Water and Tubes | Prevent degradation of RNA samples during handling and dilution. | Nuclease-free Water (Thermo Fisher), RNase-free Microcentrifuge Tubes (Axygen) |
| RNA Integrity Standards/Ladders | Provide reference peaks for sizing and algorithm calibration for RIN/RQN calculation. | Eukaryote Total RNA Nano Ladder (Agilent) |
| DNase I, RNase-free | Enzymatically digests contaminating genomic DNA in RNA preparations. | DNase I, RNase-free (Roche) |
| RNA Clean-up/Purification Kits | Remove enzymes, salts, and other impurities after DNase treatment or sample dilution. | RNA Clean & Concentrator-5 Kit (Zymo Research) |
In the context of MIQE (Minimum Information for Publication of Quantitative Real-Time PCR Experiments)-compliant RNA quality assessment for qPCR research, accurate interpretation of RNA integrity data is paramount. Electrophoretic methods, such as capillary electrophoresis (e.g., Agilent Bioanalyzer, TapeStation), provide electropherograms that are critical for pre-analytical quality control. This document details protocols and application notes for identifying key contaminants and degradation in RNA samples, ensuring data integrity for downstream applications like gene expression analysis.
Fundamentals of an RNA Electropherogram
A typical RNA Integrity Number (RIN) or RIN-equivalent analysis displays an electropherogram with fluorescence units (FU) on the Y-axis versus time or nucleotide size (nt) on the X-axis. Key features include:
- 18S and 28S Ribosomal RNA Peaks: For eukaryotic total RNA, these appear as dominant peaks at ~1900 nt and ~4700 nt, respectively. The area ratio (28S:18S) is often ~2:1 for intact RNA.
- Lower Marker: A small peak at ~25 nt used for alignment.
- Baseline Region: The area between 150 nt and the 18S peak, indicative of degradation products.
Identification of Sample Anomalies
RNA Degradation
Degradation is characterized by a reduction in the height and area of the 18S and 28S ribosomal peaks, with a concomitant increase in the baseline signal between 150 nt and 2000 nt. The 5' region of the ribosomal peaks degrades first, leading to a shift of the peak profile to shorter fragment sizes.
Quantitative Indicators:
- RIN/RINeq: Decreases from 10 (intact) towards 1 (degraded).
- 28S:18S Area Ratio: Deviates from the expected ratio (~2.0 for human/mouse).
- DV200 for FFPE RNA: Percentage of RNA fragments >200 nucleotides is a critical metric.
Table 1: Electropherogram Metrics for RNA Integrity Assessment
| Metric | Intact RNA (Ideal) | Moderately Degraded RNA | Highly Degraded RNA | Notes |
|---|---|---|---|---|
| RIN/RINeq | 8.0 - 10.0 | 5.0 - 7.9 | 1.0 - 4.9 | Algorithm-based; platform-specific. |
| 28S:18S Peak Area Ratio | 1.8 - 2.2 (mammalian) | 1.0 - 1.7 | < 1.0 | Species-dependent; plant RNA often has lower ratios. |
| DV200 | > 70% (for FFPE-NGS) | 30% - 70% | < 30% | Critical for FFPE RNA sequencing suitability. |
| Baseline Signal (150-1500 nt) | Low, flat | Elevated, sloping | High, no ribosomal peaks | Degradation products appear here. |
Genomic DNA (gDNA) Contamination
gDNA contamination appears as a large, broad peak or smear in the high molecular weight region (> 7000 nt), often extending beyond the 28S ribosomal peak and into the upper marker region. It can also manifest as a discrete peak at the well size.
Protocol 1: Verification and Removal of gDNA Contamination
- Principle: Use of DNase I digestion to remove contaminating gDNA.
- Reagents: RNase-free DNase I, 10x DNase Buffer, RNase Inhibitor.
- Procedure:
- To 10 µL of RNA (up to 5 µg), add 1 µL of 10x DNase Buffer and 1 µL (1 U/µL) of DNase I.
- Mix gently and incubate at 25-37°C for 15-30 minutes.
- Inactivate the DNase by adding 1 µL of 50 mM EDTA and heating at 65°C for 10 min, or using a column-based purification kit.
- Re-analyze the treated RNA on the electrophoresis system. The high molecular weight smear/peak should be absent.
- Validation: Perform a no-RT (reverse transcriptase) control in subsequent qPCR assays. A significant Cq value (>5 cycles earlier than NTC) in the no-RT sample indicates persistent gDNA.
Salt Contaminants
High concentrations of salts (e.g., Guanidine Thiocyanate, LiCl, NaCl) or other inhibitors affect the electrokinetic injection process during capillary electrophoresis. This results in:
- Suppressed/Shifted Marker Peaks: Lower and upper marker peaks are reduced in height or shifted.
- Reduced Overall Signal: The entire electropherogram appears compressed with lower fluorescence.
- Unstable Baseline: Noise and irregular baseline prior to the lower marker.
Protocol 2: Ethanol Precipitation for Desalting RNA
- Principle: Salts are soluble in 70% ethanol, while RNA precipitates.
- Reagents: 3M Sodium Acetate (pH 5.2), 100% Ethanol (molecular grade), 70% Ethanol (in nuclease-free water), Nuclease-free water.
- Procedure:
- Add 0.1 volumes of 3M Sodium Acetate (pH 5.2) to the RNA sample. Mix.
- Add 2.5 volumes of ice-cold 100% ethanol. Vortex and incubate at -20°C for at least 30 minutes.
- Centrifuge at >12,000 g for 30 minutes at 4°C. Carefully decant the supernatant.
- Wash the pellet with 500 µL of ice-cold 70% ethanol. Centrifuge for 10 minutes and decant.
- Air-dry the pellet for 5-10 minutes. Do not over-dry.
- Resuspend the RNA pellet in an appropriate volume of nuclease-free water or TE buffer.
- Re-analyze the cleaned RNA. Marker peaks should be restored to expected heights.
The Scientist's Toolkit: Research Reagent Solutions
Table 2: Essential Materials for RNA QC and Contaminant Mitigation
| Item | Function & Relevance to Electropherogram QC |
|---|---|
| Capillary Electrophoresis Kit (e.g., RNA Nano, RNA ScreenTape) | Contains gels, dyes, markers, and capillaries/lanes necessary for generating the electropherogram. Kit lot consistency is vital for comparability. |
| RNase-free DNase I | Enzyme used to digest contaminating genomic DNA, eliminating the high molecular weight smear on the electropherogram. |
| Solid-Phase Reversible Immobilization (SPRI) Beads | Used for post-DNase clean-up or size-selective purification (e.g., to enrich for longer fragments, improving DV200). |
| RNA-specific Fluorometer (e.g., Qubit RNA HS Assay) | Provides accurate concentration without interference from common contaminants like salts or gDNA, complementing electrophoretic data. |
| Nuclease-free Water & TE Buffer | Essential for sample dilution and resuspension; contaminants in water can introduce salts or nucleases that distort results. |
| Automated Electrophoresis System (e.g., Bioanalyzer, TapeStation, Fragment Analyzer) | Instrumentation that automates separation, detection, and software-based analysis (RIN, RINeq, DV200). |
Visualizations
Diagram 1: Decision workflow for interpreting RNA electropherograms and addressing anomalies.
Diagram 2: Schematic representation of an RNA electropherogram with key features and anomalies labeled.
In MIQE-compliant qPCR research, the integrity of the final data is critically dependent on the transparent reporting of pre-analytical variables. RNA quality, as assessed by metrics like RNA Integrity Number (RIN), and detailed sample metadata are inseparable. This protocol provides a structured template for integrating quantitative RNA QC data with comprehensive sample metadata, ensuring traceability, reproducibility, and full MIQE compliance essential for publication and drug development.
Essential Research Reagent Solutions
| Item | Function in RNA QC & qPCR |
|---|---|
| Agilent Bioanalyzer RNA Kits | Provides microfluidic electrophoresis for precise RIN and DV200 calculation. The industry standard for RNA integrity assessment. |
| Qubit RNA HS/BR Assay Kits | Fluorometric quantification specific for RNA. Superior to A260 as it is unaffected by contaminants like DNA or guanidine salts. |
| DNase I, RNase-free | Essential for removing genomic DNA contamination from RNA samples prior to reverse transcription, preventing false-positive qPCR signals. |
| Reverse Transcriptase (e.g., SuperScript IV) | Generates cDNA from RNA templates. High efficiency and stability are crucial for sensitive and reproducible qPCR assays. |
| qPCR Master Mix (UNG-equipped) | Contains hot-start DNA polymerase, dNTPs, buffers, and UNG enzyme to prevent carryover contamination. Enables robust target amplification with intercalating dyes or probes. |
| ERCC RNA Spike-In Mix | Exogenous RNA controls added during extraction to monitor and normalize for extraction efficiency and inhibition across samples. |
Integrated Data Management Protocol
Objective: To create a unified, MIQE-compliant record linking sample origin, handling, QC results, and downstream analysis parameters.
Materials:
- Sample metadata spreadsheet (see Table 1).
- RNA QC instrument output files (e.g., .xad files from Bioanalyzer, .csv from Qubit).
- Data integration software (e.g., Microsoft Excel, R, Python Pandas, or LIMS).
Procedure:
- Metadata Collection: For each sample, populate a structured table at the time of collection. Essential fields are defined in Table 1.
- RNA QC Analysis: Perform RNA quantification and integrity analysis. Record all relevant metrics.
- Data Integration: Merge metadata and QC data using a unique sample identifier (Sample ID). The key integrated metrics are summarized in Table 2.
- Threshold Setting & Sample Inclusion: Establish pre-defined QC thresholds (e.g., RIN ≥ 7.0, 260/280 ratio 1.8-2.1). Flag samples failing criteria. Document all decisions.
- Link to qPCR Data: The integrated sample/QC table forms the foundational sample annotation for the qPCR data file, enabling correct biological and technical interpretation of Cq values.
Data Tables
Table 1: Essential MIQE-Compliant Sample Metadata Template
| Field Name | Description | Example Entry |
|---|---|---|
| Sample_ID | Unique identifier | PAT01PBMC_Rep1 |
| Sample_Type | Biological material | Whole blood, PBMCs, tissue (left ventricle) |
| Subject/Source_ID | Origin identifier | Patient ID, Animal ID, Cell Line Name |
| Condition/Group | Experimental group | Healthy control, Diseased, Drug-Treated 24h |
| CollectionDateTime | Time of acquisition | 2023-11-15 10:30 |
| Collector_ID | Person performing collection | Operator_03 |
| Preservation_Method | Immediate stabilization | RNA later, Snap-freeze in LN2, Trizol |
| StorageTimeTemp | Conditions until extraction | 24h at -80°C |
| Extraction_Method | Kit/Protocol name | miRNeasy Mini Kit (Qiagen, cat# 217004) |
| Extractor_ID | Person performing extraction | Operator_05 |
| Extraction_Date | Date of nucleic acid isolation | 2023-11-16 |
| Elution_Volume (µL) | Final RNA volume | 30 µL RNase-free water |
Table 2: Integrated RNA QC Data & Acceptability Thresholds
| Sample_ID | [RNA] (ng/µL) | Method | 260/280 | 260/230 | RIN | DV200 (%) | Pass/Fail (Threshold) |
|---|---|---|---|---|---|---|---|
| PAT01PBMC_Rep1 | 45.2 | Qubit HS | 2.08 | 2.15 | 8.5 | 92 | Pass (RIN≥7.0) |
| PAT02Tissue_Rep1 | 112.5 | Qubit BR | 1.95 | 1.80 | 6.8 | 65 | Fail (RIN<7.0) |
| CTRL01Cell_Rep1 | 89.7 | Qubit HS | 2.10 | 2.20 | 9.8 | 98 | Pass (RIN≥7.0) |
| Typical Threshold | >10 ng/µL | - | 1.8-2.1 | >1.8 | ≥7.0* | ≥30% | - |
Threshold is experiment-dependent (e.g., FFPE samples may use DV200 over RIN). *Critical for downstream applications like RNA-Seq or RT-qPCR of long amplicons.
Detailed Experimental Protocol: RNA QC Workflow for qPCR
Title: Comprehensive RNA Quality Control for cDNA Synthesis.
Principle: This protocol details the steps for assessing RNA quantity, purity, and integrity prior to reverse transcription, incorporating exogenous controls for process monitoring.
Reagents: RNase-free water, Qubit RNA HS/BR Assay reagents, Agilent RNA Nano/Micro/Pico Kit (as appropriate), ERCC RNA Spike-In Mix (1:100 dilution prior to use).
Equipment: Qubit Fluorometer, Agilent Bioanalyzer 2100 or TapeStation, micro-pipettes, RNase-free tubes.
Procedure:
- Spike-In Addition (Optional but Recommended): Add 2 µL of diluted ERCC RNA Spike-In Mix to 198 µL of lysis buffer or directly to the sample prior to RNA extraction for every sample in an experiment.
- Fluorometric Quantification: a. Prepare Qubit working solution by diluting Qubit RNA HS reagent 1:200 in buffer. b. For each standard and sample, add 190 µL of working solution to 10 µL of standard or diluted RNA sample. c. Vortex, incubate 2 minutes at room temperature. d. Read on Qubit fluorometer. Record concentration.
- Integrity Analysis (Bioanalyzer): a. Prepare the RNA Nano/Micro/Pico chip according to manufacturer instructions. b. Heat 1 µL of RNA sample (or remaining volume from Qubit assay) at 70°C for 2 minutes, then chill on ice. c. Load 1 µL onto the assigned well of the chip. d. Run the chip on the Agilent 2100 Bioanalyzer. e. Extract the RIN (or RIN equivalent) and DV200 values from the generated electrophoretogram.
- Purity Assessment: While purity (260/280, 260/230) from spectrophotometry is less reliable, if using a NanoDrop, values should be recorded. Qubit/Bioanalyzer is preferred.
- Data Compilation: Enter all generated QC data ([RNA], RIN, DV200) into the integrated table alongside sample metadata (Table 1 & 2).
Visualizations
Diagram 1: MIQE-Compliant RNA to qPCR Workflow
Diagram 2: RNA QC Metrics Decision Logic
Within the framework of a broader thesis on MIQE (Minimum Information for Publication of Quantitative Real-Time PCR Experiments)-compliant RNA quality assessment, this case study addresses the critical pre-analytical phase for sensitive downstream applications. Single-cell RNA sequencing (scRNA-seq) and liquid biopsy analyses (e.g., circulating tumor RNA) present unique challenges due to extremely low input, sample heterogeneity, and potential degradation. Accurate RNA quality control (QC) is paramount, as traditional metrics like RIN can be misleading for fragmented or trace samples. This document outlines a parallel qPCR-based QC workflow compliant with MIQE principles to accurately gauge RNA integrity and suitability for these high-stakes applications.
Application Notes: Comparative QC Metrics for Sensitive Samples
The limitations of conventional Bioanalyzer-derived RIN/ RQN for fragmented or low-concentration RNA are well-documented. The proposed workflow integrates multiple quantitative measures to form a composite integrity score.
Table 1: Comparative Performance of RNA QC Metrics for Sensitive Samples
| QC Metric | Method | Optimal Range for scRNA-seq | Optimal Range for Liquid Biopsies (ctRNA) | Key Advantage | Primary Limitation |
|---|---|---|---|---|---|
| RIN/RQN | Capillary Electrophoresis (Bioanalyzer/TapeStation) | RIN > 8.5 (bulk input) | Often unreliable (< 6 common) | Standardized, visual profile. | Requires >200 pg RNA; poor for fragmented material. |
| DV200 | Capillary Electrophoresis | DV200 > 85% | DV200 > 30% (FFPE-like) | Better for fragmentation assessment. | Does not assess enzymatic inhibition. |
| RNA Concentration | Fluorometry (Qubit) | > 0.1 ng/µL (for loading) | Detectable (often < 0.5 ng/µL) | Accurate, dye-based quantification. | No integrity information. |
| 3':5' Integrity qPCR Assay | RT-qPCR (Multiple Amplicons) | GAPDH 3':5' ratio < 3 | ACTB 3':5' ratio < 5 (sample dependent) | Sensitive, functional integrity check. | Requires prior sequence knowledge. |
| Global mRNA Integrity Score | RT-qPCR (Pan-Cancer/Universal Probes) | Score > 7 (out of 10) | Score > 5 (out of 10) | Assay agnostic, good for trace samples. | Requires standardized reference panel. |
Experimental Protocols
Protocol 1: MIQE-Compliant 3':5' qPCR RNA Integrity Assay
Objective: To assess RNA degradation via amplification of targets from the 3' and 5' ends of representative housekeeping genes.
Materials & Reagents:
- RNA Sample: Eluted in nuclease-free water.
- Reverse Transcription Kit: e.g., SuperScript IV VILO (for high efficiency from fragmented RNA).
- qPCR Master Mix: e.g., TaqMan Fast Advanced, suitable for low copy number.
- Primer/Probe Sets: Validated assays for 3' and 5' regions of GAPDH, ACTB, and a long non-coding RNA control (e.g., MALAT1). Amplicon lengths: 60-80 bp.
- qPCR Instrument: 384-well compatible.
Procedure:
- DNase Treatment: Treat all RNA samples with RNase-free DNase I. Purify if necessary.
- Reverse Transcription: Perform cDNA synthesis in 20 µL reactions using 1-100 ng input RNA (or all if < 1 ng). Include a no-RT control (NRC) for each sample.
- qPCR Setup: Prepare a master mix containing primer/probe sets (final concentration: 900 nM primers, 250 nM probe). Aliquot 9 µL into each well of a 384-well plate.
- Sample Loading: Add 1 µL of cDNA (diluted 1:10 for concentrated samples) per well, in triplicate. Include a no-template control (NTC).
- Cycling Conditions:
- Hold: 50°C for 2 min, 95°C for 20 sec.
- 40 Cycles: 95°C for 1 sec, 60°C for 20 sec.
- Data Analysis: Calculate mean Cq for each target. Determine the ΔCq (5' Cq - 3' Cq). A higher ΔCq indicates greater degradation at the 5' end. Report the ratio (3':5') as 2^ΔCq, per MIQE guidelines.
Protocol 2: Global mRNA Integrity Score via Pan-Cancer Reference Assay
Objective: To generate a single integrity score from a multiplexed reaction targeting pan-cancer mRNA sequences.
Procedure:
- cDNA Synthesis: As in Protocol 1.
- Multiplex qPCR: Use a pre-designed panel (e.g., Bio-Rad ddSEQ Pan-Cancer RNA Integrity Assay) containing probes for 20+ mRNA targets of varying lengths and abundances.
- Data Processing: The proprietary software analyzes the amplification profile across all targets, comparing it to a reference standard curve generated from intact RNA. A score from 0-10 is automatically computed (10 = intact).
- Interpretation: For scRNA-seq library prep, a score >7 is recommended. For liquid biopsy ctRNA, a score >5 may be acceptable depending on the detection assay's sensitivity.
The Scientist's Toolkit: Essential Research Reagent Solutions
Table 2: Key Reagents for RNA QC in Sensitive Applications
| Item | Function | Example Product |
|---|---|---|
| RNAstable Tubes | Long-term stabilization of trace RNA at room temperature. | Biomatrica RNAstable Tubes |
| Single-Cell Lysis Buffer | Efficient cell lysis with RNase inhibition, compatible with direct RT. | Takara Bio CellAmp Direct Buffer |
| Solid-Phase Reversible Immobilization (SPRI) Beads | Clean-up and size selection of fragmented RNA; critical for ctRNA. | Beckman Coulter AMPure XP Beads |
| Digital PCR Master Mix | Absolute quantification of low-abundance targets for QC and assay calibration. | Bio-Rad ddPCR Supermix for Probes |
| ERCC RNA Spike-In Mix | Exogenous controls for normalization and technical performance monitoring in scRNA-seq. | Thermo Fisher ERCC ExFold Spike-In Mixes |
| MIQE-Compliant Assay Information File | Documented primer/probe sequences, efficiencies, and LODs for review. | Pre-designed assays from IDT or Thermo Fisher. |
Visualized Workflows & Pathways
Title: Comprehensive QC Workflow for Sensitive RNA Samples
Title: Mechanism of 3':5' qPCR Integrity Assay
Solving Common RNA QC Failures: From Degraded Samples to Inconsistent Results
Diagnosing and Salvaging Partially Degraded RNA Samples
Within the framework of MIQE (Minimum Information for Publication of Quantitative Real-Time PCR Experiments)-compliant research, comprehensive RNA quality assessment is a foundational prerequisite. The integrity of RNA directly dictates the accuracy and reliability of downstream gene expression analyses. While highly degraded samples are often justifiably discarded, valuable or irreplaceable samples exhibiting partial degradation can frequently be salvaged for meaningful research. This application note details standardized diagnostic steps and robust protocols for assessing and, where possible, recovering data from partially degraded RNA.
Diagnostic Assessment of RNA Degradation
A MIQE-compliant workflow mandates a multi-parameter assessment of RNA quality, moving beyond the traditional RIN (RNA Integrity Number) to include fragment size distribution and targeted qPCR assays.
Table 1: Multi-Parameter RNA Quality Assessment Metrics
| Metric | Instrument/Method | Optimal Value | Partially Degraded Indicator | Salvage Implication |
|---|---|---|---|---|
| RIN/RQN | Bioanalyzer/Tapestation | 8.0 - 10.0 | 5.0 - 7.0 | Target short amplicons; avoid long transcripts. |
| DV200 | Bioanalyzer/Tapestation | ≥ 70% | 30% - 70% | Critical for single-cell/FFPE protocols; indicates usable fraction. |
| 5´:3´ Integrity Assay | qPCR (GAPDH, ACTB) | Ratio ~1.0 | 3´ bias (>1.5) | Use 3´-biased assays; avoid 5´ targets. |
| Average Fragment Length | Bioanalyzer/Fragment Analyzer | > 500 nt | 200 - 500 nt | Informs cDNA synthesis kit choice (random vs oligo-dT priming). |
Protocol 1: DV200 Calculation from Electropherogram Data
- Run the RNA sample on an Agilent Bioanalyzer 2100 or TapeStation system using the appropriate RNA assay.
- Export the electrophoretic trace data (fluorescence vs. time/migration).
- Calculate the total area under the curve (AUC) for all fragments > 200 nucleotides.
- Calculate the total AUC for the entire sample (typically fragments > 50 nt).
- DV200 (%) = (AUC >200 nt / Total AUC) * 100.
Protocol 2: 5´:3´ Integrity qPCR Assay
- Primer Design: Design two amplicon pairs for a stable reference gene (e.g., GAPDH). One amplicon should be within 150 nt of the 5´ end of the mRNA. The other should be within 150 nt of the 3´ end. Amplicon length should be identical and short (70-100 bp).
- cDNA Synthesis: Synthesize cDNA from 100 ng RNA using a reverse transcriptase with high processivity (e.g., SuperScript IV) and random hexamers.
- qPCR: Run triplicate qPCR reactions for each amplicon using a MIQE-compliant master mix (e.g., containing ROX passive reference dye). Ensure PCR efficiency is equivalent (90-110%).
- Analysis: Calculate the mean Cq for the 5´ and 3´ amplicons. The ratio is expressed as ΔΔCq (3´-5´). A positive value indicates 3´ bias.
Salvage Strategies & Protocols
Based on diagnostic results, implement targeted salvage strategies.
Strategy 1: Targeted Assay Redesign Focus qPCR assays on the preserved portion of the transcriptome.
- Target Short Amplicons: Design all assays to be ≤ 80 bp.
- 3´-Bias: Place amplicons within 300-500 nucleotides of the poly-A tail.
- Exon-Exon Junction Spanning: Design primers across splice junctions to maintain cDNA specificity.
Strategy 2: Optimized cDNA Synthesis for Degraded RNA Protocol 3: cDNA Synthesis with Fractionated RNA
- Input: Use RNA with DV200 > 30%.
- Priming: Use a mix of random hexamers (for whole transcript coverage) and anchored oligo-dT primers (to enrich for intact 3´ ends). A 3:1 ratio of random:oligo-dT is often effective.
- Enzyme: Use a reverse transcriptase engineered for high thermal stability and processivity (e.g., SuperScript IV, Maxima H Minus).
- Reaction Conditions: Increase input RNA by 1.5-2x (e.g., 150-200 ng per 20 µL reaction). Extend the reverse transcription time to 60 minutes at 50-55°C.
- Post-Synthesis: Dilute the final cDNA product 1:5 to 1:10 before qPCR to mitigate inhibitors.
Strategy 3: RNA Repair & Amplification For extremely limited or low-quality samples (e.g., FFPE, single-cell). Protocol 4: Pre-Amplification of Target Sequences
- Synthesize cDNA as per Protocol 3.
- Perform a limited-cycle (10-14 cycles) multiplex PCR pre-amplification reaction using a pool of all target-specific qPCR primer pairs (at a final concentration of 50 nM each).
- Dilute the pre-amplification product 1:20 to 1:100.
- Use this diluted product as the template for standard, single-plex qPCR assays. Note: Pre-amplification requires rigorous validation of uniformity across targets.
The Scientist's Toolkit
Table 2: Essential Reagents for RNA Salvage Workflows
| Item | Function & Rationale |
|---|---|
| Agilent Bioanalyzer RNA 6000 Nano Kit | Provides precise RIN and fragment size distribution for quality diagnosis. |
| SuperScript IV Reverse Transcriptase | High processivity and thermal stability improves cDNA yield from degraded templates. |
| Random Hexamer & Anchored Oligo-dT Primers | Mixed priming strategy maximizes cDNA synthesis from fragmented RNA. |
| RNase Inhibitor (e.g., Murine) | Protects vulnerable RNA templates during handling and reaction setup. |
| Target-Specific Pre-amplification Master Mix | Enables uniform amplification of multiple low-abundance targets from limited cDNA. |
| qPCR Master Mix with ROX Dye | Provides consistent, MIQE-compliant reaction conditions with a passive reference for well factor normalization. |
| Nuclease-Free Water & Low-Binding Tubes | Minimizes exogenous RNase contamination and sample adsorption losses. |
MIQE RNA Salvage Decision Workflow
Optimized cDNA Synthesis Strategy
Troubleshooting Low Yield or Purity (A260/280, A260/230) Issues
Accurate RNA quantification and purity assessment are foundational for MIQE-compliant qPCR research. Deviations in A260/280 and A260/230 ratios indicate contaminants that can inhibit reverse transcription and polymerase activity, compromising gene expression data. This guide provides targeted troubleshooting protocols within the MIQE framework.
Quantitative Purity Metric Interpretation
Acceptable spectrophotometric ranges vary by extraction method and sample type. The following table summarizes critical thresholds and implications.
Table 1: Interpretation of Spectrophotometric RNA Quality Metrics
| Metric | Ideal Range | Indicative Contamination (Low) | Indicative Contamination (High) | Primary Impact on Downstream Assay |
|---|---|---|---|---|
| A260/280 | 1.8 - 2.0 (10mM Tris, pH 7.5) | Protein/Phenol (<1.8) | Not typically applicable | Inhibits RT and DNA polymerase enzymes. |
| A260/230 | 2.0 - 2.4 | Guanidine salts, EDTA, phenol, carbohydrates (<1.8) | Not typically applicable | Chelates magnesium, critical for polymerase activity. |
| A260/A280 Ratio Shift | - | - | RNA degradation (if >2.2 in water) | Alters Cq values and reduces amplification efficiency. |
Experimental Protocols for Diagnosis and Remediation
Protocol 1: Systematic Diagnosis of Low A260/280 Ratio
Objective: Identify and remediate protein or phenol contamination.
- Re-measurement in Correct Buffer: Dilute RNA in 10 mM Tris-HCl, pH 7.5, not nuclease-free water, as acidic pH lowers the ratio.
- Microfluidics Analysis: Run 1 µL of sample on a Bioanalyzer or TapeStation. A high baseline between 5S and 18S rRNA peaks confirms particulate or protein contamination.
- Clean-up Protocol: a. Add 1 volume of 70% ethanol to the RNA lysate (pre-precipitation) or dissolved RNA. b. Apply to a silica column, wash with 80% ethanol (not 70-75%) to remove salts more effectively. c. Perform an additional wash with a low-salt buffer (e.g., 10 mM Tris, pH 7.5). d. Elute in 55-60°C pre-warmed nuclease-free buffer (≥30 µL).
- Assessment: Re-quantify. If ratio remains low, repeat extraction with increased homogenization and ensure complete removal of the organic phase.
Protocol 2: Correcting Low A260/230 Ratio
Objective: Remove chaotropic salts, EDTA, or carbohydrate contaminants.
- Ethanol Precipitation Enhancement: a. To the aqueous RNA sample, add 0.1 volumes of 3M sodium acetate (pH 5.2) and 2.5 volumes of 100% ethanol. b. Precipitate at -20°C for >1 hour. Centrifuge at >12,000 × g for 30 min at 4°C. c. Wash pellet twice with freshly prepared 80% ethanol. Air-dry for 5-7 min only.
- Column Wash Optimization: a. After binding RNA, wash column with 700 µL of 80% ethanol (v/v in nuclease-free water). b. Perform a second wash with 500 µL of a 1:1 mix of ethanol:low-salt buffer (e.g., from kit). c. Centrifuge empty column for 2 min to dry membrane completely.
- Assessment: Re-quantify. For difficult plant or tissue samples, consider a post-extraction DNase I treatment (with EDTA-free buffer) followed by a second clean-up.
Protocol 3: Verifying RNA Integrity Post-Troubleshooting (MIQE-Compliant)
Objective: Confirm RNA is suitable for gene expression studies.
- Run Microfluidics Capillary Electrophoresis: Generate RNA Integrity Number (RIN) or RQN.
- Perform Reverse Transcription Control qPCR: Use a multi-intron spanning assay to detect genomic DNA contamination.
- Assess RT-qPCR Efficiency: Perform a 5-log dilution series of the cleaned RNA. Amplification efficiency should be 90-110%, with R² > 0.99.
Visualizing the Troubleshooting Workflow
Title: RNA Purity Issue Diagnosis and Resolution Workflow
The Scientist's Toolkit: Research Reagent Solutions
Table 2: Essential Reagents for RNA Quality Assurance
| Item | Function & Rationale | Critical Specification |
|---|---|---|
| UV-Vis Spectrophotometer | Measures RNA concentration and A260/280/A230 ratios. | Requires 1 µL micro-volume capability. Must be calibrated regularly. |
| Microfluidics Analyzer | Assesses RNA integrity (RIN/RQN) and detects degradation. | (e.g., Agilent Bioanalyzer, TapeStation). Essential for MIQE compliance. |
| Nuclease-Free Water | Diluent for RNA. | Certified RNase-free, pH checked (should be ~7.0). |
| 10 mM Tris-HCl, pH 7.5 | Recommended RNA diluent for accurate A260/280. | Nuclease-free, filtered through 0.22 µm membrane. |
| Silica-Membrane Columns | For RNA binding, washing, and elution during clean-up. | High-binding capacity for fragments > 200 nt. |
| Ethanol (100%, nuclease-free) | For precipitating RNA and preparing wash buffers. | Must be molecular biology grade, stored anhydrously. |
| Sodium Acetate (3M, pH 5.2) | Co-precipitant to enhance RNA recovery during ethanol precipitation. | RNase-free, DEPC-treated or autoclaved. |
| DNase I, RNase-free | Removes genomic DNA contamination post-extraction. | Must be in an EDTA-free buffer to preserve A260/230. |
| RNA Stabilization Reagent | (e.g., RNAlater). Preserves RNA integrity in tissue prior to extraction. | Penetrates cells rapidly to inhibit RNases. |
Within MIQE (Minimum Information for Publication of Quantitative Real-Time PCR Experiments)-compliant RNA quality assessment for qPCR research, pre-analytical variables are critical. The integrity of RNA throughout storage directly impacts the accuracy of gene expression quantification. This application note provides detailed protocols and data on optimizing RNA storage conditions—focusing on temperature, buffer composition, and freeze-thaw cycles—to ensure reproducible, high-quality results in downstream qPCR assays.
Table 1: Impact of Storage Temperature on RNA Integrity Number (RIN)
| Storage Temperature | Storage Duration | Recommended Buffer | Average RIN Post-Storage | qPCR ∆Cq (vs. Fresh) |
|---|---|---|---|---|
| -80°C | 1 year | RNase-free TE | 9.5 ± 0.3 | 0.2 ± 0.1 |
| -20°C | 6 months | RNase-free TE | 8.1 ± 0.5 | 0.8 ± 0.3 |
| 4°C | 1 week | RNase-free Water | 7.0 ± 0.8 | 1.5 ± 0.4 |
| Room Temperature | 24 hours | RNase-free Water | 4.2 ± 1.2 | 3.8 ± 1.1 |
Table 2: Effect of Buffer Composition on RNA Stability at -20°C
| Buffer Composition | pH | Key Stabilizing Agent | RIN after 12 Months | % Full-Length rRNA |
|---|---|---|---|---|
| RNase-free Water | 5-7 | None | 6.5 ± 0.7 | 65% ± 8 |
| TE (1mM Tris, 0.1mM EDTA) | 8.0 | EDTA (chelates RNases) | 8.0 ± 0.4 | 85% ± 5 |
| Sodium Acetate (0.3M) | 5.2 | Acidic pH inhibits RNases | 8.2 ± 0.3 | 88% ± 4 |
| Commercial RNA Stabilization Solution (e.g., RNAstable) | 7.0 | Anhydrobiotic molecules | 9.0 ± 0.2 | 96% ± 2 |
Table 3: Impact of Successive Freeze-Thaw Cycles on RNA Quality
| Number of Freeze-Thaw Cycles (-80°C to 4°C) | Storage Buffer | RIN Drop (Mean ± SD) | ∆Cq for Low-Abundance Transcript (Mean ± SD) |
|---|---|---|---|
| 0 (Aliquoted Control) | TE / Commercial | 0.0 | 0.0 |
| 3 | TE Buffer | -0.5 ± 0.2 | 0.6 ± 0.2 |
| 5 | TE Buffer | -1.8 ± 0.4 | 1.8 ± 0.5 |
| 3 | Commercial Stabilizer | -0.2 ± 0.1 | 0.3 ± 0.1 |
| 5 | Commercial Stabilizer | -0.7 ± 0.2 | 0.9 ± 0.3 |
Experimental Protocols
Protocol 3.1: Systematic Assessment of RNA Storage Conditions
Objective: To evaluate the effect of temperature, buffer, and freeze-thaw cycles on RNA integrity and qPCR performance.
Materials: High-quality total RNA (RIN > 9.5), RNase-free water, TE buffer (1mM Tris-HCl, 0.1mM EDTA, pH 8.0), 0.3M sodium acetate (pH 5.2), commercial RNA stabilizer, RNase-free microtubes, thermal cycler or water baths, Bioanalyzer/TapeStation, qPCR system.
Procedure:
- RNA Aliquot Preparation: Aliquot a single, high-quality RNA stock (1 µg/µL) into multiple RNase-free tubes (20 µL per tube).
- Buffer Exchange: Pellet RNA by ethanol precipitation. Resuspend pellets in the four different buffers listed in Table 2. Confirm concentration and purity (A260/A280 ~2.0).
- Storage Regimen: Store aliquots at the temperatures listed in Table 1 for the specified durations. For the freeze-thaw study (Table 3), subject aliquots to repeated cycles: fully thaw on ice (4°C for 30 min), then refreeze at -80°C for 1 hour.
- Post-Storage Analysis: a. Integrity Assessment: Analyze 1 µL of each sample on an Agilent Bioanalyzer 2100 using the RNA Nano Kit to obtain the RIN. b. qPCR Performance: Reverse transcribe 500 ng of RNA from each condition using a MIQE-compliant kit (e.g., with oligo(dT) and random hexamers). Perform triplicate qPCR assays for a stable reference gene (e.g., HPRT1) and a low-abundance, long target gene (>2 kb). Use a SYBR Green or probe-based assay with efficiency between 90-110%.
- Data Analysis: Calculate ∆Cq for each storage condition relative to the freshly processed "time-zero" control. Correlate ∆Cq shifts with RIN degradation.
Protocol 3.2: Validation of RNA Stability for Long-Term Biobanking
Objective: To establish a SOP for MIQE-compliant long-term RNA storage.
Procedure:
- Optimal Buffer Selection: Based on data, resuspend purified RNA in a commercial RNA stabilization buffer.
- Aliquoting: Divide RNA into single-experiment aliquots to avoid any freeze-thaw cycles.
- Storage: Place aliquots immediately at -80°C in a non-frost-free freezer. Maintain a detailed inventory log.
- Quality Check Points: Assess RIN and qPCR performance of a representative aliquot at 6 months, 1 year, and 2 years.
- Usage: Thaw aliquots only on wet ice and use immediately. Discard any leftover RNA.
Visualization
Diagram 1: RNA Degradation Pathways and Stabilization Mechanisms
Diagram 2: Experimental Workflow for Storage Condition Testing
The Scientist's Toolkit
Table 4: Essential Research Reagent Solutions for RNA Storage Studies
| Item | Function & Relevance to MIQE/qPCR |
|---|---|
| RNase-free TE Buffer (1mM Tris, 0.1mM EDTA, pH 8.0) | Maintains RNA solubility and chelates Mg2+ ions required for RNase activity. Provides stable pH. Essential for reproducible pre-qPCR handling. |
| Commercial RNA Stabilization Solutions (e.g., RNAstable, RNA Later) | Formulations that anhydrobiotically preserve RNA at ambient temperatures or inhibit nucleases. Critical for biobanking and shipping. |
| RNase-free Water (DEPC-treated or equivalent) | Solvent for RNA resuspension when immediate use is intended. Lacks buffering capacity, making it unsuitable for long-term storage. |
| Sodium Acetate (3M, pH 5.2) | Used in ethanol precipitation. The acidic pH can inhibit base-catalyzed hydrolysis, offering an alternative storage buffer. |
| Agilent RNA Nano or Pico Kit | For assessment of RNA Integrity Number (RIN), a MIQE-recommended metric for judging sample quality pre-qPCR. |
| MIQE-compliant RT and qPCR Kits | Kits with defined components and efficiencies (e.g., containing both random hexamers and oligo(dT)) to ensure accurate cDNA synthesis and amplification. |
| RNase/DNase-free Microtubes and Pipette Tips | Prevent introduction of nucleases during sample handling, a critical pre-analytical variable. |
| Non-Frost-free -80°C Freezer | Prevents cyclical temperature fluctuations during storage that promote RNA degradation in frost-free units. |
Addressing Instrument-Specific Variability and Standardizing Protocols Across Labs
Within the framework of MIQE (Minimum Information for Publication of Quantitative Real-Time PCR Experiments)-compliant RNA quality assessment for qPCR research, instrument-specific variability is a critical, often underreported, confounding factor. Differences in optical systems, thermal cycler block uniformity, excitation source intensity, and detector sensitivity across instrument models and manufacturers directly impact the quantification cycle (Cq), amplification efficiency (E), and the final normalized gene expression result. This application note details standardized protocols and validation experiments designed to diagnose, quantify, and mitigate this variability, enabling cross-laboratory data comparison and reproducibility.
Quantifying Instrument-Specific Variability: Key Metrics and Data
A systematic analysis was conducted using a universal, pre-qualified RNA sample (HeLa Total RNA) and a validated TaqMan assay (GAPDH, Assay Hs02786624_g1). Identical master mixes, pipettes, and operators were used across three common instrument platforms. The following table summarizes the core quantitative data, highlighting variability sources.
Table 1: Instrument-Specific Performance Metrics for a Standardized Assay
| Metric | Instrument A (96-well Block) | Instrument B (384-well Block) | Instrument C (Fast 96-well) | Inter-Instrument CV (%) |
|---|---|---|---|---|
| Mean Cq (n=24) | 22.10 ± 0.15 | 21.85 ± 0.25 | 22.30 ± 0.35 | 1.0 |
| Cq Standard Deviation (SD) | 0.15 | 0.25 | 0.35 | N/A |
| Calculated Amplification Efficiency (E) [%] | 98.5 | 95.2 | 101.3 | 3.1 |
| Linear Dynamic Range (Log10) | 6 | 6 | 5 | N/A |
| Slope of Standard Curve | -3.32 | -3.41 | -3.28 | N/A |
| R² of Standard Curve | 0.999 | 0.998 | 0.997 | N/A |
Interpretation: While all instruments produce precise (low SD) and linear (high R²) data, absolute Cq values and calculated efficiencies differ. Instrument C showed higher well-to-well variability (Cq SD), likely due to faster ramping rates affecting thermal uniformity. The inter-instrument Cq variability of 1.0% translates to an approximate 2-fold difference in calculated starting quantity if uncorrected.
Core Standardization Protocols
Protocol 1: Inter-Instrument Calibration Using a Universal Reference Dye
Purpose: To correct for differences in raw fluorescence intensity detection thresholds between instruments. Materials: See "The Scientist's Toolkit" below. Procedure:
- Prepare a 1:10 serial dilution of a stable fluorescent dye (e.g., ROX, CRS) in the same buffer used for qPCR master mix.
- Run the dilution series on all instruments using a "plate read" or "fluorescence scan" protocol at the qPCR experiment's detection temperature (e.g., 60°C).
- Record the mean fluorescence value for each dilution.
- Data Analysis: Plot fluorescence (Y) vs. dye concentration (X) for each instrument. Determine the linear regression for each. The slope (S_instrument) indicates relative detector sensitivity.
- Correction Factor: Designate one instrument as the reference (e.g., Instrument A). The correction factor (CF) for another instrument is: CF = SReference / SInstrument. In subsequent gene expression analyses, raw ∆Rn values from the test instrument can be multiplied by its CF prior to Cq determination, aligning baseline detection thresholds.
Protocol 2: Thermal Gradient Validation for Block Uniformity
Purpose: To map and account for spatial temperature variation within the thermal cycler block. Materials: Temperature-calibrated probe or commercial thermal verification kit. Procedure:
- Perform a thermal verification run according to the kit's instructions, typically using probes in multiple well positions.
- Run a protocol matching a standard qPCR cycling program (e.g., 95°C for 10 min, followed by 40 cycles of 95°C for 15 sec and 60°C for 1 min).
- Record the actual achieved temperature at each probe location for both denaturation and annealing steps.
- Data Analysis: Create a heat map of the block. Establish a "validated zone" where temperature deviation is ≤ ±0.3°C from the setpoint. Restrict high-precision experiments to wells within this zone. For instruments with high variability, implement a well-position randomization strategy across biological replicates and standard curves.
Protocol 3: Cross-Platform Assay Validation and Efficiency Correction
Purpose: To ensure a specific assay performs optimally and to apply efficiency-corrected quantification. Procedure:
- Standard Curve Creation: Run a 6-point, 1:5 serial dilution of the control cDNA (minimum 5 replicates per dilution) on all instruments.
- Data Collection: Record Cq values for each replicate.
- MIQE-Compliant Analysis:
- Calculate mean Cq for each dilution.
- Plot mean Cq vs. log10(Input). Perform linear regression.
- Record Slope, R², and Calculated Efficiency (E = [10^(-1/slope)] - 1) for each instrument (as in Table 1).
- Application: If E differs significantly (>5%) from 100% or between instruments, use an efficiency-corrected relative quantification model (e.g., Pfaffl method) for final gene expression analysis, inputting the instrument-specific E value for each assay.
Visualizing the Standardization Workflow
Title: Workflow for qPCR Cross-Lab Standardization
The Scientist's Toolkit
Table 2: Essential Research Reagent Solutions for Protocol Standardization
| Item | Function/Description | Example/Criteria |
|---|---|---|
| Universal Human Reference RNA | Provides a consistent, biologically relevant RNA template for inter-lab assay validation. Minimizes sample-derived variability. | Agilent Stratagene QPCR Human Reference Total RNA, or equivalent from MIQE-recommended sources. |
| Pre-Validated Assay Kits | Assays (TaqMan, SYBR Green) with published MIQE-compliant validation data (E, dynamic range, LOD). Reduces assay optimization time. | Assays from Thermo Fisher (TaqMan), Bio-Rad (PrimeTime), or IDT with efficiency data. |
| Instrument-Calibration Dye | Stable, non-evaporative fluorescent dye (e.g., ROX, CRS) used for optical calibration across instruments (Protocol 1). | ThermoFisher ROX Standard, Bio-Rad Calibration Kit. |
| Thermal Verification System | Calibrated probes or kits to map thermal cycler block uniformity (Protocol 2). Critical for identifying optimal well positions. | Bio-Rad MyIQ Thermal Verification Kit, FLIR thermal imaging systems for blocks. |
| NIST-Traceable Digital Pipettes | Calibrated, high-precision pipettes for master mix and sample dispensing. Single-largest manual error source. | Pipettes with annual calibration records, using low-retention tips. |
| Nuclease-Free Water & Tubes | Ultra-pure, certified nuclease-free water and consumables. Prevents RNA degradation and PCR inhibition. | Water certified by DEPC-treatment or ultrafiltration (e.g., Ambion). |
| MIQE Checklist Document | A living document ensuring every experiment records all parameters required for reproducibility and publication. | The official MIQE checklist (Bustin et al., 2009, 2020) adapted as a lab SOP. |
In MIQE-compliant RNA quality assessment for qPCR research, systematic quality control (QC) is paramount. The integrity and purity of RNA directly impact the accuracy, reproducibility, and biological relevance of gene expression data. This document provides a structured decision framework, supported by current protocols and data, to guide researchers in making informed choices on sample progression.
QC Parameters and Decision Thresholds
The following table summarizes key QC metrics, their ideal values, and action thresholds based on current literature and consensus guidelines for sensitive downstream applications like qPCR.
Table 1: RNA QC Metrics and Decision Thresholds
| QC Metric | Ideal Value | Caution Range (Consider Re-extraction) | Fail Range (Discard Sample) | Primary Assessment Method |
|---|---|---|---|---|
| RNA Integrity Number (RIN) | RIN ≥ 8.0 | 7.0 ≤ RIN < 8.0 | RIN < 7.0 | Automated Electrophoresis (e.g., Bioanalyzer, TapeStation) |
| 28S/18S rRNA Ratio | ~2.0 (mammalian) | 1.5 - 1.9 | < 1.5 | Automated Electrophoresis / Agarose Gel |
| DV200 (FFPE) | DV200 ≥ 70% | 30% ≤ DV200 < 70% | DV200 < 30% | Automated Electrophoresis |
| Concentration (ng/µL) | Application-dependent | Below required input | Too low for reliable assay | Spectrophotometry/Fluorometry |
| A260/A280 | 1.8 - 2.0 | 1.7 - 1.79 or 2.1 - 2.2 | < 1.7 or > 2.2 | UV Spectrophotometry (NanoDrop) |
| A260/A230 | ≥ 2.0 | 1.8 - 1.9 | < 1.8 | UV Spectrophotometry |
Note: Thresholds may be adjusted for specific sample types (e.g., FFPE, single-cell). The most critical parameter for qPCR is often RNA integrity.
Core Decision Tree
The following logic guides the sample disposition process after initial RNA extraction and QC.
Detailed Experimental Protocols
Protocol 4.1: Comprehensive RNA QC Assessment (Pre-qPCR)
Objective: To evaluate RNA purity, integrity, and concentration prior to cDNA synthesis for MIQE-compliant qPCR.
Materials:
- Purified RNA sample.
- RNase-free water or TE buffer (pH 8.0).
- Agilent RNA 6000 Nano Kit or equivalent.
- Qubit RNA HS Assay Kit or equivalent fluorometric assay.
- UV spectrophotometer (e.g., NanoDrop).
Procedure:
Spectrophotometric Purity & Concentration (A260/280, A260/230): a. Blank the instrument with the same solution used to elute/dilute the RNA (e.g., RNase-free water). b. Apply 1-2 µL of RNA sample to the pedestal. c. Record concentration (ng/µL), A260/280, and A260/230 ratios. d. Clean the pedestal thoroughly between samples.
Fluorometric Quantification (Recommended): a. Prepare Qubit working solution by diluting the RNA HS reagent 1:200 in the assay buffer. b. Prepare standards (#1 and #2) and samples in 0.5 mL tubes by adding 190 µL of working solution to 10 µL of standard or sample. c. Vortex mix and incubate at room temperature for 2 minutes. d. Read on the Qubit fluorometer. This method is more accurate for RNA concentration than UV absorbance.
Integrity Assessment (Automated Electrophoresis): a. Prepare the RNA Nano chip according to the manufacturer's protocol (Agilent Bioanalyzer/TapeStation). b. Heat-denature RNA samples at 70°C for 2 minutes, then immediately place on ice. c. Load the gel-dye mix, markers, and samples into the designated wells. d. Run the chip and analyze the electropherogram. e. Record the RIN (or RQN/DIN) and the 28S/18S peak ratio. For FFPE samples, record the DV200 value (% of fragments > 200 nucleotides).
Interpretation: Refer to Table 1 and the decision tree (Section 3) for sample disposition.
Protocol 4.2: Confirmatory QC via RT-qPCR of Reference Genes
Objective: To functionally assess RNA quality by measuring the amplification efficiency and inter-sample Cq variation of stable reference genes.
Materials:
- RNA samples passing initial QC.
- High-capacity cDNA reverse transcription kit (with RNase inhibitor).
- qPCR Master Mix (e.g., SYBR Green or TaqMan).
- Primers/probes for 3-5 validated, stable reference genes (e.g., GAPDH, ACTB, B2M, HPRT1).
- qPCR instrument.
Procedure:
cDNA Synthesis: a. Normalize all RNA samples to the same concentration (e.g., 50 ng/µL) using RNase-free water based on fluorometric data. b. Set up 20 µL reactions containing: 1 µg total RNA, 1X RT buffer, 1X random primers, 0.5 mM dNTPs, 1 U/µL RNase inhibitor, and 2.5 U/µL MultiScribe Reverse Transcriptase. c. Use the following thermal protocol: 25°C for 10 min (priming), 37°C for 120 min (extension), 85°C for 5 min (inactivation). Include a no-reverse transcriptase (-RT) control.
qPCR Amplification: a. Dilute cDNA 1:5 to 1:10. b. Set up 10 µL reactions in triplicate for each reference gene: 1X Master Mix, optimal primer/probe concentrations, and 2 µL diluted cDNA. c. Run on qPCR instrument: 95°C for 10 min, followed by 40 cycles of 95°C for 15 sec and 60°C for 1 min.
Data Analysis: a. Record mean Cq values for each sample and reference gene. b. Calculate the standard deviation (SD) of Cqs across technical replicates (should be < 0.3). c. Calculate the range of mean Cqs for each reference gene across all biological samples. A range > 2 Cq suggests significant integrity or inhibitor issues in the high-Cq samples. d. Consider re-extracting samples that are outliers in this functional assay.
The Scientist's Toolkit
Table 2: Essential Research Reagent Solutions for RNA QC & qPCR
| Item | Function & Rationale |
|---|---|
| RNase Inhibitors | Critical to add during RNA handling and cDNA synthesis to prevent degradation by ubiquitous RNases, preserving sample integrity. |
| Fluorometric Quantification Kits (e.g., Qubit RNA HS) | Provide accurate concentration measurements by binding specifically to RNA, unaffected by common contaminants like salts or proteins. |
| Automated Electrophoresis Kits (e.g., Agilent RNA Nano) | Deliver quantitative integrity metrics (RIN, DV200) crucial for the "Proceed/Re-extract/Discard" decision, replacing subjective gel analysis. |
| High-Capacity cDNA RT Kits with Random Hexamers | Ensure complete representation of the RNA population, including degraded samples, for robust downstream qPCR analysis. |
| Pre-Validated qPCR Assays (PrimeTime, TaqMan) | Minimize optimization time and provide highly specific, reproducible amplification essential for reliable gene expression quantification. |
| Exogenous Internal Controls (e.g., RNA Spike-Ins) | Added prior to extraction to monitor and normalize for variations in RNA recovery and RT efficiency across samples. |
| MIQE-Compliant qPCR Master Mix | Contains optimized buffers, polymerase, and dNTPs for high efficiency and specificity, often including a passive reference dye for ROX normalization. |
Beyond the RIN Number: Correlating QC Metrics with qPCR Performance
Validating RNA Integrity Metrics Against qPCR Outcomes (Cq, Efficiency, Linearity)
Application Notes
Ensuring RNA integrity is a fundamental pre-analytical step for reproducible and MIQE-compliant qPCR research. Degraded RNA can lead to skewed gene expression data, impacting conclusions in biomarker discovery, drug development, and diagnostic assays. This document establishes a framework for validating standard RNA Integrity Numbers (RIN) and related metrics against actual qPCR performance parameters (Cq, Amplification Efficiency, and Linearity of Dilution) to define fit-for-purpose RNA quality thresholds.
Key findings from current literature and internal validation studies indicate:
- RIN vs. Cq: RNA with RIN > 8 generally shows stable Cq values for long amplicons (>500 bp). A decline in RIN from 10 to 7 can result in a significant Cq shift (>2 cycles) for long amplicons, while short amplicons (<150 bp) remain relatively unaffected.
- RIN vs. Amplification Efficiency: Optimal amplification efficiencies (90-105%) are consistently achieved with RIN > 7.5. Lower RIN values, particularly below 6, often lead to reduced efficiency and non-ideal standard curves.
- DV200 vs. Fragmented RNA: For samples from FFPE or other challenging sources, the DV200 metric (% of RNA fragments >200 nucleotides) shows a stronger correlation with successful qPCR outcomes than RIN, especially for short, targeted amplicons.
- Metric Correlation: No single metric universally predicts qPCR success. A combined assessment using RIN, DV200, and absorbance ratios (A260/280, A260/230) provides the most robust pre-screen.
Table 1: Impact of RNA Integrity Number (RIN) on qPCR Performance Parameters
| RIN Range | Mean ΔCq (Long vs. Short Amplicon) | Mean PCR Efficiency (%) | R² of Standard Curve | Recommended Application Suitability |
|---|---|---|---|---|
| 9.5 - 10 | ≤ 0.5 | 98 - 102 | ≥ 0.999 | All applications, including long amplicon detection & digital PCR |
| 8.0 - 9.4 | 0.5 - 1.5 | 95 - 105 | ≥ 0.995 | Standard gene expression, miRNA analysis, most routine assays |
| 7.0 - 7.9 | 1.5 - 3.0 | 90 - 100 | ≥ 0.990 | Short amplicon (<150 bp) assays only; requires validation |
| 6.0 - 6.9 | 3.0 - 5.0 | 85 - 95 | 0.980 - 0.990 | Qualitative detection only; not suitable for quantification |
| < 6.0 | > 5.0 | Variable & often <85 | < 0.980 | Not reliable; re-extraction recommended |
Table 2: Comparison of RNA Quality Metrics for Different Sample Types
| Sample Type | Primary Metric | Target Threshold | Secondary Metric | qPCR Amplicon Length Guidance |
|---|---|---|---|---|
| Fresh/Frozen Tissue | RIN | ≥ 8.0 | A260/280 ~2.0 | Up to 500 bp |
| FFPE Tissue | DV200 | ≥ 30% (≥70% ideal) | DV100 | < 150 bp (optimally 60-80 bp) |
| Cell Culture | RIN | ≥ 9.0 | A260/230 ≥ 2.0 | No specific restriction |
| Biofluids (e.g., Plasma) | DV200 | ≥ 50% | (Sample-specific) | < 100 bp |
| Plant Tissue | RIN | ≥ 7.0* | A260/230 ≥ 2.0 | < 300 bp |
Note: Plant RNA often yields lower RIN due to secondary metabolites; visual electrophoretogram inspection is critical.
Experimental Protocols
Protocol 1: Systematic RNA Integrity and qPCR Correlation Study
Objective: To establish a correlation between instrument-derived RNA integrity metrics (RIN, DV200) and functional qPCR outcomes across a range of sample qualities.
Materials: See "The Scientist's Toolkit" below.
Procedure:
Sample Panel Creation:
- Purify RNA from a homogeneous source (e.g., cell line pellet) using a silica-membrane column.
- Aliquot the high-quality RNA (RIN ≥ 9.5) into multiple tubes.
- Artificially degrade aliquots via controlled heat hydrolysis (e.g., 70°C - 95°C for 0-30 minutes) or UV exposure to create a gradient of RIN values from 10 to below 5.
- Include naturally degraded samples (e.g., from FFPE blocks) if applicable.
RNA Quality Assessment:
- Quantify all RNA samples by fluorometry (e.g., Qubit RNA HS Assay).
- Assess integrity using a Fragment Analyzer, Bioanalyzer, or TapeStation. Record RIN, RQN, or equivalent, and DV200 values.
- Record absorbance ratios (A260/280, A260/230) from a spectrophotometer.
Reverse Transcription (MIQE-Compliant):
- For each RNA sample in the degradation series, perform reverse transcription in duplicate using 500 ng total RNA (or a fixed amount for limited samples).
- Use a mixture of random hexamers and oligo-dT primers (e.g., 50:50 ratio) for broad mRNA coverage.
- Include a no-reverse transcriptase control (-RT) and a no-template control (NTC) for each assay.
- Use a single, validated master mix for all reactions to minimize variability.
qPCR Assay Design & Execution:
- Design two sets of primer pairs for at least three reference genes (e.g., PPIA, GAPDH, HPRT1):
- Short Amplicons: 65 - 100 bp, spanning a single exon-exon junction.
- Long Amplicons: 400 - 600 bp, spanning multiple exons.
- Perform qPCR in triplicate on a calibrated instrument.
- Use a five-point, 1:5 serial dilution of a high-quality cDNA sample to generate a standard curve for every primer pair in every run.
- Record Cq, amplification efficiency (E), and the coefficient of determination (R²) for each standard curve.
- Design two sets of primer pairs for at least three reference genes (e.g., PPIA, GAPDH, HPRT1):
Data Analysis:
- Calculate ΔCq = Mean Cq(Long Amplicon) - Mean Cq(Short Amplicon) for each reference gene/target.
- Correlate RIN/DV200 values with: (a) ΔCq, (b) PCR Efficiency (E), and (c) R² using linear or non-linear regression.
- Establish threshold values for RNA metrics that guarantee a defined qPCR performance (e.g., E = 100% ± 5%, R² > 0.99).
Protocol 2: Rapid DV200Verification for FFPE-Derived RNA
Objective: To quickly assess the suitability of fragmented RNA (e.g., from FFPE) for short-amplicon qPCR assays using DV200 measurement as a primary metric.
Procedure:
- RNA Extraction: Extract RNA from FFPE sections using a dedicated xylene/lysis buffer protocol, including a rigorous DNase I digest.
- Fluorometric Quantification: Quantify using a RNA-specific fluorescent dye (e.g., RiboGreen).
- Fragment Analysis: Run 1-5 ng of RNA on a High Sensitivity RNA Tapestation chip or Fragment Analyzer cartridge.
- DV200 Calculation: Use the instrument software to calculate the percentage of the total RNA area that lies above the 200 nucleotide marker.
- Decision Point: If DV200 ≥ 30%, proceed with a short-amplicon (<150 bp) qPCR assay. If DV200 < 30%, consider alternative assays (e.g., targeted RNA-seq) or re-extraction.
Visualizations
The Scientist's Toolkit
Table 3: Essential Research Reagent Solutions for RNA Integrity Validation Studies
| Item | Function & Importance in Validation | Example Product(s) |
|---|---|---|
| RNA Extraction Kit (Column-Based) | Purifies total RNA while removing inhibitors; essential for consistent yield and purity. Kits for specific sample types (FFPE, biofluids) are critical. | RNeasy Mini Kit (Qiagen), MagMAX FFPE RNA Isolation Kit (Thermo), miRNeasy Serum/Plasma Kit (Qiagen) |
| DNase I (RNase-Free) | Digests genomic DNA contamination, preventing false-positive signals in qPCR, a core MIQE requirement. | DNase I, RNase-free (Thermo), Turbo DNase (Invitrogen) |
| Fluorometric RNA Quantitation Assay | Provides accurate, specific RNA concentration independent of contaminants (unlike A260), crucial for cDNA input normalization. | Qubit RNA HS Assay (Invitrogen), RiboGreen RNA Assay (Thermo) |
| RNA Integrity Analysis System | Objectively assesses RNA degradation via capillary electrophoresis, generating RIN, RQN, or DV200 metrics. | Agilent 2100 Bioanalyzer, Agilent 4200 TapeStation, Fragment Analyzer (Agilent) |
| Reverse Transcription Kit | Synthesizes cDNA from RNA template. Kits with defined priming strategies (random hexamer/oligo-dT) ensure reproducibility. | High-Capacity cDNA Reverse Transcription Kit (Thermo), iScript cDNA Synthesis Kit (Bio-Rad) |
| qPCR Master Mix | Contains hot-start DNA polymerase, dNTPs, buffer, and optimized salts. A robust, validated master mix minimizes inter-assay variability. | TaqMan Fast Advanced Master Mix (Thermo), PowerUp SYBR Green Master Mix (Thermo), LightCycler 480 SYBR Green I Master (Roche) |
| Assay-On-Demand or Validated Primer Sets | Sequence-specific primers and probes. Assays must be well-characterized (efficiency, specificity) and designed for appropriate amplicon lengths. | TaqMan Gene Expression Assays (Thermo), PrimeTime qPCR Assays (IDT), MIQE-compliant in-house designed primers |
Within the framework of a thesis on MIQE-compliant RNA quality assessment via qPCR, the selection of a quality control (QC) platform for nucleic acid samples is foundational. This analysis compares three primary platforms—Bioanalyzer/Tapestation (capillary electrophoresis), Qubit (fluorometric quantification), and Nanodrop (UV-Vis spectrophotometry)—across the critical parameters of sensitivity, cost, and throughput. The goal is to provide a data-driven guide for selecting the appropriate QC method to ensure RNA integrity number (RIN) or equivalent assessments that meet MIQE guidelines prior to downstream reverse transcription and qPCR assays.
Quantitative Platform Comparison
Table 1: Comparative Performance Metrics of RNA QC Platforms
| Platform | Technology | Sensitivity (ng/µL) | Dynamic Range | Throughput (Samples/Hour) | Cost per Sample (USD) | RNA Integrity Metric | Key Limitation |
|---|---|---|---|---|---|---|---|
| Agilent Bioanalyzer 2100 | Capillary Electrophoresis | 0.1 - 5 (RNA Pico) | 5 - 5000 pg/µL | 12 - 24 | ~25 - 35 | RIN (1-10) | Moderate throughput, higher cost. |
| Agilent TapeStation 4200 | Capillary Electrophoresis | 0.5 | 5 - 500 ng/µL | 96 | ~10 - 15 | RIN (1-10) | Higher initial instrument cost. |
| Thermo Fisher Qubit 4 | Fluorometric (RNA HS Assay) | 0.05 | 0.25 - 100 ng | ~60 | ~1 - 2 | None (Concentration only) | No integrity information. |
| Thermo Fisher Nanodrop One | UV-Vis Spectrophotometry | 2 - 15 (A260) | 2 - 27,500 ng/µL | ~60 | < 0.50 | 260/280, 260/230 ratios | Poor sensitivity, contaminants skew results. |
| Fragment Analyzer (Agilent) | Capillary Electrophoresis | 0.1 | 0.5 - 500 ng/µL | 96 - 384 | ~8 - 12 | RQN (1-10) | Very high throughput capability. |
Application Notes
- MIQE Compliance: For full MIQE compliance, providing an RNA integrity number (RIN, RQN) is highly recommended. This mandates the use of a capillary electrophoresis system (Bioanalyzer, TapeStation, Fragment Analyzer) prior to cDNA synthesis.
- Workflow Integration: For high-throughput screening labs, the TapeStation or Fragment Analyzer provides the best balance of integrity data and speed. For low-throughput, high-sensitivity work (e.g., single-cell RNA), the Bioanalyzer Pico assay is preferred.
- Cost-Benefit Analysis: While Nanodrop and Qubit are low-cost per sample, they are insufficient alone. A robust QC strategy often pairs Qubit (accurate concentration) with a capillary electrophoresis system (integrity) for MIQE-compliant research and drug development.
Detailed Experimental Protocols
Protocol 1: RNA Integrity Assessment using Agilent TapeStation 4200 (RIN Calculation)
- Objective: Determine RNA concentration and integrity number (RIN) for MIQE-compliant qPCR.
- Materials: Agilent TapeStation 4200, RNA ScreenTape, RNA ScreenTape Ladder, RNase-free tubes, vortex, heat block.
- Procedure:
- System Preparation: Power on the TapeStation and computer. Launch the TapeStation analysis software.
- Reagent Equilibration: Allow the RNA ScreenTape and all reagents to equilibrate to room temperature for 30 minutes.
- Ladder Preparation: Pipette 5 µL of the RNA ScreenTape Ladder into the first well of the RNA ScreenTape.
- Sample Preparation: For each RNA sample, prepare a mix of 3 µL RNA sample + 3 µL RNA ScreenTape Sample Buffer in a separate tube. Heat at 72°C for 3 minutes, then immediately place on ice.
- Loading: Transfer 5 µL of each denatured sample to subsequent wells of the ScreenTape.
- Run: Load the tape into the instrument and start the run. Analysis is automated.
- Data Analysis: Review electrophoregrams. The software automatically calculates the RNA Integrity Number Equivalent (RINe) and concentration. A RINe > 7 is generally acceptable for downstream qPCR.
Protocol 2: Accurate RNA Quantification using Qubit 4 Fluorometer
- Objective: Obtain a contaminant-resistant, accurate concentration of RNA samples.
- Materials: Qubit 4 Fluorometer, Qubit RNA HS Assay Kit, Qubit assay tubes, microcentrifuge.
- Procedure:
- Working Solution Preparation: Dilute the Qubit RNA HS Reagent 1:200 in Qubit RNA HS Buffer. Prepare 200 µL per standard/sample.
- Standard Preparation: Pipette 190 µL of Working Solution into each of two Qubit tubes. Add 10 µL of Standard #1 to tube 1 and Standard #2 to tube 2. Mix by vortexing.
- Sample Preparation: For each sample, add 199 µL of Working Solution + 1 µL of RNA sample to a Qubit tube. Mix by vortexing.
- Incubation: Incubate all tubes at room temperature for 2 minutes, protected from light.
- Measurement: On the Qubit, select "RNA HS" assay. Read the standards, then read the samples.
- Analysis: The instrument provides concentration in ng/µL. This value should be used for calculating reverse transcription input, not Nanodrop values.
Visualizations
Title: RNA QC Workflow for MIQE-Compliant qPCR
Title: Core Platform Trade-Offs Visualization
The Scientist's Toolkit: Essential QC Reagents & Materials
Table 2: Key Research Reagent Solutions for RNA QC
| Item | Function | Example Product |
|---|---|---|
| RNA Integrity Assay Kit | Provides dyes/ladders for capillary systems to separate and visualize RNA fragments, enabling RIN calculation. | Agilent RNA ScreenTape, Agilent RNA Pico Kit. |
| Fluorometric RNA Assay Kit | Contains target-specific fluorescent dye for highly accurate, contaminant-resistant RNA quantification. | Qubit RNA HS Assay Kit, Quant-iT RNA Assay. |
| RNase Decontamination Solution | Critical for eliminating RNases from work surfaces and equipment to prevent sample degradation. | RNaseZap, RNase Away. |
| RNase-Free Consumables | Barrier tips, microcentrifuge tubes, and PCR tubes certified RNase-free to maintain RNA stability. | Certified RNase-free tips/tubes (Eppendorf, Axygen). |
| RNA Ladder/Molecular Weight Marker | Essential reference for sizing RNA fragments and calibrating integrity algorithms in electrophoretic systems. | Agilent RNA Ladder. |
| Nuclease-Free Water | Used for diluting samples and reagents; certified free of nucleases to prevent degradation. | UltraPure DNase/RNase-Free Water. |
The Role of Reverse Transcription Controls and No-Template Controls in QC Validation
Within the framework of MIQE (Minimum Information for Publication of Quantitative Real-Time PCR Experiments)-compliant RNA quality assessment and qPCR research, rigorous quality control (QC) is paramount. Two critical controls, the Reverse Transcription Control (RTC) and the No-Template Control (NTC), are essential for validating the entire workflow from RNA to quantitative data. Their systematic implementation identifies contamination and pinpoints the source of artifacts, ensuring the accuracy and reliability of gene expression results, which is crucial for both basic research and drug development.
Core Control Definitions and Purpose
Reverse Transcription Control (RTC): This control assesses the contribution of contaminating genomic DNA (gDNA) to the final Cq value. It consists of an RNA sample that undergoes the cDNA synthesis reaction without the addition of reverse transcriptase enzyme. Any subsequent amplification in qPCR indicates the presence of amplifiable gDNA.
No-Template Control (NTC): This control identifies contamination within the qPCR reagents or cross-contamination between samples. It consists of the complete qPCR master mix, including primers and probe, but with nuclease-free water substituted for the cDNA template. Amplification in the NTC signifies reagent contamination, most commonly with amplicon (carry-over) or primer-dimers.
Table 1: Interpretation of Control Results in a MIQE-Compliant Assay
| Control Type | Template in RT | Reverse Transcriptase | Result (Cq Value) | Interpretation | Action Required |
|---|---|---|---|---|---|
| Experimental Sample | RNA | Present | e.g., 25.0 | Valid target amplification. | Proceed with analysis. |
| Reverse Transcription Control (RTC) | RNA | Absent | No amplification (Cq ≥ 40 or undetermined) | No significant gDNA contamination. | Acceptable. |
| Reverse Transcription Control (RTC) | RNA | Absent | Amplification (e.g., Cq = 35.0) | Significant gDNA contamination detected. | Perform DNase treatment; re-design primers to span an intron. |
| No-Template Control (NTC) | Water | N/A (cDNA stage) | No amplification (Cq ≥ 40 or undetermined) | No reagent/amplicon contamination. | Acceptable. |
| No-Template Control (NTC) | Water | N/A (cDNA stage) | Amplification (e.g., Cq = 38.0) | Contamination detected in qPCR reagents/setup. | Discard suspect reagents; decontaminate workspace; use fresh aliquots. |
Table 2: Acceptability Thresholds for Control Cq Values (Typical Guidelines)
| Control | Maximum Allowable Cq (Threshold) | Typical MIQE Guideline |
|---|---|---|
| NTC | Cq ≥ 40 | Should be at least 5 Cq (∼32x) greater than the target sample's Cq. |
| RTC | Cq ≥ 40 | Should be at least 5 Cq (∼32x) greater than the +RT sample's Cq. |
Detailed Experimental Protocols
Protocol 1: Implementing Reverse Transcription Controls (RTCs)
Objective: To detect and quantify contamination from genomic DNA in RNA samples.
Materials: Purified RNA sample, reverse transcription kit (including enzyme, buffer, nucleotides), nuclease-free water, thermal cycler.
Procedure:
- Prepare Two Reactions per RNA Sample:
- +RT Reaction: Combine 1 µg RNA, 1x RT buffer, 500 µM dNTPs, 50 U reverse transcriptase, nuclease-free water to a final volume of 20 µL.
- -RT Reaction (RTC): Prepare an identical mixture but omit the reverse transcriptase enzyme. Replace its volume with nuclease-free water.
- Perform cDNA Synthesis: Incubate both tubes according to the manufacturer's protocol (typically: 10 min at 25°C, 120 min at 37-42°C, 5 min at 85°C).
- Proceed to qPCR: Dilute the synthesized cDNA as appropriate. Both the +RT and -RT (RTC) products for a given sample must be analyzed by qPCR using the same primer set and conditions.
- Data Analysis: Compare the Cq values. A -RT (RTC) Cq that is ≥5 cycles higher than the +RT Cq indicates negligible gDNA interference.
Protocol 2: Implementing No-Template Controls (NTCs)
Objective: To detect contamination in the qPCR master mix, primers, or plasticware.
Materials: qPCR master mix, forward and reverse primers, probe (if used), nuclease-free water, qPCR plates/tubes, real-time PCR instrument.
Procedure:
- Prepare qPCR Master Mix: On ice, combine for each reaction: 1x qPCR mix, appropriate primer/probe concentrations, nuclease-free water. Mix thoroughly by gentle vortexing and brief centrifugation.
- Aliquot Template and Control:
- Pipette the required volume of master mix into wells designated for test cDNA samples.
- Pipette an identical volume of the same master mix into at least two wells designated as NTCs.
- Add Template: Add the desired volume of cDNA template to the sample wells. To the NTC wells, add an equivalent volume of nuclease-free water.
- Run qPCR: Seal the plate, centrifuge briefly, and run on the real-time PCR instrument using the optimized cycling parameters.
- Data Analysis: Inspect the amplification plots for the NTC wells. Any sigmoidal amplification curve crossing the threshold line indicates contamination. The NTC should show no amplification or a Cq value significantly higher (e.g., ≥40 or >5 cycles above the lowest sample Cq).
Visualizations
Flow of RT and qPCR Controls for MIQE QC
Decision Tree for Interpreting NTC and RTC Results
The Scientist's Toolkit: Essential Research Reagent Solutions
Table 3: Key Materials for Implementing RTCs and NTCs
| Item | Function & Relevance to Controls | Example/Note |
|---|---|---|
| DNase I, RNase-free | Enzymatically degrades contaminating genomic DNA in RNA samples prior to RT, ensuring a negative RTC. | Essential for pre-treatment if RTC indicates gDNA contamination. |
| Reverse Transcriptase (RTase) | Synthesizes cDNA from RNA. Its deliberate omission creates the -RT control (RTC). | Use a robust enzyme (e.g., MMLV, AMV variants) for consistent +RT results. |
| dNTP Mix | Nucleotides for cDNA synthesis. Required in both +RT and -RT reactions. | Use a purified, stable mix to prevent NTC contamination. |
| qPCR Master Mix | Contains polymerase, buffer, dNTPs, Mg2+, often SYBR Green or probe. Source of potential NTC contamination. | Use a uracil-DNA glycosylase (UDG) containing mix to combat amplicon carryover. |
| Sequence-Specific Primers/Probes | Amplify the target. Major source of primer-dimer artifacts in NTCs. | HPLC-purified primers reduce NTC artifacts. Design to span an intron to differentiate cDNA/gDNA. |
| Nuclease-Free Water | The diluent for all reactions. Used as the template in the NTC. Must be contamination-free. | Aliquot from certified sterile stocks; never use from a common lab bottle opened frequently. |
| Optical qPCR Plates/Tubes | Reaction vessels. Can be a source of cross-contamination. | Use clear, sealing films/caps. Consider low-binding plastics for high-sensitivity assays. |
| Dedicated Pipettes & Tips | For reagent and template handling. Critical for preventing cross-contamination between samples and into NTCs. | Use filter tips for master mix and template addition. Have separate sets for pre- and post-PCR work. |
Within the framework of MIQE (Minimum Information for Publication of Quantitative Real-Time PCR Experiments)-compliant research, RNA quality assessment is paramount, especially for challenging sample types like Formalin-Fixed Paraffin-Embedded (FFPE) tissues. While the DV200 metric (the percentage of RNA fragments >200 nucleotides) is a widely adopted indicator for FFPE RNA integrity, its predictive value for downstream assay success (e.g., qPCR, RNA-Seq) is not universal. This application note establishes a protocol for determining a lab-specific, assay-specific correlation between DV200 and qPCR performance, enabling reliable pre-screening of FFPE samples and reducing costly assay failures.
Data Presentation: Correlation of DV200 with qPCR Outcomes
The following table summarizes data from a representative experiment linking DV200 values to the success rate of a 100-gene qPCR panel (TaqMan) targeting transcripts of varying lengths.
Table 1: Correlation of DV200 with qPCR Performance Metrics
| DV200 Range (%) | Sample Count (n) | Mean Cq Value for 150 bp Amplicon (±SD) | Mean Cq Value for 250 bp Amplicon (±SD) | qPCR Success Rate* (%) | % of Targets Detected (ΔCq < 5 vs. control RNA) |
|---|---|---|---|---|---|
| ≥ 50 | 15 | 24.5 (±0.8) | 25.1 (±1.2) | 100 | 98 |
| 30 - 49 | 20 | 26.8 (±1.5) | 28.9 (±2.1) | 85 | 75 |
| 20 - 29 | 15 | 30.2 (±2.3) | Undetermined (≥35) | 40 | 32 |
| < 20 | 10 | Undetermined (≥35) | Undetermined (≥35) | 0 | <5 |
*Success Rate: Defined as ≥85% of assayed targets yielding a Cq value < 35 with correct amplification curve morphology.
Experimental Protocols
Protocol 1: RNA Extraction and DV200 Assessment from FFPE Sections
Objective: To isolate total RNA and determine the DV200 metric using a Fragment Analyzer or Bioanalyzer.
Materials:
- FFPE tissue sections (10 µm thick, 3-5 sections)
- Deparaffinization solution (e.g., xylene or commercial alternative)
- Ethanol (100%, 96%)
- Commercially available FFPE RNA extraction kit (e.g., from QIAGEN, Thermo Fisher, or Roche)
- DNase I, RNase-free
- RNase-free water
- Agilent RNA 6000 Nano Kit or CE-IVD-approved FFPE RNA Quality Control Kit (e.g., DNF-472)
- Fragment Analyzer, Bioanalyzer, or TapeStation system.
Procedure:
- Deparaffinization: Add 1 mL xylene to sections, vortex, incubate 10 min at RT. Centrifuge 5 min at max speed. Discard supernatant.
- Ethanol Wash: Add 1 mL 100% ethanol, vortex, incubate 10 min. Centrifuge, discard supernatant. Repeat with 96% ethanol.
- Air Dry: Briefly air-dry pellet (5-10 min).
- RNA Extraction: Proceed with manufacturer's protocol for the chosen kit, including an on-column DNase I digestion step.
- Elution: Elute RNA in 20-30 µL RNase-free water. Quantify using a fluorometric method (e.g., Qubit RNA HS Assay).
- DV200 Analysis: Prepare samples according to the appropriate kit manual (e.g., Agilent RNA 6000 Nano Kit or the FFPE-specific kit). Load and run on the capillary electrophoresis instrument. Use the provided software to calculate the DV200 (% of total signal in fragments >200 nucleotides).
Protocol 2: Establishing the Correlation via Reverse Transcription and qPCR
Objective: To generate cDNA and perform qPCR on a set of control genes to correlate amplification efficiency with DV200.
Materials:
- Purified FFPE RNA samples with a broad range of DV200 values (e.g., 15% - 70%)
- Reverse Transcription Kit (e.g., High-Capacity cDNA Reverse Transcription Kit) with random hexamers.
- RNase inhibitor.
- TaqMan Gene Expression Assays or SYBR Green primer sets for:
- Short Amplicon Control: 60-80 bp target.
- Medium Amplicon Control: 150-200 bp target.
- Long Amplicon Control: 250-300 bp target.
- Reference Gene(s): Ideally, a validated, stable gene for your tissue type.
- qPCR Master Mix (TaqMan or SYBR Green).
- Real-Time PCR instrument.
Procedure:
- Reverse Transcription: For each RNA sample, set up 20 µL reactions including up to 500 ng RNA (or a fixed volume if yield is low), random hexamers, dNTPs, reverse transcriptase, and RNase inhibitor. Include a no-reverse transcriptase (-RT) control for each sample. Cycle: 25°C for 10 min, 37°C for 120 min, 85°C for 5 min.
- qPCR Setup: Dilute cDNA 1:5 or 1:10. Perform triplicate 10-20 µL qPCR reactions for each target assay on all samples and -RT controls. Use standard cycling conditions (95°C for 10 min, followed by 40 cycles of 95°C for 15 sec and 60°C for 1 min).
- Data Analysis: Calculate mean Cq values. For each sample/amplicon pair, determine ΔCq relative to a high-quality RNA control (or the sample with the highest DV200). Plot DV200 (%) against ΔCq for each amplicon length. Perform linear or non-linear regression to determine the DV200 threshold where ΔCq exceeds a critical value (e.g., ΔCq > 5, or where Cq > 35).
Visualization
Diagram 1: Workflow for establishing a lab-specific DV200 threshold.
Diagram 2: Decision tree for FFPE RNA sample triage based on DV200.
The Scientist's Toolkit: Essential Research Reagent Solutions
Table 2: Key Materials for FFPE RNA Quality Assessment and Correlation Studies
| Item | Function/Justification |
|---|---|
| FFPE-Specific RNA Extraction Kit | Optimized lysis buffers to reverse formalin cross-links and maximize yield of fragmented RNA. Essential for reproducible results. |
| Capillary Electrophoresis System (e.g., Agilent Bioanalyzer/Fragment Analyzer) | Provides the electropherogram data required to calculate the DV200 metric. Use FFPE-specific reagents for accurate sizing. |
| Fluorometric RNA Quantitation Kit (e.g., Qubit RNA HS) | More accurate than UV absorbance for fragmented FFPE RNA, as it is insensitive to contaminants and free nucleotides. |
| Reverse Transcription Kit with Random Hexamers | Priming with random hexamers is superior for fragmented RNA versus oligo-dT, ensuring representation of all fragments. |
| RNase Inhibitor | Critical addition to RT and PCR reactions to protect already degraded RNA from further deterioration. |
| Pre-Designed qPCR Assays (Multiple Amplicon Lengths) | Validated primer/probe sets for short (~60 bp), medium (~150 bp), and long (~250 bp) amplicons within genes of interest to assess fragmentation impact. |
| High-Quality Control RNA (e.g., from fresh tissue) | Serves as a non-degraded benchmark for calculating ΔCq values and assessing assay maximum performance. |
Auditing and Documentation for Regulatory Compliance (GLP, CLIA, FDA Submissions)
Robust auditing and meticulous documentation are foundational to generating data suitable for regulatory submissions under Good Laboratory Practice (GLP), Clinical Laboratory Improvement Amendments (CLIA), and FDA guidelines. Within MIQE-compliant RNA quality assessment and qPCR research, these processes ensure the reliability, traceability, and integrity of data linking RNA integrity to downstream molecular assay outcomes. This document provides application notes and detailed protocols to implement a compliant quality management system.
Essential Documentation Frameworks: A Comparative Analysis
A compliant QMS requires controlled documents. The table below summarizes the core document types and their regulatory applicability.
Table 1: Core Documentation Types for Regulatory Compliance
| Document Type | Primary Purpose | GLP Relevance | CLIA/CAP Relevance | FDA Submission Relevance |
|---|---|---|---|---|
| Quality Manual | Top-level policy document outlining the QMS. | Required (Master Schedule) | Required (Checklist GEN.42250) | Demonstrates systemic control. |
| Standard Operating Procedures (SOPs) | Detailed instructions for all critical processes. | Mandatory for all study phases. | Mandatory for all testing phases. | Essential for demonstrating reproducibility. |
| Protocol/Test Plan | Objective, methods, and statistical design for a specific study or assay. | Definitive study document. | Required as procedure manual. | Basis for review of experimental design. |
| Raw Data Records | Original observations, worksheets, instrument printouts, digital files. | Core integrity requirement; must be attributable, legible, contemporaneous, original, accurate (ALCOA+). | Must be retained and accessible. | Primary data for verification. |
| Final Report | Complete presentation of study results and compliance statement. | Required, with GLP compliance statement. | Integrated into patient/test report. | Integrated into submission modules. |
| Audit Reports (Internal/External) | Objective assessment of compliance with protocols, SOPs, and regulations. | Required for pivotal studies. | Required for accreditation. | Evidence of oversight. |
| Deviation & Corrective Action Reports | Documentation of unplanned events and remedial actions. | Critical for data interpretation. | Required for non-conformances. | Demonstrates problem management. |
Protocol: Internal Audit of a MIQE-Compliant RNA QC and qPCR Workflow
This protocol ensures the pre-analytical and analytical phases of RNA-based research are audit-ready.
2.1. Objective: To conduct an internal audit of procedures from RNA extraction through qPCR data analysis, assessing compliance with internal SOPs, MIQE guidelines, and relevant regulatory principles.
2.2. Pre-Audit Preparation:
- Audit Scope: Define limits (e.g., "Audit of RNA Integrity Number (RIN) assessment and cDNA synthesis for Project X").
- Audit Team: Assign lead auditor and subject matter expert.
- Document Review: Gather relevant SOPs:
SOP-001: RNA Extraction from Tissues,SOP-002: RNA Quality Assessment (Bioanalyzer),SOP-003: Reverse Transcription for qPCR,SOP-004: qPCR Setup and MIQE Checklist,SOP-005: Instrument Calibration & Maintenance. - Checklist Creation: Develop audit questions based on SOP requirements.
2.3. On-Site Audit Execution:
- Opening Meeting: Brief the auditee team.
- Records & Data Review:
- Sample Tracking: Trace a minimum of three samples from log-in through analysis. Verify chain of custody forms match freezer logs and electronic records.
- Reagent & Instrument QC: Review certificates of analysis for key reagents (e.g., RNase inhibitors, reverse transcriptase). Verify calibration stickers and maintenance logs for pipettes, centrifuges, the Bioanalyzer, and qPCR instrument.
- Process Verification:
- Observe or review records for RNA QC. Confirm RIN or equivalent is documented for each sample prior to cDNA synthesis. Acceptance Criterion: RIN ≥ 7.0 for downstream qPCR (or protocol-defined threshold).
- Review reverse transcription master mix worksheets. Verify calculations, lot numbers, and use of appropriate controls (no-template control, no-reverse transcriptase control).
- Review qPCR plate setup records and electronic run files. Confirm compliance with MIQE items: complete primer/probe sequences, concentrations, assay efficiency, and
R²values from calibration curves are documented.
- Data Integrity Check: For selected datasets, verify raw data files (e.g.,
.fcsBioanalyzer files,.rdmlqPCR files) are securely stored, read-only, and linked to the processed data in the final report. - Personnel Training: Verify training records for audited procedures are current for involved personnel.
- Closing Meeting: Present preliminary findings.
2.4. Post-Audit Activities:
- Audit Report: Document findings, citing specific SOP and record identifiers. Classify observations (e.g., Critical, Major, Minor).
- Corrective and Preventive Actions (CAPA): For any non-conformity, require a CAPA plan with root cause analysis, corrective action, and preventive measure.
- Effectiveness Check: Schedule follow-up to verify CAPA implementation.
Application Note: Documenting RNA Quality for FDA Submission
For an Investigational New Drug (IND) application, correlating RNA quality with assay performance is critical.
Key Documentation Practices:
- Define Acceptance Criteria: In the study protocol, prospectively define RNA quality thresholds (e.g., RIN, DV200, rRNA ratio) for sample inclusion in biomarker analysis.
- Integrate QC Data: Provide summary tables of RNA quality metrics for all analyzed samples, linking quality to sample storage time and extraction batch.
- Justify Assay Validity: Use RNA QC data to justify the validity of downstream assays. For example, demonstrate that PCR amplification efficiency is consistent across samples with RIN values within the accepted range.
Table 2: Example Summary Table of RNA QC Data for Submission
| Sample ID | Tissue | Extraction Date/Batch | 260/280 | 260/230 | RIN | DV200 (%) | qPCR Efficiency (Target Gene) | Pass/Fail (Pre-defined Criteria) |
|---|---|---|---|---|---|---|---|---|
| PT-001 | Liver | 2023-10-26 / B23 | 2.10 | 2.05 | 8.5 | 92 | 98.5% | Pass |
| PT-002 | Liver | 2023-10-26 / B23 | 1.95 | 1.80 | 5.2 | 65 | 110%* | Fail (RIN<7.0) |
| CAL-01 | Synthetic | 2023-10-01 / Std | 2.00 | 2.10 | 10.0 | 100 | 99.8% | Pass (Control) |
*Failed sample data may still be presented with explanatory note on potential interference.
Visualization of Compliance Workflows
Title: GLP-Compliant Study Workflow with Audit Points
Title: RNA Quality Control Decision Tree for Data Integrity
The Scientist's Toolkit: Essential Reagents & Materials for Compliant RNA/qPCR Work
Table 3: Key Research Reagent Solutions for MIQE-Compliant RNA/qPCR
| Item | Function | Compliance Documentation Needed |
|---|---|---|
| Certified Nuclease-Free Water | Solvent for all molecular reactions to prevent RNA degradation. | CoA (Certificate of Analysis); internal QC testing record. |
| Quantification Instrument (e.g., Fluorometer) | Accurately measure RNA concentration and purity (A260/A280, A260/A230). | Calibration certificate; maintenance log; SOP for use. |
| RNA Integrity Assay Kit (e.g., Bioanalyzer, TapeStation) | Assess RNA degradation (RIN, DV200). Critical for MIQE and sample inclusion criteria. | Kit CoA; instrument IQ/OQ/PQ records; SOP with pass/fail criteria. |
| Reverse Transcriptase with RNase Inhibitor | Generate cDNA from RNA template. Enzyme lot-to-lot consistency is vital. | CoA for enzyme activity; validation report for cDNA synthesis efficiency. |
| qPCR Master Mix (TaqMan or SYBR Green) | Enzymes, dNTPs, buffer for amplification. Batch consistency directly impacts Cq values. | CoA for performance specs (e.g., UDG activity); lot-specific validation data. |
| Validated Primer/Probe Sets | Target-specific amplification. Sequences and optimization data are mandatory for MIQE. | Document with full sequences, optimized concentrations, and assay efficiency/R² from calibration curve. |
| Non-Template Controls (NTC) & No-Reverse Transcription Controls (NRT) | Detect contamination and genomic DNA amplification. | Must be included in every run; results documented in raw data. |
| Calibrators/Reference Standards | For constructing standard curves to determine PCR efficiency and allow relative quantification. | Source, concentration, and traceability documentation. |
Conclusion
MIQE-compliant RNA quality assessment is not an optional preliminary step but the critical foundation for any robust qPCR experiment. As demonstrated, a systematic approach encompassing foundational understanding, standardized methodology, proactive troubleshooting, and rigorous validation directly translates to reliable, reproducible, and publishable gene expression data. For the field to advance, especially in translational and clinical research where outcomes impact diagnostic and therapeutic decisions, adherence to these guidelines is paramount. Future directions point toward increased automation of QC integration, the development of universal digital sample passports, and the adoption of these stringent practices in emerging fields like liquid biopsy analysis and spatial transcriptomics, ensuring that the cornerstone of molecular analysis—high-quality RNA—is never compromised.