Microbial DNA Extraction Mastery: A Comprehensive Guide to Sample Preparation for Accurate Sequencing and Diagnostics
This article provides a complete guide to microbial DNA sample preparation, addressing the critical needs of researchers and drug development professionals.
Microbial DNA Extraction Mastery: A Comprehensive Guide to Sample Preparation for Accurate Sequencing and Diagnostics
Abstract
This article provides a complete guide to microbial DNA sample preparation, addressing the critical needs of researchers and drug development professionals. It covers foundational principles of why sample quality dictates sequencing success, details specialized protocols for diverse sample types like blood, urine, and stool, and offers advanced troubleshooting for challenging matrices. The guide also presents rigorous validation data comparing extraction technologies and methods, empowering scientists to achieve high-yield, inhibitor-free microbial DNA for reliable downstream molecular analysis in both research and clinical diagnostics.
The Critical Role of Sample Preparation in Microbial Genomics
Why Sample Quality is the Cornerstone of Sequencing Success
In next-generation sequencing (NGS), the quality of the input sample is the most significant determinant of success or failure. Even with advanced sequencers and optimized library preparation kits, compromised DNA or RNA can derail an entire sequencing run, leading to inconclusive results, wasted resources, and delayed research outcomes [1]. For microbial DNA extraction, this is particularly crucial, as the genetic material must be pure, intact, and representative of the microbial population for accurate downstream analysis in diagnostics, drug development, and genomic research.
The principle of "garbage in, garbage out" is acutely applicable to sequencing. Enzymatic efficiency in library preparation depends on sample purity, as contaminants inhibit the enzymes responsible for end repair, adapter ligation, and amplification [1]. Furthermore, fragment integrity directly affects sequencing yield and read mapping; highly fragmented DNA leads to inefficient cluster generation and poorer assembly, especially critical when sequencing microbial isolates for antimicrobial resistance profiling or outbreak tracing [1] [2]. Empirical evidence underscores this: an extensive analysis of formalin-fixed, paraffin-embedded (FFPE) tissues demonstrated that samples with high DNA integrity yielded NGS success rates of ~94%, compared to a mere ~5.6% for low-integrity samples [1]. This result highlights that no downstream rescue can fully compensate for poor starting material, making rigorous quality control (QC) the non-negotiable first step in any robust sequencing workflow.
Essential Quality Control Metrics and Assessment Methods
A disciplined, stepwise QC workflow is required to reliably convert raw biological material into sequencing-ready nucleic acids. Post-extraction validation of nucleic acid concentration, purity, and integrity is mandatory before proceeding to library preparation [1]. The following metrics provide a comprehensive picture of sample quality.
Table 1: Essential Quality Control Metrics for Sequencing Sample Preparation
| QC Metric | Assessment Method | Ideal Value/Range | Impact of Deviation from Ideal |
|---|---|---|---|
| Concentration/Mass | Fluorometry (e.g., Qubit with dsDNA BR/HS Assay) [1] [3] | Varies by protocol & sample type | Underloading wastes sequencer capacity; overloading reduces cluster quality [1] |
| Purity (A260/280) | UV Spectrophotometry (e.g., NanoDrop) [1] [3] | ~1.8 (DNA), ~2.0 (RNA) [1] [4] | Ratio <1.8 indicates protein/phenol contamination; >1.8 suggests RNA contamination [3] |
| Purity (A260/230) | UV Spectrophotometry (e.g., NanoDrop) [1] [3] | 2.0–2.2 [3] | Ratio <2.0 indicates salt or organic solvent carryover [3] |
| DNA Integrity/Size | Gel Electrophoresis, Bioanalyzer/TapeStation, Pulsed-Field Gel (>10 kb) [1] [3] [5] | Sharp, high molecular weight band [3] | Fragmentation/shearing leads to inefficient clustering, poorer read mapping, and assembly gaps [1] |
| RNA Integrity (RIN) | Bioanalyzer/TapeStation [4] | 10 (High Integrity) [4] | Low RIN indicates degradation, compromises gene expression analysis [4] |
Practical Assessment of QC Metrics
Quantification: Fluorometric assays (Qubit) are preferred over spectrophotometry for precise quantification because they specifically measure DNA and are not influenced by contaminants like residual RNA or nucleotides [1] [3]. For long-read sequencing platforms like PacBio HiFi, requiring high-molecular-weight (HMW) DNA, a minimum of >500 ng to >2 µg of HMW DNA is recommended for whole-genome sequencing [5].
Purity Checks: The A260/280 and A260/230 ratios are a first screen for contaminants. A low A260/230 ratio, for instance, necessitates additional purification steps, as the sample may contain salts or organic compounds that will inhibit downstream enzymatic reactions [3]. If additional purification is not feasible, PCR amplification can sometimes improve quality for downstream applications [3].
Integrity and Size Assessment: Verifying that DNA is of high molecular weight is critical, especially for long-read sequencing. Conventional agarose gels cannot resolve fragments >15–20 kb, so pulsed-field gel electrophoresis or the Agilent Femto Pulse System is recommended for large fragments [3] [5]. For RNA, the RNA Integrity Number (RIN) provides a standardized score from 1 (degraded) to 10 (intact) [4].
Detailed Experimental Protocols for Microbial DNA Extraction and QC
The following protocols provide methodologies for extracting DNA from microbial isolates and conducting thorough quality control, ensuring the sample is suitable for high-quality sequencing.
Protocol: DNA Extraction from Microbial Isolates using a Universal Bead-Beating Method
This protocol, adapted from the Nanopore NO-MISS workflow, is designed for robust lysis of diverse bacteria and fungi/yeast and is scalable for automation [2].
1. Sample Preparation:
- Harvest 1 ml of a liquid overnight microbial culture (approximately 1 x 10^8 – 10^9 CFU/ml) by centrifugation [2].
- Resuspend the cell pellet thoroughly in phosphate-buffered saline (PBS).
2. Cell Lysis:
- Transfer the resuspended cells to a bead-beating tube (e.g., PowerBead Pro tube).
- Add lysis buffer. For broad-spectrum applications, BashingBead Buffer can be used [2].
- Securely cap the tube and lyse the cells using a vortex adapter or a dedicated bead-beating instrument for a defined duration (e.g., 5-10 minutes).
- For hard-to-lyse organisms like Mycobacterium tuberculosis, the protocol must be tailored. This involves using specialized lysing matrix tubes with glass beads and incorporating lysozyme and achromopeptidase into the lysis buffer to break down tough cell walls [2].
3. DNA Binding and Purification:
- Following bead-beating, centrifuge the tube to pellet debris.
- Transfer the supernatant containing the nucleic acids to a new tube.
- Perform DNA binding, washing, and elution using a commercial column-based or magnetic bead-based kit, such as the NEB Monarch Spin gDNA Extraction Kit or the Promega Maxwell RSC PureFood Pathogen Kit [2].
- Elute the purified genomic DNA (gDNA) in a low-EDTA elution buffer (e.g., 10 mM Tris-HCl, pH 8.0-8.5) compatible with downstream enzymatic steps [1].
Protocol: Quality Control Assessment for Extracted DNA
This procedure outlines the critical checks to perform on the eluted DNA before proceeding to library preparation.
1. Fluorometric Quantification (e.g., Qubit):
- Use the Qubit dsDNA High Sensitivity (HS) or Broad Range (BR) Assay Kit according to the manufacturer's instructions [3] [6].
- This provides an accurate measurement of the double-stranded DNA concentration, which is crucial for calculating the required input for library preparation.
2. Spectrophotometric Purity Assessment (e.g., NanoDrop):
- Dilute 1-2 µL of the eluted DNA in nuclease-free water for the blank measurement.
- Measure the absorbance at 230 nm, 260 nm, and 280 nm.
- Record the A260/280 and A260/230 ratios. Acceptable ranges are ~1.8 for DNA (A260/280) and >1.8 for A260/230 [1] [3]. Significant deviations indicate the need for an additional clean-up step, such as a SPRI bead purification [1].
3. Integrity Analysis (e.g., Gel Electrophoresis or TapeStation):
- For a quick integrity check, run 100-200 ng of the DNA on a 0.8% - 1% agarose gel.
- Intact genomic DNA should appear as a tight, high-molecular-weight band with minimal smearing toward the lower molecular weight region, which would indicate degradation [3] [6].
- For a more quantitative assessment, use an automated electrophoresis system like the Agilent TapeStation or Bioanalyzer, which provides a digital sizing and quantification profile [1].
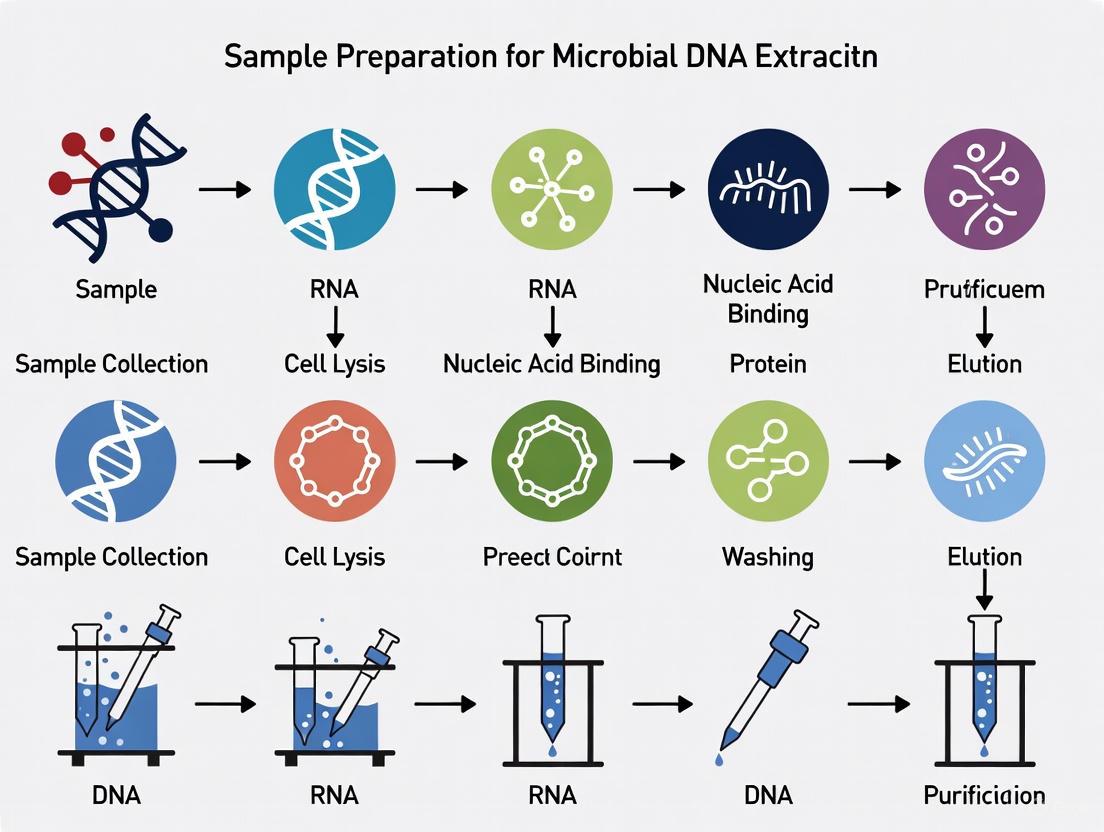
Diagram 1: Microbial DNA extraction and quality control workflow.
The Scientist's Toolkit: Key Reagents and Equipment
Successful sequencing begins with the right tools. The following table details essential reagents, consumables, and equipment for microbial DNA extraction and quality control.
Table 2: Essential Research Reagent Solutions for Microbial DNA Extraction and QC
| Category | Item | Specific Example | Function & Application Notes |
|---|---|---|---|
| Extraction Kits | Nanobind PanDNA Kit [5] | PacBio (PN 103-260-000) | Delivers ultra-clean, high-molecular-weight DNA from blood, tissue, insects, plants, cultured cells, and bacteria. |
| Maxwell RSC PureFood Pathogen Kit [2] | Promega (AS1660) | Automated bead-beating gDNA extraction for high-throughput requirements and universal applications. | |
| QC Instruments | Qubit Fluorometer [1] [3] | Thermo Fisher Scientific | Precisely quantifies dsDNA mass; unaffected by contaminants like RNA. |
| Automated Electrophoresis System [1] [4] | Agilent TapeStation / Bioanalyzer | Assesses DNA/RNA integrity and size distribution (e.g., provides RIN for RNA). | |
| Specialty Reagents | Agencourt AMPure XP Beads [2] | Beckman Coulter (A63881) | SPRI beads for post-extraction clean-up and size selection to remove short fragments. |
| Short Read Eliminator (SRE) Kit [5] | PacBio | Selectively removes DNA fragments below 10 kb, crucial for long-read sequencing. | |
| Enzymes for Lysis | Lysozyme [2] | Sigma (L1667) | Breaks down bacterial cell walls (e.g., for E. coli, K. pneumoniae). |
| MetaPolyzyme [2] | Sigma (MAC4L-5MG) | Enzyme blend for digesting fungal/yeast cell walls. | |
| Consumables | Bead-Beating Tubes [2] | PowerBead Pro Tubes (Qiagen) | Contains ceramics/silica for mechanical disruption of tough cell walls. |
Troubleshooting: Common Sample Quality Issues and Solutions
Even with optimized protocols, challenges can arise. The table below outlines common problems, their potential causes, and evidence-based solutions.
Table 3: Troubleshooting Guide for Microbial DNA Extraction
| Problem | Potential Causes | Recommended Solutions |
|---|---|---|
| Low DNA Yield | Incomplete cell lysis, low starting material, or inefficient elution. | Optimize lysis conditions (e.g., use bead-beating for tough cells, extend lysis time). Use warm elution buffer and incubate on the matrix for 2-3 minutes before centrifuging [1]. |
| Low A260/230 Ratio (Salt Contamination) | Incomplete removal of wash buffer or residual ethanol [3]. | Ensure complete removal of supernatant after ethanol wash steps. Do not overdry the pellet, as this can make re-dissolution inefficient. Perform an additional 70% ethanol wash [1]. |
| Low A260/280 Ratio (Protein Contamination) | Incomplete protein digestion or phenol carryover from organic extraction. | Ensure sufficient Proteinase K digestion during lysis. For column-based kits, ensure complete buffer exchange during washing steps [1] [7]. |
| Fragmented DNA / Low Integrity | Overly vigorous pipetting, vortexing of HMW DNA, or nuclease activity [3] [5]. | Use wide-bore pipette tips. Avoid vortexing DNA samples; instead, mix by gentle flicking or inversion. Aliquot samples to minimize freeze-thaw cycles. Store long-term at -80°C in TE buffer [1] [3]. |
| Presence of Inhibitors | Carryover of polysaccharides (plants), humic acids (soil), or heme (blood) [1] [7]. | Tailor extraction to the sample. For challenging matrices, use additional cleanup steps, specialized buffers (e.g., CTAB for plants), or inhibitor removal columns [1]. |
| High Host (Human) DNA in Microbial Samples | Failure to enrich for microbial cells or lyse human cells. | For metagenomic samples, consider differential lysis steps or probe-based host depletion methods to increase the proportion of microbial sequences [8]. |
Diagram 2: Common sample quality issues and their solutions.
The path to successful sequencing data is paved long before the sample is loaded onto the sequencer. It begins at the very first step: the extraction and rigorous quality control of the nucleic acids. As demonstrated, sample quality is not a peripheral consideration but the very cornerstone of sequencing success, directly impacting enzymatic efficiency, library complexity, and the ultimate accuracy and reliability of the results. By adopting the detailed protocols, standardized QC metrics, and troubleshooting strategies outlined in this application note, researchers and drug development professionals can significantly enhance the reproducibility and quality of their microbial genomics work. Investing time and rigor in sample preparation is the most effective strategy to ensure that a sequencing project is built on a solid foundation, ultimately saving valuable time and resources while generating robust, actionable data.
The efficacy of microbial detection, genotyping, and metagenomic analysis is fundamentally contingent upon the initial quality of the extracted DNA. Effective DNA extraction is the cornerstone of molecular biology research, diagnostics, and forensic applications worldwide [7]. The process is fraught with sample-specific challenges that, if not adequately addressed, can lead to significant bias in downstream results, including false negatives in pathogen detection or distorted representations of microbial community structures [9] [10]. These challenges range from the physical disruption of robust cellular structures to the chemical mitigation of co-purified compounds that inhibit enzymatic reactions. This application note delineates the predominant obstacles encountered during DNA isolation from diverse sample types and provides detailed protocols and solutions tailored to overcome these hurdles, ensuring the acquisition of high-quality genetic material for sensitive downstream applications.
Sample-Specific Challenges and Solutions
The journey to high-quality DNA begins with recognizing and addressing the unique biochemical and physical properties of each sample type. The following sections detail the most common challenges and the strategic approaches required for different categories of samples.
Rigid Cell Walls
The robust structural components of many microbial and plant cells present a primary barrier to efficient DNA extraction.
- Microbial Cell Walls: Gram-positive bacteria, spores, and yeast feature tough cell walls that resist standard lysis methods. For instance, the rigidity of Bacillus cereus spores and the yeast Saccharomyces cerevisiae necessitates rigorous mechanical disruption for efficient DNA recovery [9]. Similarly, the green microalga Chlorella vulgaris is notorious for its resilient cell walls, often cited as a major impediment to DNA extraction [11].
- Plant Tissues: Plant materials are challenging due to their rigid cellulose-based cell walls and the presence of secondary metabolites like polysaccharides and polyphenols, which can co-purate with DNA and interfere with downstream applications such as PCR [7].
Solutions:
- Mechanical Disruption: Bead beating is a widely used method to physically break open tough cell walls. The use of homogenizers, such as the Fisherbrand 850 Homogenizer, can yield higher DNA quantities from tough tissues than bead beating alone [7].
- Chemical and Enzymatic Lysis: Specialized kits, such as the Thermo Scientific GeneJET Plant Genomic DNA Purification Kit, often incorporate polyvinylpyrrolidone (PVP) to bind and remove polyphenolic compounds [7]. For microalgae like C. vulgaris, research indicates that accumulated lipids, rather than the cell wall itself, can be the primary impediment for colony PCR. A simple extraction with TE or SDS buffer, followed by a hexane or phenol-chloroform-isoamyl alcohol step to remove lipids, enables effective PCR amplification [11].
PCR Inhibitors
Various biological samples contain endogenous or exogenous compounds that can co-purify with DNA and potently inhibit the polymerases used in PCR and other enzymatic assays.
- Sources and Types: Blood and other bodily fluids contain inhibitors like heme (from hemoglobin) and mucin. Stool samples are complex matrices rich in bilirubin, bile salts, and complex polysaccharides. Plant tissues contain polysaccharides and polyphenols, while formalin-fixed paraffin-embedded (FFPE) samples can carry over formalin and paraffin [7] [9].
- Impact: These inhibitors can bind directly to the DNA or interact with the DNA polymerase, leading to reduced amplification efficiency, increased cycle threshold (Ct) values in qPCR, or complete amplification failure, resulting in false negatives [9] [12].
Solutions:
- Specialized Lysis and Washing: Protocols for inhibitor-rich samples often incorporate focused lysis and digestion steps. For blood, this involves "forceful but focused lysis and digestion" to break open cells without damaging the DNA, while simultaneously digesting contaminating proteins [7].
- Magnetic Bead Purification: Bead-based chemistries, such as those in the MagMAX product line, are designed to efficiently bind DNA while allowing stringent washes that remove a wide array of PCR inhibitors. These workflows increase throughput and uniformity, promoting high-quality genomic DNA results [7].
- Validation with Inhibition Assays: Incorporating an internal positive control (IPC) in qPCR reactions is critical for detecting the presence of inhibitors. An IPC involves adding a known quantity of exogenous DNA template; a delay in its amplification signal (higher Ct) indicates the presence of inhibitors in the sample [12].
Low Biomass and Complex Samples
Samples with low microbial load or those comprising complex communities present unique challenges for representative and efficient DNA recovery.
- Low Biomass: Samples like potable water or certain clinical swabs may contain very few bacterial cells, making concentration a necessary pre-step to DNA extraction [13].
- Microbiome Studies: Complex communities, such as those found in the human gut or vagina, contain a diverse mix of species with differing cell wall structures. DNA extraction methods must lyse all species equally to avoid biasing the apparent community structure [14] [10].
Solutions:
- Sample Concentration: For water samples, concentrating bacterial cells via membrane filtration prior to DNA extraction is a common and effective strategy [13].
- Method Selection for Representativeness: Studies comparing DNA extraction methods for microbiome research have shown that the choice of method significantly impacts the observed microbial diversity. For example, one study found that the Qiagen DNeasy kit provided the highest DNA yield from vaginal swabs, but a modified MoBio PowerSoil protocol detected a significantly higher alpha diversity, indicating better lysis of a broader range of bacterial species [14]. Phenol-chloroform-isoamyl alcohol extraction often provides the highest DNA yield from a mock microbial community, but may not always provide the most representative profile [10].
Specialized and Fixed Samples
Some samples require specific handling due to their unique preservation or structural properties.
- Formalin-Fixed Paraffin-Embedded (FFPE) Samples: These are among the most challenging samples due to the DNA-protein crosslinks formed by formalin and the embedding paraffin that must be removed. Traditional methods use multiple xylene and ethanol washes, which are tedious and environmentally harmful [7].
- Solution: Automated, safer alternatives are recommended. Systems like the Applied Biosystems AutoLys M Tubes and Caps for deparaffinization, combined with MagMAX FFPE DNA/RNA Isolation chemistry, use heating steps and proteinase K digestion instead of hazardous solvents, streamlining the workflow [7].
Table 1: Summary of Sample-Specific DNA Extraction Challenges and Strategic Solutions
| Sample Type | Primary Challenges | Recommended Solutions |
|---|---|---|
| Blood & Bodily Fluids | PCR inhibitors (heme, mucin) [7] | Focused lysis/digestion; magnetic bead purification [7] |
| Plant Tissues | Rigid cell walls; polysaccharides/polyphenols [7] | Mechanical homogenization; kits with PVP [7] |
| Gram-positive Bacteria & Spores | Tough cell walls resistant to lysis [9] | Intensive mechanical disruption (e.g., bead beating) [9] |
| Microalgae (C. vulgaris) | Accumulated lipids impede DNA release [11] | Lipid removal with organic solvents (e.g., PCI) [11] |
| FFPE Tissues | DNA-protein crosslinks; paraffin embedding [7] | Dewaxing; proteinase K digestion; automated systems [7] |
| Stool & Complex Microbiomes | Diverse inhibitors; mixed community lysis bias [7] [10] | Inhibitor removal technology; method validated for representativeness [7] [14] |
| Low Biomass (Water) | Low concentration of bacterial cells [13] | Cell concentration via filtration [13] |
Quantitative Comparison of DNA Extraction Methods
The performance of DNA extraction methods can be quantitatively evaluated based on yield, purity, and suitability for downstream applications. Different measurement techniques also have varying limits of detection, which is critical for low-concentration extracts.
Performance Across Sample Types
A study evaluating six DNA extraction methods on a mock microbial community found significant variance in DNA yield. The phenol-chloroform-isoamyl alcohol (organic) method consistently produced the highest DNA yields for most bacterial species, significantly outperforming several commercial kits—yielding over 5 times more DNA for Staphylococcus aureus and Propionibacterium acnes [10]. However, high yield does not always correlate with accurate community representation. The same study calculated the Euclidean distance between the observed and expected microbial community structure, finding that some commercial kits (Method 1 & 2) provided a significantly better representation than the organic method and others [10].
DNA Quantification and Purity Analysis
Accurate DNA quantification is vital, and the choice of method depends on the sample concentration and required specificity.
- UV Spectroscopy: Measures absorbance at 260 nm. The A260/A280 ratio indicates protein contamination (pure DNA ~1.8-2.0), and the A260/A230 ratio indicates contamination from salts or organic compounds (pure DNA ~1.8-2.2). Its reproducibility decreases significantly for concentrations below ~17.5 ng/μL [9].
- Fluorometry: More specific for DNA than UV spectroscopy and far more sensitive, with a typical limit of detection as low as 0.00025 ng/μL. It is less affected by contaminants like RNA [9].
- qPCR: The most specific method, as it only quantifies the target sequence that is intact and accessible. It is also the most sensitive, with limits of quantification (LOQ) reported as low as 0.000767 ng/μL for S. cerevisiae. It is the only method that can directly detect the presence of PCR inhibitors via an internal positive control [9].
Table 2: Limits of Quantification (LOQ) for DNA Concentration Measurement Methods
| Measurement Method | Limit of Quantification (LOQ) | Key Characteristics |
|---|---|---|
| UV Spectroscopy | ~3.5 ng/μL [9] | Affected by RNA, free nucleotides, and other contaminants [9]. |
| Fluorometry | ~0.25 ng/μL [9] | More DNA-specific than UV spectroscopy; sensitive [9]. |
| qPCR | Varies by target; e.g., 7.67x10⁻⁴ ng/μL for S. cerevisiae [9] | Target-specific; confirms amplifiability and detects inhibitors [9]. |
Detailed Experimental Protocols
Protocol 1: In-House Guanidinium Thiocyanate DNA Extraction for Water Samples
This protocol is designed as a cost-effective and reproducible method for extracting DNA from bacterial cells concentrated from water samples [13].
Materials and Reagents:
- Lysis Buffer: 120 g guanidinium thiocyanate dissolved in 100 mL of 0.1 M Tris-HCl (pH 6.4), with 22 mL of 0.2 M EDTA (pH 8.0) and 2.6 mL Triton X-100 added after heating to 60°C.
- Washing Buffer: 120 g guanidinium thiocyanate in 100 mL of 0.1 M Tris-HCl (pH 6.4).
- Celite suspension, 100% Ethanol, 70% Ethanol.
- Prepared spin columns (0.5 mL tube with silica membrane).
Procedure:
- Cell Concentration: Filter the water sample through a polycarbonate membrane. Place the membrane in a cryovial with 2.5 mL sterile distilled water and vortex for 2 minutes. Transfer the suspension to a 2 mL tube.
- Pellet Cells: Centrifuge at 13,000 × g for 10 minutes. Discard the supernatant.
- Cell Lysis: Add 1000 μL of lysis buffer to the pellet. Incubate at 70°C for 10 minutes.
- DNA Binding: Add 200 μL of 100% ethanol to the tube and mix gently. Incubate at room temperature for 10 minutes.
- Silica Binding: Transfer 400 μL of the lysate to a prepared spin column. Centrifuge at 13,000 × g for 1 minute to bind DNA to the silica membrane. Discard the flow-through.
- Wash: Add 500 μL of wash buffer to the column and centrifuge as before. Discard the flow-through. Repeat with 500 μL of 70% ethanol.
- Elution: Centrifuge the empty column for 1 minute to dry the membrane. Transfer the column to a clean 1.5 mL tube and elute DNA by adding 50-100 μL of pre-warmed (70°C) elution buffer (e.g., TE) or nuclease-free water. Centrifuge for 1 minute. The eluate contains the purified DNA.
Protocol 2: Thermo-Osmotic DNA Extraction for Contingency and Field Use
This minimalist protocol uses only boiling water to lyse cells and is suitable for highly enriched, uncomplicated samples (e.g., fungal mycelia, buccal swabs) in resource-limited settings [15].
Materials and Reagents:
- Commercially available distilled water.
- 70% Ethanol (for surface sterilization).
- 1.5 mL and 0.2 mL microtubes.
Procedure:
- Sample Collection: Collect the sample (e.g., by swabbing the inner cheek or excising a piece of fungal mycelium) and place it in a 1.5 mL microtube.
- Heat Lysis: Fill a 50 mL Falcon tube halfway with distilled water and place it in a beaker half-filled with tap water acting as a water bath. Boil the water bath. Use a Pasteur pipette to add 200-500 μL of boiling water to the sample tube. Close the lid and stir vigorously.
- Incubation: Place the sample tube in the floating rack within the boiling water bath. Incubate for 20-30 minutes.
- Crude Lysate and Dilution: The resulting crude lysate can be directly used for PCR. To optimize the DNA-to-inhibitor ratio, prepare two decimal serial dilutions (1:10 and 1:100) of the lysate using distilled water.
- Direct PCR: Use 2–5 μL of the crude lysate and each dilution as a template in direct PCR to determine which provides the best amplification.
Workflow and Strategic Selection
The following workflow diagram outlines the logical process for selecting an appropriate DNA extraction strategy based on sample properties and research goals.
The Scientist's Toolkit: Key Research Reagent Solutions
Table 3: Essential Reagents and Kits for Overcoming DNA Extraction Challenges
| Reagent/Kit | Primary Function | Application Context |
|---|---|---|
| Guanidinium Thiocyanate | Chaotropic salt; denatures proteins, promotes nucleic acid binding to silica [13]. | Core component of in-house and kit-based lysis/binding buffers [13]. |
| PVP (Polyvinylpyrrolidone) | Binds and removes polyphenolic compounds from plant extracts [7]. | Added to plant-specific DNA extraction protocols to improve purity [7]. |
| Magnetic Beads (e.g., MagMAX kits) | Solid phase for DNA binding; enables efficient washing to remove inhibitors [7]. | High-throughput purification from diverse samples (blood, tissue, microbes) [7]. |
| Phenol:Chloroform:Isoamyl Alcohol | Organic extraction; denatures and removes proteins and lipids [11] [10]. | Effective for lipid-rich samples (e.g., microalgae) [11]; yields high DNA [10]. |
| Proteinase K | Broad-spectrum serine protease; digests proteins and nucleases [7]. | Essential for lysis of protein-rich tissues and de-crosslinking FFPE samples [7]. |
| RNase A | Degrades RNA to prevent contamination of DNA extracts [7]. | Used in tissue DNA extraction to reduce RNA contamination and improve quality ratios [7]. |
| Spin Columns with Silica Membrane | Solid phase for DNA binding, washing, and elution in a simple format [13]. | Foundation of many commercial kits; suitable for most sample types [13]. |
Navigating the landscape of sample-specific challenges in DNA extraction is a critical first step in any robust molecular biology pipeline. As demonstrated, a one-size-fits-all approach is ineffective. Success hinges on selecting a tailored strategy that accounts for the sample's physical structure, biochemical composition, and the specific requirements of the downstream application. By understanding the nature of challenges such as rigid cell walls, PCR inhibitors, and low biomass, and by leveraging the appropriate tools and protocols—from mechanical homogenization and specialized kits to minimalist field protocols—researchers can consistently obtain high-quality DNA. This ensures the reliability, accuracy, and reproducibility of their data, from clinical diagnostics and forensic analysis to groundbreaking microbial ecology research.
Within the broader context of sample preparation for microbial DNA extraction research, the success of downstream applications—from quantitative PCR (qPCR) to next-generation sequencing (NGS)—is fundamentally dependent on the quality of the isolated nucleic acids. For researchers and drug development professionals, accurately assessing DNA quality is not merely a preliminary step but a critical determinant of data reliability and experimental reproducibility. This protocol outlines the essential quality control (QC) metrics—yield, purity, and integrity—for evaluating microbial DNA. We provide detailed methodologies for their measurement, supported by structured data and practical workflows, to ensure that extracted DNA meets the stringent requirements of modern molecular analyses.
Key Quality Metrics: Definition and Significance
The quality of microbial DNA can be deconstructed into three primary, measurable metrics. A comprehensive understanding of each is vital for interpreting QC results and ensuring sample suitability.
DNA Yield
DNA yield refers to the total quantity of DNA recovered from a sample. It is a primary indicator of extraction efficiency.
- Measurement Techniques: Yield is most commonly quantified using spectrophotometry (absorbance at 260 nm) or the more sensitive and DNA-specific fluorometry [16] [17].
- Spectrophotometric Considerations: Absorbance measurements are reliable only within a specific range (A260 between 0.1 and 1.0). Highly concentrated samples require dilution, whereas measurements at low concentrations can be skewed by contaminants or dust [16].
- Comparative Performance: A recent study comparing quantification methods found that qPCR (using Cycle Threshold values) demonstrated the highest precision (CV of 4.0%), followed by fluorometry (CV of 17.54%). Spectrophotometry showed the highest variability (CV of 21.28%), making it less reliable for precise yield determination despite its convenience [17].
DNA Purity
DNA purity assesses the presence of contaminants that can inhibit enzymatic reactions in downstream applications. It is evaluated using absorbance ratios [18] [16] [19].
Table 1: Spectrophotometric Purity Ratios and Their Interpretation for Microbial DNA
| Purity Ratio | Ideal Value for Pure DNA | Significance | Common Contaminants Indicated by Low Ratios |
|---|---|---|---|
| A260/A280 | ~1.8 [16] [19] | Indicates protein or phenol contamination. A ratio ≤1.6 suggests significant contamination [18] [16]. | Proteins, Phenol [18] [19] |
| A260/A230 | 2.0 - 2.2 [16] [19] | A sensitive indicator of organic compound contamination. Values below the ideal range suggest the presence of salts or reagents [18]. | Chaotropic salts (e.g., guanidine HCl), EDTA, carbohydrates, detergents (e.g., Triton X-100) [18] [16] |
- Critical Considerations:
- The pH and ionic strength of the solvent can affect A260/A280 values. Acidic solutions may under-represent the ratio by 0.2–0.3, while basic solutions may over-represent it [16] [19].
- The A260/230 ratio is particularly sensitive and can be unstable when DNA is eluted in a saline buffer, as salts absorb strongly at 230 nm [16].
DNA Integrity
DNA integrity refers to the degree of fragmentation of the DNA molecules. Intact, high-molecular-weight (HMW) DNA is essential for applications like long-read sequencing.
- Assessment Methods:
- Gel Electrophoresis: The traditional method where genomic DNA appears as a tight, high-molecular-weight band. Degradation is visualized as a smear of lower molecular weight fragments [16] [20].
- Automated Electrophoresis: Systems like the Agilent TapeStation provide a standardized DNA Integrity Number (DIN), which is an objective score for qualifying DNA samples for NGS workflows. A higher DIN (scale of 1-10) indicates better integrity [21].
- Fluorometric Correlation: Similar results for DNA quantification by both spectrophotometry and fluorometry (PicoGreen assay) suggest high DNA integrity, as the PicoGreen measurement is strongly affected by fragmentation [16].
Detailed Experimental Protocols for Quality Control
Protocol 1: Purity and Yield Measurement via Microvolume Spectrophotometry
This protocol, adapted from established nucleic acid purity measurement assays, details the use of a Nanodrop spectrophotometer for the analysis of microbial DNA samples [18].
Research Reagent Solutions
Table 2: Essential Materials for Spectrophotometric Measurement
| Item | Function/Description |
|---|---|
| Nanodrop 2000/8000 Spectrophotometer | Microvolume spectrophotometer for measuring sample absorbance using minimal volume (0.5–5.0 μL) [18]. |
| Nuclease-free Water | Used for blanking the instrument and cleaning pedestals. Serves as a zero-reference [18]. |
| Lint-free Lab Wipes | For cleaning the upper and lower measurement pedestals without introducing fibers or contaminants [18]. |
| Elution Buffer | The buffer used to dissolve the DNA during extraction. It is used as the blanking solution for accurate baseline measurement [18]. |
Step-by-Step Procedure
Initialization and Cleaning:
- Open the Nanodrop software and select the appropriate measurement type (e.g., "Nucleic Acid," then "dsDNA").
- Pipette 2 µL of nuclease-free water onto the lower measurement pedestal and lower the arm. After one minute, wipe both pedestals dry with a lint-free wipe [18].
Blank Measurement:
- Load 2 µL of the elution buffer (the blank) onto the pedestal and lower the arm. Click "Blank" to measure and store the reference spectrum.
- After measurement, clean both pedestals thoroughly.
- To verify the baseline, load another 2 µL of blank and click "Measure." The absorbance at 260 nm should not vary more than 0.04 from the baseline. If it does, repeat the cleaning and blanking process [18].
Sample Measurement:
- Enter the sample ID in the software.
- Pipette 2 µL of the microbial DNA sample onto the pedestal and lower the arm. Click "Measure."
- After the measurement, wipe the pedestals clean before proceeding to the next sample.
- Record the concentration (yield, in ng/µL), A260/A280, and A260/230 ratios for each sample [18].
Data Interpretation:
- Review the spectral overlay for abnormal patterns. A pure DNA sample typically shows a peak at 260 nm.
- Compare the recorded purity ratios against the ideal values in Table 1 to assess sample quality.
The following workflow summarizes the key steps for assessing microbial DNA quality:
Protocol 2: Integrity Analysis Using Automated Electrophoresis
For a more objective and quantitative assessment of DNA integrity, automated electrophoresis systems are recommended.
Research Reagent Solutions
- Agilent TapeStation System with Genomic DNA ScreenTape Assay: Provides automated electrophoretic separation, sizing, quantification, and integrity analysis via the DNA Integrity Number (DIN) [21].
- PicoGreen dsDNA Assay Kit: A fluorometric method that uses an intercalating dye for highly sensitive quantification of dsDNA; significant discrepancies with spectrophotometric concentration can indicate fragmentation or contamination [16].
Step-by-Step Procedure
Sample and Reagent Preparation:
- Follow the manufacturer's instructions for preparing the Genomic DNA ScreenTape assay reagents and samples. Typically, a small volume of DNA (e.g., 1 µL) is mixed with a specific loading buffer.
Instrument Operation:
- Load the prepared samples and the ScreenTape into the TapeStation instrument.
- Initiate the run through the controlling software. The system automatically performs electrophoresis, data capture, and analysis.
Data Analysis:
- The software generates an electrophoretogram and assigns a DIN score (1-10) to each sample.
- Interpreting DIN Scores: A high DIN (e.g., >7) indicates intact genomic DNA, ideal for long-read sequencing. A lower DIN suggests fragmentation, which is common in samples from challenging sources like formalin-fixed paraffin-embedded (FFPE) material but may still be suitable for certain NGS applications like amplicon sequencing [21].
- Visually inspect the electrophoretogram for a single, sharp high-molecular-weight band and the absence of a low-molecular-weight smear.
The Scientist's Toolkit: Essential Reagents and Equipment
The following table catalogs key solutions used in the protocols above and other relevant reagents for microbial DNA extraction and QC.
Table 3: Research Reagent Solutions for Microbial DNA Extraction and Quality Control
| Reagent / Kit Name | Function / Application |
|---|---|
| MGIEasy Stool Microbiome DNA Extraction Kit II | Extracts microbial genomic DNA from complex samples like human stool, saliva, and swabs. Designed for low-bias extraction of Gram-positive and Gram-negative bacteria, fungi, and protozoa [22]. |
| Chelating Resin | A non-toxic, cost-effective resin used in DNA isolation methods. It purifies nucleic acids by binding metal ions and positively charged proteins [23]. |
| Proteinase K | A broad-spectrum serine protease used to digest cellular proteins and facilitate cell lysis during DNA extraction, improving yield [23]. |
| Prelysis Bleaching (2.5% NaOCl) | A chemical treatment used to degrade external contaminants on insect or specimen bodies prior to DNA extraction, reducing environmental DNA contamination for microbiome studies [23]. |
| NIBSC WC-Gut RR (Whole Cell Reference Reagent) | A standardized whole cell reagent comprising 20 gut bacterial strains. Used to evaluate and benchmark the performance and bias of DNA extraction kits specific to gut microbiome research [20]. |
| Phenol-Chloroform | Used in purification to hydrolyze and remove proteins from the nucleic acid solution during extraction. Proteins collect at the interphase between the organic and aqueous phases [24]. |
The rigorous assessment of microbial DNA yield, purity, and integrity is a non-negotiable prerequisite for generating robust and reproducible data in genomics research. As demonstrated, a combination of spectrophotometric, fluorometric, and electrophoretic methods provides a comprehensive picture of DNA quality. Adopting standardized protocols and utilizing appropriate controls, such as whole cell reference reagents, allows researchers to accurately qualify their starting material, benchmark their methods, and confidently select samples fit for purpose. This disciplined approach to quality control is foundational to advancing research and development in microbiology and drug discovery.
The choice of starting material is a critical foundational step in microbial genomics that profoundly influences the success of all downstream molecular analyses. While fresh, pure cultures represent the gold standard for DNA extraction, research increasingly requires direct analysis of complex matrices such as clinical specimens, environmental samples, and preserved archives to understand microbial communities in their native contexts [10] [25]. This application note examines the technical challenges and methodological considerations for DNA extraction across this spectrum of starting materials, providing structured experimental data, optimized protocols, and decision frameworks to guide researchers and drug development professionals in their sample preparation strategies.
The fundamental challenge lies in the vastly different compositional characteristics of these materials. Fresh cultures of laboratory-adapted strains offer homogeneous cells with intact walls, suspended in a defined, contaminant-free medium. In contrast, complex samples like soil, feces, or clinical tissues contain diverse microbial populations with varying cell wall structures, embedded within matrices rich in inhibitors such as humic acids, polyphenols, polysaccharides, and proteins that can compromise DNA yield, purity, and representativeness [10] [26] [27]. Recognizing and methodologically addressing these differences is paramount for obtaining DNA that accurately represents the microbial community for subsequent applications including sequencing, PCR, and genotyping.
Comparative Performance of DNA Extraction Methods Across Sample Types
The efficacy of DNA extraction methods varies significantly depending on the starting material. Key performance metrics include DNA yield, purity, degree of shearing, and most critically, how well the extracted DNA represents the original microbial community structure without introducing bias.
Table 1: Comparison of DNA Extraction Method Performance Across Sample Types
| Extraction Method | Optimal Starting Material | DNA Yield | Community Representativeness | Key Limitations |
|---|---|---|---|---|
| Phenol-Chloroform-Isoamyl Alcohol | Human microbiome mock community [10] | Highest (5.7-fold higher for some species) [10] | Moderate [10] | Use of hazardous organic solvents; more variable between experimenters [10] |
| Commercial Kit (Method 1 & 2) | Human microbiome mock community [10] | Moderate [10] | Good (Significantly better representation) [10] | Standardized protocols may not suit all sample types [10] |
| CTAB-Based Protocol | Plant materials (high polysaccharide/polyphenol content) [27] | High [27] | N/A (For single organisms) | Requires optimization for different plant orders [27] |
| Exogenous Plasmid Isolation | Broiler cecal samples (Complex microbiota) [25] | N/A (Functional capture) | Good for conjugative plasmids | Captures only mobile plasmids; relies on conjugation efficiency [25] |
| Magnetic Bead-Based (SafeCAP 2.0) | Plasma (Cell-free DNA) [28] | High (LoD: 0.3 pg/µL) [28] | N/A (For fragmented cfDNA) | Optimized for short, fragmented DNA [28] |
The selection of an extraction method inevitably introduces bias. For instance, a systematic evaluation of six DNA extraction methods for human microbiome studies found that the observed microbial community structure significantly differed from the expected composition regardless of the method used [10]. Some methods consistently over-represented certain species like L. iners DSMZ 13335, while others under-represented species like C. tuberculostearicum and P. acnes [10]. This underscores the critical importance of matching the extraction methodology not just to the sample type, but to the specific research question.
Detailed Experimental Protocols for Diverse Sample Types
Modified CTAB Protocol for Complex Plant Materials
Principle: The CTAB (cetyl trimethylammonium bromide) method effectively separates DNA from polysaccharides and polyphenols that are abundant in plant seeds and crops, which can co-precipitate with DNA using standard protocols [27].
Reagents:
- 3× CTAB Extraction Buffer: 3% CTAB (w/v), 1.4 M NaCl, 0.8 M Tris-HCl (pH 8.0), 0.5 M EDTA (pH 8.0)
- 0.3% 2-β-Mercaptoethanol (added fresh)
- Chloroform:Isoamyl alcohol (24:1 v/v)
- 6 M NaCl
- 3 M Potassium acetate
- Ice-cold 100% Isopropyl alcohol
- 70% Ethanol
- 1× TE buffer
Procedure:
- Cell Lysis: Grind 50 mg of plant sample in liquid nitrogen. Add 800 μL of pre-heated CTAB extraction buffer (65°C) containing 0.3% 2-β-mercaptoethanol. Incubate at 60-65°C for 1 hour, mixing by inversion every 20 minutes [27].
- Deproteinization: Add an equal volume of Chloroform:Isoamyl alcohol (24:1), mix by inversion, and centrifuge at 13,000 rpm for 15 minutes. Transfer the upper aqueous phase to a new tube. Repeat until the interface is clear [27].
- Precipitation: To the aqueous phase (~700 μL), add 350 μL of 6 M NaCl and 70 μL of 3 M potassium acetate. Simultaneously add 500 μL of ice-cold 100% isopropyl alcohol and invert gently until DNA threads form. Incubate at -20°C for 30 minutes [27].
- Wash and Resuspend: Centrifuge at 13,000 rpm for 5 minutes. Discard supernatant, wash the pellet with 500 μL of 70% ethanol, air-dry, and resuspend in 50 μL of TE buffer. Incubate at 50°C for 1-2 hours to ensure complete resuspension [27].
Validation: The isolated DNA should be suitable for PCR amplification (e.g., with RAPD primers) and complete digestion with restriction enzymes like HindIII, confirming its quality for downstream molecular applications [27].
Protocol for Plasmid DNA Extraction from Complex Microbiomes
Principle: Exogenous plasmid isolation captures mobile genetic elements directly from complex samples through conjugation, enabling the study of antibiotic resistance gene transfer in a One Health context [25].
Reagents:
- Broiler cecal samples (lyophilized)
- Non-selective Muller-Hinton agar
- Muller-Hinton broth
- Recipient bacterial strain (e.g., E. coli)
- Antibiotics for selection
Procedure:
- Sample Preparation: Resuspend 0.01 g of lyophilized cecal sample in 0.85% NaCl [25].
- Exogenous Mating: Mix the sample suspension with a recipient bacterium (e.g., E. coli). This can be performed on a filter placed on non-selective agar or in a liquid medium to allow conjugative plasmid transfer [25].
- Selection: After a suitable mating period, plate the mixture on selective media containing antibiotics to select for transconjugants that have received resistance plasmids [25].
- Plasmid Analysis: Isect plasmids from transconjugants using a commercial plasmid miniprep kit. Analyze plasmids through restriction digestion and electrophoresis to profile the captured resistance plasmids [25].
Advantages and Limitations: This method functionally captures conjugative plasmids that are mobile within the complex microbial community, providing insight into transferable antibiotic resistance. However, it may miss non-conjugative plasmids and those that cannot be maintained in the recipient host [25].
Optimized Protocol for Degraded Archival Clinical Samples
Principle: Adapting ancient DNA techniques enables the recovery of genetic material from formalin-fixed, paraffin-embedded (FFPE) samples where DNA is highly fragmented and cross-linked [29].
Reagents:
- FFPE tissue sections
- Xylene or other deparaffinization agents
- Proteinase K
- Optimized lysis buffer
- Magnetic bead-based purification system
- Reagents for short-fragment library preparation
Procedure:
- Deparaffinization: Remove paraffin wax with xylene followed by ethanol washes to rehydrate the tissue [29].
- Lysis and Digestion: Incubate tissues in a lysis buffer containing high concentrations of proteinase K to reverse formaldehyde cross-links and digest proteins. This may require extended incubation times (up to 24-48 hours) [29].
- DNA Purification: Use magnetic bead-based clean-up systems specifically designed for short fragments. Avoid size selection steps that might discard the target degraded DNA [29].
- Library Preparation: Employ library preparation protocols that preserve and repair ultra-short DNA fragments, including modified end-repair and adapter ligation chemistries that accommodate damaged ends [29].
Downstream Analysis: Sequence the resulting libraries and analyze with a bioinformatics pipeline designed for ancient/damaged DNA, which can accurately align fragmented sequences and account for damage patterns like cytosine deamination [29].
Workflow Visualization and Decision Framework
The selection of an appropriate DNA extraction strategy depends on the starting material and research objectives. The following workflow provides a systematic decision path for method selection.
The Scientist's Toolkit: Essential Research Reagent Solutions
Successful DNA extraction from challenging samples requires specific reagents tailored to overcome particular obstacles. The following table details key solutions for different sample types.
Table 2: Essential Research Reagents for DNA Extraction from Diverse Sample Types
| Reagent/Chemical | Function/Purpose | Application Context |
|---|---|---|
| CTAB (Cetyl Trimethylammonium Bromide) | Precipitates DNA while leaving polysaccharides in solution; disrupts cell membranes [27]. | Plant materials rich in polysaccharides and polyphenols [27]. |
| 2-β-Mercaptoethanol | Powerful reducing agent that denatures proteins and inhibits polyphenol oxidation by neutralizing tannins [27]. | Plant and environmental samples with high phenolic content [27]. |
| Magnetic Beads (Functionalized) | Solid-phase support for DNA binding under high-salt conditions; enables efficient washing and elution [28] [30]. | Cell-free DNA extraction, automated workflows; ideal for short, fragmented DNA [28]. |
| Proteinase K | Broad-spectrum serine protease that digests histones and other cellular proteins; crucial for reversing cross-links [29]. | Archival FFPE tissues and samples with hard-to-lyse organisms [2] [29]. |
| Guanidine Hydrochloride/Salt | Powerful chaotropic agent that denatures proteins, inhibits nucleases, and promotes DNA binding to silica/magnetic beads [28]. | Lysis and binding buffer component for most commercial kits; critical for cfDNA isolation [28]. |
| Polyethylene Glycol (PEG) | Precipitant for large DNA molecules and plasmids; used in differential precipitation to separate plasmid from genomic DNA [25]. | Plasmid isolation from complex samples; concentration of large nucleic acids [25]. |
The impact of starting material on DNA extraction success cannot be overstated. While fresh cultures allow for standardized, high-yield DNA isolation, the future of microbial research lies in navigating the complexity of direct clinical and environmental samples. The methodologies detailed herein—from the CTAB protocol for inhibitor-rich plants to exogenous isolation for mobile plasmids and ancient DNA techniques for archival tissues—provide a toolkit for researchers to overcome these challenges. The consistent themes across all protocols are the need for method validation and the recognition that no single method is universally optimal. The choice of extraction strategy must be guided by the sample matrix, the target nucleic acid, and the specific downstream analytical applications. By applying these principles and protocols, researchers can generate more reliable, representative genomic data, advancing our understanding of microbial communities in health, disease, and the environment.
Optimized DNA Extraction Protocols for Diverse Microbial Samples
Sample preparation is a critical upstream step in molecular analytical workflows for microbial research, directly impacting the quality and reliability of downstream results such as PCR, sequencing, and cloning [31]. The choice of DNA extraction method can influence DNA yield, purity, process time, and suitability for automation. Among the available solid-phase extraction techniques, silica-based methods dominate modern laboratories, primarily implemented through two key technologies: spin columns and magnetic beads. This application note provides a detailed comparison of these two chemistries, supported by quantitative data and standardized protocols, to guide researchers in selecting the optimal method for their specific microbial DNA extraction needs.
Principles of Silica-Based DNA Binding
Both column-based and magnetic bead-based methods operate on the same fundamental principle: the selective binding of negatively charged DNA molecules to a silica surface in the presence of a chaotropic salt-based binding buffer [32] [31]. These high-salt conditions disrupt the hydrogen-bonding network of water molecules, allowing nucleic acids to bind preferentially to the silica matrix while proteins and other contaminants remain in solution. The bound DNA is subsequently washed to remove residual impurities, followed by elution in a low-salt buffer or water, which rehydrates the nucleic acids and releases them from the silica surface [33].
Technology Comparison: Performance and Applications
Direct Performance Metrics
Recent studies provide quantitative comparisons between magnetic bead and spin column-based extraction methods across critical performance parameters.
Table 1: Direct Performance Comparison of DNA Extraction Methods
| Performance Parameter | Magnetic Bead Method | Spin Column Method | Reference/Context |
|---|---|---|---|
| DNA Yield | 94–96% recovery [34] | 70–85% recovery [34] | PCR cleanup protocols |
| Typical Extraction Time | 6–7 minutes (SHIFT-SP method) [31] | ~25 minutes [31] | Optimized silica-based protocols |
| Sensitivity in Clinical Samples | 29-fold more satDNA detected at 100 Par. Eq./mL [35] | Baseline detection | Chagas disease diagnosis (qPCR) |
| Purity (A260/280) | 1.88 ± 0.02 [35] | 1.69 ± 0.03 [35] | Blood samples spiked with T. cruzi |
| Processed Sample Volume | High (easily scalable) [32] | Limited by column size [36] | General workflow suitability |
| Automation Compatibility | Excellent (96-well & automation) [34] | Poor (manual only) [34] | Throughput requirements |
Method Selection Guide
The optimal choice between magnetic bead and spin column methods depends heavily on the specific application requirements and laboratory context.
Table 2: Method Selection Guide Based on Application Needs
| Application Requirement | Recommended Method | Rationale |
|---|---|---|
| High-Throughput Screening | Magnetic Beads | Superior automation compatibility; processes 96 samples simultaneously [36] [34] |
| Low Parasitemia/Precision Dx | Magnetic Beads | Higher sensitivity and better recovery from low-DNA samples [32] [35] |
| Challenging Sample Types | Magnetic Beads | More effective with inhibitors; efficient extraction from soil, feces, sputum [37] [38] |
| Limited Budget/Small Scale | Spin Columns | Lower initial equipment cost; minimal investment [32] [33] |
| Rapid, Manual Processing | Spin Columns | Simpler workflow for small batches; no specialized equipment [32] |
| Minimal Laboratory Space | Spin Columns | Requires only a centrifuge; no magnetic separator needed [33] |
Experimental Protocols
Detailed Protocol: Magnetic Bead-Based DNA Extraction
The following optimized protocol is adapted from the high-yield SHIFT-SP (Silica bead-based HIgh yield Fast Tip-based Sample Prep) method [31].
Reagents and Equipment
- Lysis Binding Buffer (LBB): Contains guanidinium thiocyanate (GTC); adjust to pH 4.1 for optimal binding [31]
- Magnetic Silica Beads: 20-30μL per sample [31]
- Wash Buffer: Typically ethanol-based (e.g., 80% ethanol) [34]
- Elution Buffer: TE buffer or nuclease-free water [33]
- Equipment: Magnetic separator, heating block (62°C), pipettes
Step-by-Step Procedure
Sample Lysis:
- Mix 200μL sample with 200μL Lysis Binding Buffer.
- Incubate at 70°C for 10 minutes for efficient lysis [38].
Nucleic Acid Binding:
Magnetic Separation and Washing:
- Place tube on magnetic stand for ~2 minutes until beads form a pellet.
- Carefully remove and discard supernatant while retaining bead pellet.
- Wash twice with 500μL of 80% ethanol, fully removing supernatant between washes [34].
- Air-dry beads for 3-5 minutes. Avoid over-drying to maintain elution efficiency [34].
Elution:
- Resuspend beads in 20-50μL elution buffer (TE or nuclease-free water).
- Incubate at 62°C for 1 minute to maximize DNA release [31].
- Place tube on magnetic stand and transfer purified DNA supernatant to a clean tube.
Detailed Protocol: Spin Column-Based DNA Extraction
This general protocol is representative of commercial spin column kits, with specific notes from optimized workflows [33].
Reagents and Equipment
- Lysis Buffer: Contains chaotropic salts, Triton X-100; may include Proteinase K [33]
- Binding/Wash Buffer: Ethanol or isopropanol-based [33]
- Elution Buffer: TE buffer (pH 9.0) or nuclease-free water [33]
- Equipment: Microcentrifuge, spin columns with silica membrane, collection tubes
Step-by-Step Procedure
Sample Lysis:
- Add 200μL sample to 200μL lysis buffer and 20μL Proteinase K.
- Mix by vortexing and incubate at 56°C for 10-15 minutes [33].
Binding to Silica Membrane:
- Add 200μL ethanol or isopropanol to the lysate and mix by vortexing.
- Transfer entire mixture to spin column seated in collection tube.
- Centrifuge at ≥10,000×g for 1 minute. Discard flow-through [33].
Washing:
Elution:
- Place spin column in clean 1.5mL microcentrifuge tube.
- Add 50-100μL elution buffer (preheated to 62°C) directly to the center of silica membrane.
- Incubate at room temperature for 5 minutes.
- Centrifuge at full speed for 2 minutes to collect purified DNA [33].
Workflow Visualization
Research Reagent Solutions
Table 3: Essential Reagents and Materials for DNA Extraction Workflows
| Reagent/Material | Function | Method Application |
|---|---|---|
| Chaotropic Salts(e.g., Guanidinium thiocyanate) | Denature proteins, facilitate DNA binding to silica | Both methods; key component of lysis/binding buffers [31] [37] |
| Magnetic Silica Beads | Solid phase for DNA binding with superparamagnetic properties | Magnetic bead method only [39] [31] |
| Silica Membrane Columns | Solid phase for DNA binding in column format | Spin column method only [32] [33] |
| Proteinase K | Digest proteins and degrade nucleases | Both methods; added during lysis step [33] |
| Wash Buffers(typically ethanol-based) | Remove contaminants while retaining bound DNA | Both methods; often contain ethanol or isopropanol [34] [33] |
| Elution Buffers(TE buffer or nuclease-free water) | Release purified DNA from silica matrix | Both methods; low salt enables DNA rehydration [33] |
| Dithiothreitol (DTT) | Reduce disulfide bonds in complex samples | Challenging samples (e.g., sputum); helps break down mucoproteins [37] |
Both magnetic bead and spin column technologies provide effective pathways for microbial DNA extraction through silica-based chemistry. Magnetic bead methods offer significant advantages in throughput, automation compatibility, and sensitivity for challenging applications such as low parasitemia detection in Chagas disease or pathogen identification in complex environmental samples. Spin columns remain a valuable option for smaller-scale research settings where budget constraints or equipment availability are primary considerations. The decision between these methodologies should be guided by specific application requirements, including sample volume, required throughput, sensitivity demands, and available laboratory resources. By understanding the comparative strengths and limitations of each approach, researchers can implement optimized DNA extraction strategies that support robust and reproducible molecular analysis in microbial research and diagnostic applications.
Within microbial DNA extraction research, the paradigm that a single methodological approach can be universally applied has been fundamentally overturned. The critical importance of sample-specific protocols is now firmly established, as the unique biochemical composition of each sample type presents distinct challenges that directly impact DNA yield, purity, and downstream analytical success. This application note provides a comprehensive framework for optimizing microbial DNA extraction across five fundamental sample categories: blood, stool, urine, swabs, and cell cultures. By synthesizing current methodological research and quantitative performance data, we aim to equip researchers with detailed protocols that enhance reproducibility, minimize bias, and ensure the reliability of results in diagnostic development and microbiome studies.
Quantitative Performance Comparison Across Sample Types
The selection of an appropriate DNA extraction method requires careful consideration of performance metrics across different sample types. The following table summarizes key quantitative data from comparative studies, providing a basis for evidence-based protocol selection.
Table 1: Performance Metrics of DNA Extraction Methods Across Different Sample Types
| Sample Type | Extraction Method | DNA Yield | Purity (A260/A280) | Key Performance Notes | Source |
|---|---|---|---|---|---|
| Urine | Standard Protocol (SP) | 175.73 ± 331.75 ng/µL | 1.28 ± 0.54 | High yield but variable; better for low-abundance taxa | [40] |
| Urine | Water Dilution Protocol (WDP) | 78.34 ± 173.95 ng/µL | 1.53 ± 0.32 | Superior purity, reduced contamination | [40] |
| Urine | Chelation-Assisted (CAP) | 62.89 ± 145.85 ng/µL | 1.37 ± 0.53 | Poor performance across all metrics | [40] |
| Vaginal Swabs | Qiagen DNeasy Blood & Tissue | Highest Yield | 1.72 - 2.35 | Highest DNA yield and quality (GQS 4.24) | [14] |
| Vaginal Swabs | MoBio PowerSoil Standard | Lower Yield | N/S | Significantly higher alpha diversity | [14] |
| Skin/Wound Swabs | Improved Single-Swab (VLP) | 0.63 ng - 1.2 pg* | N/S | ~400-fold phage DNA enrichment; sufficient for library prep | [41] |
| Skin/Wound Swabs | Improved Single-Swab (Remainder) | 27 ng - 32 pg* | N/S | Adequate for 16S rRNA sequencing and metagenomics | [41] |
*Yields from mock samples containing 1.9×10^8 to 1.9×10^5 virions. N/S: Not Specified.
Detailed Experimental Protocols
Urine Sample Processing
The low bacterial biomass and presence of PCR inhibitors in urine make it one of the more challenging sample types for microbial DNA extraction. A recent methodological study compared three distinct protocols for processing urine samples prior to DNA extraction with the Quick-DNA Urine Kit [40].
Table 2: Protocol Comparison for Microbial DNA Extraction from Urine
| Protocol Step | Standard Protocol (SP) | Water Dilution Protocol (WDP) | Chelation-Assisted Protocol (CAP) |
|---|---|---|---|
| Sample Volume | 6 mL urine | 6 mL urine | 6 mL urine |
| Pre-Treatment | None | 4 mL UltraPure Distilled Water | 4 mL Tris-EDTA Buffer, pH 9.0 |
| Conditioning | Add Urine Conditioning Buffer | Add Urine Conditioning Buffer | Add Urine Conditioning Buffer |
| Centrifugation | Precipitate & pellet DNA | Precipitate & pellet DNA | Precipitate & pellet DNA |
| Lysis | Resuspend in Genomic Lysis Buffer + Proteinase K | Resuspend in Genomic Lysis Buffer + Proteinase K | Resuspend in Genomic Lysis Buffer + Proteinase K |
| Purification | Spin column binding & washing | Spin column binding & washing | Spin column binding & washing |
| Key Advantage | Higher DNA concentration, detects low-abundance taxa | Superior purity (260/280=1.53) and reduced contamination | Designed to dissolve urinary crystals (but performed poorly) |
Experimental Insights: The Water Dilution Protocol (WDP) is recommended for most urinary microbiome applications due to its significantly higher DNA purity (260/280 ratio of 1.53 vs. 1.28 for SP) and reduced contamination levels, despite yielding lower DNA concentrations [40]. WDP-extracted samples also showed significantly higher microbial abundance (p<0.0001), while SP demonstrated higher alpha diversity indices (p<0.01), likely due to improved detection of low-abundance taxa [40] [42]. Beta diversity analysis showed no significant compositional differences between SP and WDP (p=1.0), supporting WDP's reliability for microbiome research [40].
Swab Sample Processing
Swab samples, including vaginal, skin, and wound specimens, present challenges due to low microbial biomass. Different protocols yield varying results in terms of DNA quantity versus microbial diversity representation.
Vaginal Swab Protocol Comparison: A comparative study evaluated four extraction methods from self-collected vaginal swabs (Copan ESwab) [14]:
- Qiagen DNeasy Blood and Tissue: Pellet resuspended in PBS with enzymatic lysis (Proteinase K, lysozyme, mutanolysin) at 37°C, followed by traditional phenol-chloroform extraction.
- MoBio PowerSoil with combined C2+C3: Pellet treated with a mixture of C2 and C3 solutions from the PowerSoil kit.
- MoBio PowerSoil with combined C1+C2+C3: Pellet treated with a mixture of C1, C2, and C3 solutions.
- MoBio PowerSoil Standard Protocol: Followed manufacturer's instructions without modifications.
Key Findings: The Qiagen DNeasy method produced the highest DNA yield and achieved the best Genomic Quality Score (4.24 ± 0.36). In contrast, the MoBio PowerSoil protocols, particularly the standard protocol, provided significantly higher alpha diversity estimates, despite lower DNA yields [14]. This highlights the critical trade-off between DNA quantity and diversity representation in low-biomass samples.
Integrated Swab Processing Workflow for Bacterial and Viral DNA: For skin and wound swabs where both bacterial and viral (phage) DNA are of interest, an improved single-swab method has been developed [41]. The following workflow diagram illustrates this integrated protocol:
This integrated method demonstrates substantial improvement for wound samples, increasing the success rate from 25% with traditional methods to 100% of samples yielding sufficient DNA for downstream analysis [41]. The VLP fraction shows approximately 400-fold enrichment of phage DNA compared to cellular DNA, while the remainder fraction provides adequate bacterial DNA for 16S rRNA sequencing and metagenomic analysis [41].
Stool Sample Processing
Stool samples contain complex microbial communities but also include numerous PCR inhibitors that must be removed for reliable downstream analysis.
Key Considerations:
- Inhibitor Removal: Stool samples contain bile salts, complex carbohydrates, and humic substances that inhibit downstream PCR. Kits with patented Inhibitor Removal Technology (IRT) such as the QIAamp PowerFecal Pro DNA Kit or DNeasy PowerSoil Pro Kits are specifically designed to address this challenge [43].
- Sample Input Flexibility: When using stabilization media, researchers may observe lower DNA yields compared to raw stool. Protocol flexibility should be maintained to adjust input volumes to meet the yield requirements of downstream assays [7].
- Mechanical Lysis: Robust bead beating is essential for breaking down tough Gram-positive bacterial cell walls and fungal cells present in stool samples. The DNeasy PowerSoil Pro Kit is validated for efficient lysis of both bacteria and fungi [43].
Minimum DNA Input Requirements: For 16S rRNA sequencing, a minimum DNA concentration above 4 × 10^(-2) ng/µL is recommended, with ideal inputs being >2 × 10^(-1) ng/µL. Input levels of ≤1.6 × 10^(-3) ng/µL are not recommended as they introduce taxonomic biases and misrepresent the microbiome [43].
Blood Sample Processing
Blood samples present unique challenges for microbial DNA extraction due to the high ratio of human to microbial DNA and the presence of PCR inhibitors like heme.
Critical Requirements:
- Human DNA Depletion: Effective separation of microbial DNA from abundant human DNA is crucial for sensitivity. Low- and high-molecular-weight substances inhibitory to PCR must be removed [44].
- Comprehensive Lysis Capability: The method must be capable of lysing Gram-positive bacteria, Gram-negative bacteria, and fungal organisms that may cause bloodstream infections [44].
- Contamination Control: Extraction buffers, reagents, and consumables must be free of microbial DNA to avoid false-positive results. Some commercial kits have been reported to contain contaminating bacterial DNA [44].
Protocol Recommendations: For manual extraction from small-volume blood samples, methods utilizing guanidium thiocyanate and silicon dioxide-based binding matrices have proven effective. These protocols typically involve:
- Initial centrifugation to concentrate microbial cells
- Chemical and enzymatic lysis to break diverse cell walls
- Selective binding of DNA to silica matrices in the presence of chaotropic salts
- Extensive washing to remove PCR inhibitors
- Elution in low-salt buffers or molecular-grade water
Cell Culture Processing
Microbial DNA extraction from cell cultures requires careful attention to culture conditions and processing parameters to ensure high-quality DNA.
Key Protocol Elements:
- Culture Monitoring: Track cell viability, concentration, and maintain optimal density throughout expansion. Tools like automated cell counters provide reliable monitoring for consistent DNA isolation [7].
- Specialized Reagents: For specific cell types such as T cells, use specialized media and activation reagents to maintain cell health and maximize DNA yield [7].
- Lysis Optimization: Implement forceful but focused lysis through heat and mixing to break open cells without damaging DNA. Magnetic bead workflows can increase sample throughput and uniformity [7].
The Scientist's Toolkit: Essential Research Reagents
Table 3: Essential Reagents for Microbial DNA Extraction Across Sample Types
| Reagent/Category | Function | Sample Type Applications | Examples/Notes |
|---|---|---|---|
| Guanidium Thiocyanate | Chaotropic salt; denatures proteins, enables DNA binding to silica | Universal | Foundation of many lysis buffers; used in PureLink and Boom methods [45] [46] |
| Silica-Based Matrices | Selective DNA binding in presence of chaotropic salts | Universal | Spin columns, magnetic beads, or homemade preparations with celite [45] [46] |
| Proteinase K | Broad-spectrum serine protease; digests proteins | Tissue, cells, stool | Critical for tough samples; used with SDS for effective lysis [46] |
| Inhibitor Removal Technology (IRT) | Selective removal of PCR inhibitors | Stool, soil, blood | Patented technology in QIAGEN Power kits; removes humic acids, bile pigments [43] |
| DNase I | Digests free DNA outside of intact capsids | VLP purification from swabs | Essential for viral enrichment protocols; degrades bacterial and host DNA [41] |
| Cetyltrimethylammonium Bromide (CTAB) | Precipitates polysaccharides and proteins | Plant, stool, soil | Used in phenol-chloroform extractions to remove contaminants [41] |
| Ethylenediaminetetraacetic Acid (EDTA) | Chelating agent; binds metal ions | Urine, tissue | Inhibits DNases, dissolves urinary crystals [40] |
| RNase A | Degrades RNA contamination | High-RNA samples (tissues) | Optional step to prevent RNA contamination in DNA extracts [46] |
The optimization of sample-type specific protocols for microbial DNA extraction represents a fundamental requirement in modern molecular research. As demonstrated by the comparative data and methodologies presented herein, the strategic selection and refinement of extraction protocols directly impacts the reliability and interpretability of downstream analyses. Researchers must consider the inherent characteristics of each sample matrix—whether the low biomass of urine, the inhibitor-rich environment of stool, the complex community of swabs, or the high human DNA background in blood—when designing their experimental workflows. By implementing these detailed protocols and leveraging the appropriate reagent systems, scientists can significantly enhance the quality of their microbial DNA extraction, thereby strengthening the foundation of their research in microbiome analysis, diagnostic development, and therapeutic discovery.
The efficacy of microbial DNA extraction is fundamentally governed by the initial cell lysis step, a process entirely dependent on the intricate structural properties of microbial cell walls. In the context of sample preparation for microbial DNA extraction research, a one-size-fits-all approach to lysis introduces significant bias, systematically favoring certain microbes over others and distorting the true representation of a microbial community [47]. This application note provides a detailed guide to tailoring lysis strategies to effectively and equitably handle the diverse challenges presented by Gram-positive bacteria, Gram-negative bacteria, and fungi. The structural basis for these differences is paramount: Gram-positive bacteria possess a thick, multi-layered peptidoglycan wall; Gram-negative bacteria feature a thin peptidoglycan layer enclosed within a complex outer membrane rich in lipopolysaccharides; and fungi have robust cell walls primarily composed of chitin [48] [49]. Understanding these differences is the first step in developing an unbiased lysis protocol.
Structural Basis for Differential Lysis
The need for tailored lysis protocols stems from the profound structural differences between the major groups of microorganisms. The following table summarizes the key compositional differences that dictate their susceptibility to various lysis methods.
Table 1: Key Cell Wall Characteristics Influencing Lysis Efficiency
| Characteristic | Gram-Positive Bacteria | Gram-Negative Bacteria | Fungi |
|---|---|---|---|
| Peptidoglycan Layer | Thick, multilayered [48] | Thin, single-layered [48] | Absent |
| Outer Membrane | Absent [48] | Present (with LPS) [48] | Absent |
| Primary Structural Polymer(s) | Peptidoglycan, Teichoic acids [48] | Peptidoglycan, Lipopolysaccharide [48] | Chitin, Glucans [49] |
| Resistance to Physical Disruption | High [48] | Low [48] | Very High [49] |
| Susceptibility to Chemical/Enzymatic Lysis | Moderate (lysozyme-sensitive) [50] | High (lysozyme-sensitive, membrane disruptors) [50] | Low (requires specific hydrolases) [49] |
These structural profiles directly translate into varying levels of resistance, necessitating a strategic approach to cell disruption. The following diagram illustrates the logical decision-making process for selecting an appropriate lysis strategy based on the target microorganisms and research objectives.
Diagram 1: Lysis Strategy Selection Workflow
Comparative Analysis of Lysis Methods
No single lysis method is universally superior; each has advantages and drawbacks that make it suitable for specific applications. The choice of method can dramatically impact DNA yield, community representation, and downstream analysis.
Table 2: Advantages and Drawbacks of Primary Lysis Methods
| Lysis Method | Key Advantages | Key Drawbacks | Ideal Use Case |
|---|---|---|---|
| Mechanical (Bead Beating) | Most effective for tough cells (Gram-positives, fungi, spores); Fast; Broadly unbiased for complex communities [51] [47]. | Can shear DNA, reducing fragment size; Generates heat [47]. | Metagenomic DNA extraction from complex, diverse samples (e.g., soil, gut microbiota) [51]. |
| Chemical & Enzymatic | Gentle on DNA; Highly customizable with enzymes (lysozyme, proteinase K) and detergents [47] [52]. | Can be slow; No universal cocktail; May fail on robust cells; Chemical incompatibilities (e.g., EDTA vs. metal-dependent enzymes) [47]. | Extraction of high-molecular-weight DNA or lysis of specific, known fragile targets (e.g., pure culture of Gram-negatives) [52]. |
| Thermal | Simple, inexpensive, and low hands-on time [47]. | Highly biased; Kills but may not lyse tough cells; High DNA degradation risk [47]. | Quick lysis of fragile Gram-negative bacteria where DNA quality and completeness are not critical. |
| Ionic Liquid-Based | Rapid (minutes); Effective on both Gram-types; Low-cost; avoids hazardous chemicals [53]. | Emerging method; Requires optimization for new sample types; Potential PCR inhibition if not diluted [53]. | Rapid, high-throughput preparation of bacterial samples for diagnostics. |
The superiority of a combined mechanical and chemical lysis (CML) approach over chemical lysis (CL) alone for complex samples has been demonstrated quantitatively. In a recent 2025 study on respiratory microbiome analysis, CML significantly outperformed CL, yielding higher-quality data and better detection of robust microorganisms [51].
Table 3: Quantitative Comparison of Lysis Methods in Respiratory Microbiome Analysis
| Performance Metric | Chemical Lysis (CL) Only | Combined Mechanical & Chemical Lysis (CML) | Statistical Significance |
|---|---|---|---|
| dsDNA Library Yield | Lower yields from BAL and NPS samples | Significantly increased yields for both sample types | p < 0.0001 [51] |
| Sequencing Read Counts | Lower read counts | Higher read counts | p < 0.0001 [51] |
| Detection of Gram-positive Bacteria | Compromised | Enhanced detection | Not explicitly stated |
| Detection of Fungi | Compromised | Enhanced detection | Not explicitly stated |
| Viral Detection | Effective (kit optimized for viruses) | Maintained effectiveness | Not significantly compromised [51] |
Detailed Experimental Protocols
Comprehensive Lysis for Complex Microbial Communities
This protocol is adapted from a 2025 study on respiratory microbiomes and is designed for maximum inclusivity across bacteria and fungi, making it suitable for metagenomic studies of samples like soil, feces, or respiratory secretions [51].
Sample Preparation:
- Use 200-400 µL of sample (e.g., bronchoalveolar lavage, nasopharyngeal swab pool, or homogenized soil slurry).
- Perform all steps in duplicate to ensure technical reproducibility.
Lysis Procedure:
- Mechanical Lysis: Transfer the sample to a tube containing a mixture of glass or zirconia beads (diameters of 0.5-0.7 mm are effective). Process the sample using a bead beater (e.g., BioSpec BeadBeater) for a total of 3 minutes. To prevent heat-induced DNA damage, perform this in cycles (e.g., 30 seconds of beating followed by 2 minutes of cooling on ice) [51] [49].
- Chemical Lysis: Following mechanical disruption, apply a commercial DNA/RNA extraction kit that incorporates chemical lysis buffers. These typically include detergents like SDS to dissolve membranes and chaotropic salts to denature proteins and protect nucleic acids [51] [47].
- DNase Treatment: To remove residual contaminating DNA, treat the extracted RNA with a high-activity recombinant DNase (e.g., TURBO DNase) [51].
Downstream Analysis:
- For metatranscriptomic studies, perform ribosomal RNA depletion using a kit such as the NEBNext rRNA Depletion Kit.
- Proceed with library preparation and third-generation sequencing (e.g., Oxford Nanopore MinION) [51].
Optimized Single-Cell Lysis for Microfluidic Platforms
This protocol is crucial for single-cell whole-genome sequencing (SC-WGS) where harsh mechanical methods are not feasible and inhibitor carryover must be minimized [52].
Lysis Reagent Preparation:
- Prepare a lysozyme solution at a concentration of 2 mg/mL in an appropriate buffer.
- Prepare a lysis buffer containing a non-ionic detergent (e.g., Triton X-100) and an alkaline agent (e.g., potassium hydroxide). Non-ionic detergents are preferred as they are less likely to inhibit downstream φ29 DNA polymerase used in Multiple Displacement Amplification (MDA) [52].
On-Chip Lysis Workflow:
- Isolation: Isolate a single bacterial cell within a microfluidic chamber.
- Enzymatic Treatment: Introduce the lysozyme solution into the chamber. Incubate at 37°C for 15-30 minutes to enzymatically degrade the peptidoglycan layer.
- Chemical Lysis: Flush the chamber with the prepared chemical lysis buffer.
- Thermal Lysis: Subject the chamber to a thermal ramp, heating to 70°C for 10-20 minutes to complete the lysis process [52].
Amplification and Quality Control:
- Directly perform Multiple Displacement Amplification (MDA) within the same microfluidic chamber after lysis is complete.
- Consider an amplification successful if it yields more than 5 ng of DNA from a single-cell replicate [52].
Specialized Lysis for Fungal Cultures
Fungal cell walls are exceptionally robust, requiring intense mechanical force for efficient disruption [49].
Cell Harvesting:
- Cultivate fungal biomass (e.g., Aspergillus fumigatus, Rhodotorula gracilis) in appropriate liquid media until the mid-log phase.
- Separate biomass by centrifugation (4,000 rpm for 10 minutes at 4°C). Wash the pellet twice with cold Tris buffer (50 mmol/L, pH 7.5) [49].
Disintegration Procedure:
- Bead Milling: Suspend approximately 6.5 g of washed biomass in 15 mL of cold Tris buffer. Add zirconia or glass beads (0.5-0.7 mm diameter). Disintegrate using a bead beater for a total of 3 minutes, with cooling on ice between cycles to prevent overheating.
- Sonication (Alternative): Process the cell suspension using an ultrasonic processor. Apply energy in cycles (e.g., 30 seconds of sonication followed by 2 minutes of cooling on ice) for a total sonication time of up to 5 minutes [49].
Efficiency Assessment:
- Centrifuge the homogenate (6,500 rpm for 15 minutes at 4°C) to remove cell debris.
- Assay the supernatant for soluble protein concentration using the Bradford method.
- Measure the activity of an intracellular enzyme, such as glucose-6-phosphate dehydrogenase (G6PD), to quantify lysis efficiency [49].
The Scientist's Toolkit: Research Reagent Solutions
Table 4: Essential Reagents for Microbial Cell Lysis
| Reagent / Kit | Function / Purpose | Application Notes |
|---|---|---|
| Zirconia/Glass Beads (0.5-0.7 mm) | Provides abrasive material for mechanical shearing of cell walls during bead beating [49]. | Essential for breaking open Gram-positive bacteria and fungal cells. Zirconia beads are more durable than glass. |
| Lysozyme | Enzyme that catalyzes the hydrolysis of 1,4-beta-linkages in peptidoglycan [50]. | Most effective on Gram-positive bacteria; requires pretreatment or permeabilizers for Gram-negatives. |
| Proteinase K | Broad-spectrum serine protease that digests proteins and inactivates nucleases [54]. | Often used after initial lysis to degrade cellular proteins and enhance DNA yield and purity. |
| Ionic Liquids (e.g., Choline Hexanoate) | Hydrophilic salts that disrupt cell walls and dissolve biomolecules, enabling rapid lysis [53]. | Effective for both Gram-positive and Gram-negative bacteria in a simple, rapid protocol. |
| Quick-DNA/RNA Miniprep Plus Kit (Zymo Research) | Commercial kit employing a combined mechanical and chemical lysis (CML) approach [51]. | Demonstrated superior performance in microbiome studies for balanced lysis of diverse taxa. |
| NucleoSpin Virus Kit (Macherey-Nagel) | Commercial kit employing chemical lysis (CL) only [51]. | Optimal for fragile cells like viruses or Gram-negative bacteria, but biased against tough cells. |
| Non-ionic Detergents (e.g., Triton X-100) | Solubilize lipid bilayers without denaturing proteins or inhibiting polymerases [52]. | Critical for microfluidic SC-WGS where inhibitor carryover is a major concern. |
The strategic tailoring of lysis protocols is not a mere optimization step but a foundational requirement for accurate microbial research. The structural dichotomy between the thick, saccharide-rich walls of Gram-positive bacteria and fungi and the complex, membrane-bound structure of Gram-negative bacteria demands a disciplined approach. As demonstrated, combined mechanical and chemical lysis (CML) offers the most robust solution for complex communities, while targeted enzymatic and chemical methods are invaluable for specific applications like single-cell genomics. Failure to account for these differences guarantees a biased and incomplete view of the microbial world, shining a light only on the microbes that are easiest to lyse while leaving critical "microbial dark matter" undetected. The protocols and data presented herein provide a framework for developing lysis strategies that are fit-for-purpose, thereby ensuring that research conclusions are built upon a foundation that reflects biological reality rather than methodological bias.
Automation and High-Throughput Workflows for Consistent Results
In modern molecular biology and microbial research, the demand for rapid, reliable, and reproducible DNA extraction has never been greater. Automated high-throughput workflows represent a paradigm shift from traditional manual methods, addressing critical challenges in sample processing efficiency, experimental consistency, and data reproducibility that are fundamental to advanced genomic applications. The transition to automation is particularly crucial in microbial studies where the genetic material must be accurately representative of diverse microbial communities without introducing technical artifacts that can skew compositional profiles [55].
The fundamental importance of sample preparation cannot be overstated—it serves as the foundational step for all downstream analytical processes, including next-generation sequencing (NGS), quantitative PCR (qPCR), and various molecular diagnostics. Inconsistent or suboptimal DNA extraction can compromise years of research or clinical diagnostics, making the implementation of robust, automated workflows an essential component of modern laboratory practice. This application note details the methodologies, technologies, and validation metrics necessary to implement automated high-throughput systems for microbial DNA extraction, framed within the broader context of sample preparation research for microbial genomics.
Automated Nucleic Acid Extraction Technologies and Platforms
Core Chemistries for Automated Nucleic Acid Purification
The majority of automated nucleic acid extraction systems employ one of two primary chemistries: magnetic bead-based purification or filtration membrane-based approaches. Magnetic bead-based methods have emerged as the predominant technology for high-throughput automation due to their flexibility, scalability, and efficient binding kinetics [56] [57]. This chemistry utilizes superparamagnetic beads coated with silica or other DNA-binding surfaces that selectively bind nucleic acids in the presence of chaotropic salts. The process involves four fundamental steps: (1) Lysis/Binding where cell membranes are disrupted and released DNA binds to the magnetic beads; (2) Separation where a magnetic field captures beads while contaminants are removed; (3) Washing where residual impurities are eliminated through buffer exchanges; and (4) Elution where purified DNA is released in a suitable buffer [57].
The alternative approach, filtration membrane-based technology, relies on silica membranes embedded in column formats. DNA binds to these membranes under high-salt conditions, with contaminants removed through centrifugal or vacuum-driven washing steps before elution in low-ionic-strength solutions [58]. While effective, this method is generally less amenable to full automation compared to magnetic bead-based systems, though it remains valuable for specific applications and semi-automated workflows [59].
Comparison of Automation System Architectures
Automated nucleic acid extraction platforms can be categorized into open and closed systems, each with distinct advantages and limitations. Open systems offer compatibility with diverse reagents, kits, and labware (e.g., Hamilton Vantage and KingFisher systems), providing users significant flexibility to customize extraction protocols for specific research needs [56]. These systems can often be configured to perform additional liquid handling processes beyond extraction, such as PCR setup and sample aliquoting, thereby extending their utility throughout the workflow. In contrast, closed systems (e.g., Qiagen QIAsymphony) typically employ proprietary reagents and predefined protocols optimized for specific applications, offering a more user-friendly interface but reduced flexibility [56].
Table 1: Comparison of Automated Nucleic Acid Extraction Platforms
| Platform | System Type | Throughput | Core Technology | Key Features | Best Applications |
|---|---|---|---|---|---|
| Tecan DreamPrep NAP | Open | 1-96 samples | Magnetic beads | Integrated quantification & normalization; Pre-programmed protocols | Research labs requiring flexibility |
| KingFisher (Thermo Fisher) | Open | 24-96 samples | Magnetic beads | Compatible with multiple kit manufacturers; Gentle mixing | High-throughput screening |
| Fluent Automation Workstation | Open | Up to 4×96-well plates | Magnetic beads or vacuum filtration | Barcode tracking; Advanced liquid handling | Large-scale genomics core facilities |
| Maxwell RSC (Promega) | Closed | 16-48 samples | Magnetic beads | Compact design; Pre-packaged reagents | Clinical research; Standardized workflows |
| QIAsymphony (Qiagen) | Closed | 24-96 samples | Silica-membrane | Application-specific cartridges | Diagnostic laboratories |
Impact of Extraction Method on Microbial Community Profiling
The choice of DNA extraction methodology significantly influences the outcome of microbial community analyses, particularly in complex samples where the accurate representation of all taxa is essential. Recent comparative studies have demonstrated that extraction protocols can introduce substantial variation in perceived microbial composition, potentially confounding biological interpretations [60] [55]. These effects are primarily attributed to differences in cell lysis efficiency, DNA yield, and purity across various methods.
A 2023 systematic comparison of four commercially available DNA extraction kits revealed significant differences in DNA quantity and quality when processing both high- and low-biomass samples [60]. While kits produced similar diversity and compositional profiles for stool samples (high biomass), all performed suboptimally for low-biomass samples such as chyme, bronchoalveolar lavage, and sputum. This highlights the critical importance of matching extraction methodologies to sample characteristics, particularly when working with challenging matrices where microbial density is limited.
Further evidence comes from a study comparing four DNA extraction methods for 16S rRNA microbiota profiling of human fecal samples, which found that methodological variations significantly impacted the relative abundance of key bacterial phyla [55]. Specifically, methods that omitted additional chemical and mechanical lysis steps resulted in significantly lower abundance of Firmicutes and higher relative abundance of Bacteroidetes and Proteobacteria compared to established in-house methods incorporating comprehensive lysis protocols. These findings underscore how protocol choices can systematically skew microbial composition data, with important implications for cross-study comparisons and meta-analyses.
Table 2: Impact of DNA Extraction Method on Microbial Composition (Based on 16S rRNA Sequencing)
| Extraction Method | DNA Yield | DNA Purity (A260/A280) | Effect on Firmicutes | Effect on Bacteroidetes | Effect on Proteobacteria | Recommended Applications |
|---|---|---|---|---|---|---|
| In-house (mechanical + chemical lysis) | High | 1.6-2.0 | Reference | Reference | Reference | Research requiring accurate representation |
| Maxwell + bead beating | High | 1.7-2.0 | No significant difference | No significant difference | No significant difference | High-throughput microbiome studies |
| Maxwell (standard workflow) | Moderate | 1.7-2.0 | Significantly lower (p=0.004) | Significantly higher (p=0.005) | Significantly higher (p=0.008) | Population screening where relative trends are sufficient |
Detailed Protocols for Automated Microbial DNA Extraction
Protocol 1: Automated High-Throughput DNA Extraction from Fecal Samples Using Magnetic Bead Technology
Purpose: This protocol describes an automated method for extracting microbial DNA from human fecal samples for downstream 16S rRNA sequencing and metagenomic analyses, optimized to maintain representative microbial diversity while enabling high-throughput processing.
Materials and Equipment:
- Maxwell RSC Faecal Microbiome DNA Kit (Promega, Cat. # AS1700) [55]
- Maxwell RSC Instrument [55]
- Homogenized fecal sample in phosphate-buffered saline
- Qiagen TissueLyser II or similar bead-beating instrument [55]
- Zirconia beads (0.1 and 1 mm) [55]
- Microcentrifuge tubes and racks
Procedure:
- Sample Preparation: Transfer approximately 200 mg of homogenized fecal material to a microfuge tube containing zirconia beads [55].
- Mechanical Lysis: Add appropriate lysis buffer and homogenize using a bead-beating instrument for 5 minutes to ensure comprehensive disruption of robust microbial cell walls [55].
- Automated Extraction:
- Transfer supernatant to the first well of a Maxwell RSC cartridge.
- Load cartridge onto the instrument along with the required reagents.
- Select the appropriate protocol (#TM640) and initiate automated processing.
- The system automatically completes binding, washing, and elution steps.
- DNA Elution: Collect purified DNA in elution buffer (typically 50-100 μL) [55].
- Quality Assessment: Quantify DNA using fluorometric methods (e.g., Qubit with dsDNA HS Assay) and assess purity via spectrophotometry (A260/A280 ratio) [60].
Technical Notes: For optimal representation of gram-positive bacteria, ensure sufficient bead-beating duration. Include extraction controls to monitor potential contamination, particularly for low-biomass samples. DNA should be stored at -80°C if not used immediately.
Protocol 2: Automated DNA Extraction from Microbial Cultures for Nanopore Sequencing
Purpose: This protocol describes an automated approach for extracting genomic DNA from pure microbial cultures optimized for long-read sequencing platforms such as Oxford Nanopore Technologies (ONT).
Materials and Equipment:
- Maxwell RSC PureFood Pathogen Kit (Promega, Cat. # AS1660) [2]
- Maxwell RSC Instrument [2]
- Liquid microbial cultures (1 ml overnight culture ~1×10^8–10^9 cfu/ml) [2]
- RNase A (QIAGEN, 19101) [2]
- Proteinase K (QIAGEN, 19131) [2]
- Qubit fluorometer with dsDNA HS Assay (ThermoFisher, Q33230) [2]
Procedure:
- Cell Harvesting: Pellet microbial cells from 1 ml culture by centrifugation at 5,000 × g for 10 minutes.
- Enzymatic Pretreatment: Resuspend cell pellet in appropriate buffer containing lysozyme (for gram-positive bacteria) or proteinase K (for gram-negative bacteria) and incubate at 56°C for 1 hour [2].
- Automated Extraction:
- Load pretreated samples into Maxwell RSC cartridge.
- Execute the predefined protocol for bacterial DNA extraction.
- The system automatically processes samples through lysis, binding, washing, and elution.
- DNA Recovery: Collect eluted DNA in nuclease-free water or low-EDTA TE buffer.
- Quality Control: Assess DNA concentration using Qubit fluorometer and verify fragment size using pulsed-field gel electrophoresis or TapeStation analysis [2].
Technical Notes: For long-read sequencing, avoid excessive vortexing or pipetting that may shear high-molecular-weight DNA. Optimal DNA integrity numbers (DIN) should exceed 7.0 for sequencing applications. For difficult-to-lyse organisms (e.g., Mycobacteria, fungi), incorporate additional enzymatic lysis steps with specific lytic enzymes.
Workflow Integration and Downstream Applications
Integration with Downstream Analysis Platforms
A key advantage of automated DNA extraction systems is their ability to seamlessly integrate with downstream analytical processes, creating continuous workflows that minimize manual intervention and reduce technical variability. Modern automated platforms can be configured to directly transfer purified DNA to PCR setup, sequencing library preparation, or analytical quantification steps, creating streamlined processes from sample to answer [59].
Advanced systems such as the Tecan DreamPrep NAP workstation offer integrated quantification and normalization capabilities through incorporated readers (e.g., Frida Reader for UV measurements or Infinite 200 PRO for fluorescence-based quantification) [59]. This integration enables fully automated normalization of DNA concentrations across samples, a critical prerequisite for sequencing library preparation where input DNA must be carefully controlled to ensure uniform coverage depth across samples.
For large-scale genomic studies, platforms like the Fluent 780 Automation Workstation can be integrated with multiple KingFisher Presto units to create a fully automated, high-throughput solution capable of processing hundreds of samples per day with minimal hands-on time [59]. Such systems typically include barcode tracking capabilities that maintain sample identity throughout the workflow, an essential feature for clinical research or large cohort studies where sample tracking is paramount.
The Scientist's Toolkit: Essential Reagents and Materials
Table 3: Essential Research Reagent Solutions for Automated Microbial DNA Extraction
| Reagent/Kit | Manufacturer | Primary Function | Compatible Systems | Sample Types |
|---|---|---|---|---|
| NucleoMag DNA Microbiome Kit | Macherey-Nagel | Simultaneous DNA extraction from diverse microbes | Tecan DreamPrep, Fluent | Stool, soil, biofluids |
| MagMAX Microbiome Ultra Kit | Thermo Fisher | Comprehensive nucleic acid extraction from microbiome samples | KingFisher systems | Stool, soil, swabs |
| Mag-Bind Universal Pathogen | Omega Bio-tek | Broad-spectrum pathogen DNA extraction | Tecan Fluent, DreamPrep | Bacterial, viral pathogens |
| InviMag Stool DNA Kit | Invitek | Optimized for fecal DNA isolation | Various magnetic bead systems | Fecal samples, gut microbiome |
| Maxwell RSC Faecal Microbiome | Promega | Automated fecal DNA extraction | Maxwell RSC | Fecal samples |
| NucleoSpin Microbial DNA | Takara Bio | Genomic DNA from microorganisms | Manual or semi-automated | Bacteria, yeast, fungi |
Quality Control and Validation Strategies
Implementing robust quality control measures is essential for validating automated DNA extraction workflows and ensuring the reliability of downstream analytical results. A comprehensive QC strategy should address DNA quantity, purity, and functional integrity.
DNA Quantification: Fluorometric methods using DNA-binding dyes (e.g., Qubit with dsDNA HS Assay) provide accurate concentration measurements specific to double-stranded DNA, unlike spectrophotometric approaches that may be influenced by contaminants or single-stranded nucleic acids [60]. This is particularly important for microbial community studies where the accurate quantification of bacterial DNA in the presence of potential contaminants is crucial.
Purity Assessment: Spectrophotometric measurement of A260/A280 and A260/230 ratios provides valuable information about potential contamination with proteins, phenol, or other impurities [60]. Optimal A260/A280 ratios typically fall between 1.8-2.0, while A260/230 ratios should exceed 1.75 to indicate minimal organic compound contamination.
Functional Quality Control: For sequencing applications, DNA integrity should be verified using fragment analysis systems such as the Agilent TapeStation, which provides a size distribution profile and calculates a DNA Integrity Number (DIN) [60]. For microbiome studies, the inclusion of mock communities with known composition allows researchers to validate that their extraction protocol does not introduce systematic biases in microbial representation.
The implementation of automated high-throughput workflows for microbial DNA extraction represents a significant advancement in molecular biology, addressing critical challenges in reproducibility, efficiency, and scalability. As demonstrated through comparative studies, the selection of appropriate extraction methodologies significantly impacts downstream analytical outcomes, particularly in microbiome research where accurate representation of microbial communities is essential. The protocols and platforms detailed in this application note provide researchers with validated strategies for implementing automated systems that ensure consistent, high-quality DNA extraction across diverse sample types. By adopting these standardized, automated approaches, research and clinical laboratories can enhance the reliability of their genomic analyses while increasing processing capacity to meet the growing demands of modern microbial genomics.
Workflow Diagrams
Automated Magnetic Bead-Based DNA Extraction Workflow
Comparison of Extraction Methods Impact on Microbial Composition
The study of the urinary microbiome represents a frontier in non-invasive biomarker discovery, particularly for conditions such as bladder cancer. However, the low bacterial biomass and high concentration of PCR inhibitors in urine, including urinary crystals and urea, pose significant challenges for microbial DNA recovery [40]. Inconsistent DNA extraction protocols can lead to biased and non-reproducible results, hindering the reliability of downstream analyses like 16S rRNA sequencing [40].
Optimizing the DNA extraction step is therefore a critical precursor to robust microbiome research. This application note delves into the Water Dilution Protocol (WDP), a method demonstrated to outperform standard and chelation-assisted protocols by significantly enhancing DNA purity and reducing contaminants, thereby ensuring high-quality data for urinary microbiome analyses [40].
Comparative Performance Analysis
A comprehensive study compared three microbial DNA extraction protocols from urine samples: the Standard Protocol (SP), the Water Dilution Protocol (WDP), and the Chelation-Assisted Protocol (CAP) [40]. The performance was evaluated based on DNA concentration, purity (260/280 ratio), and contamination levels (260/230 ratio). The following tables summarize the key quantitative findings.
Table 1: DNA Quantity and Quality Metrics across Extraction Protocols (n=24 samples from 8 individuals)
| Protocol | DNA Concentration (ng/µL), Mean ± SD | 260/280 Ratio (Purity), Mean ± SD | 260/230 Ratio (Contamination), Mean ± SD |
|---|---|---|---|
| Standard Protocol (SP) | 175.73 ± 331.75 | 1.28 ± 0.54 | 1.36 ± 0.64 |
| Water Dilution Protocol (WDP) | 78.34 ± 173.95 | 1.53 ± 0.32 | 1.87 ± 1.57 |
| Chelation-Assisted Protocol (CAP) | 62.89 ± 145.85 | 1.37 ± 0.53 | 1.16 ± 0.93 |
Table 2: Microbiome Analysis Outcomes for SP vs. WDP (n=138 samples)
| Analysis Metric | Standard Protocol (SP) | Water Dilution Protocol (WDP) | Statistical Significance |
|---|---|---|---|
| Microbial Abundance | Lower | Significantly Higher | p < 0.0001 |
| Alpha Diversity (e.g., Shannon, Chao1) | Higher | Lower | p < 0.01 |
| Beta Diversity (Community Composition) | No significant difference from WDP | No significant difference from SP | p = 1.0 (PERMANOVA) |
Key Findings
- WDP Superiority in Purity and Contamination Control: Despite yielding a lower average DNA concentration, WDP produced DNA with significantly higher purity (260/280 ratio) and lower levels of contaminants (260/230 ratio) compared to SP and CAP [40]. The high standard deviation in concentration is typical for urine samples with variable cellularity.
- Exclusion of CAP: The Chelation-Assisted Protocol was excluded from further analysis due to its poor performance across all measured metrics [40].
- Microbiome-Specific Outcomes: WDP led to significantly higher microbial abundance, suggesting more efficient recovery of bacterial DNA [40]. The higher alpha diversity in SP may indicate enhanced detection of low-abundance taxa, but the lack of difference in beta diversity confirms that WDP does not alter the fundamental profile of the microbial community, supporting its reliability for microbiome research [40].
Experimental Protocol: Water Dilution Protocol (WDP)
The following section provides a detailed, step-by-step methodology for implementing the Water Dilution Protocol as described in the primary source [40].
Research Reagent Solutions
Table 3: Essential Materials and Reagents for the Water Dilution Protocol
| Item | Function/Description |
|---|---|
| Quick-DNA Urine Kit (Zymo Research) | The core kit provides buffers for conditioning, lysis, washing, and DNA elution. |
| UltraPure Distilled Water (Thermo Scientific) | Pre-diluent used to increase sample volume and dilute inhibitors. |
| NanoDrop One Spectrophotometer (Thermo Scientific) | Instrument for assessing DNA concentration and purity (260/280 & 260/230 ratios). |
| Sterile Catheter | For consistent and sterile collection of urine samples. |
| Microcentrifuge Tubes | For sample processing and DNA elution. |
| Pipettes and Sterile Tips | For accurate liquid handling. |
| Vortex Mixer | For thorough mixing of samples and reagents. |
| Centrifuge | For pelleting precipitates during extraction. |
Step-by-Step Procedure
- Sample Collection and Preparation: Collect urine via sterile catheterization to minimize contamination. Use a standardized volume of 6 mL of urine per extraction [40].
- Water Dilution Step: Add 4 mL of UltraPure Distilled Water to the 6 mL urine sample. This pre-dilution is the critical modification that defines the WDP [40].
- Conditioning and Precipitation: Add the appropriate volume of Urine Conditioning Buffer (from the Quick-DNA kit) to the diluted urine sample. Mix thoroughly and proceed with the precipitation and centrifugation steps as per the manufacturer's standard instructions to form a DNA pellet [40].
- Lysis and Purification: Resuspend the pellet in Genomic Lysis Buffer and incubate with Proteinase K to digest proteins and enhance purity. Transfer the lysate to a provided spin column for DNA binding [40].
- Washing and Elution: Perform wash steps as directed by the kit manufacturer to remove contaminants. Elute the purified DNA in the provided elution buffer or nuclease-free water [40].
- Storage and Quality Control: Store the extracted DNA at -80°C. Assess the DNA concentration, purity, and contamination levels using a spectrophotometer (e.g., NanoDrop) [40].
Diagram 1: Water Dilution Protocol (WDP) workflow for urinary DNA extraction.
Mechanism and Rationale
The efficacy of the Water Dilution Protocol can be understood through its impact on the sample matrix and the physical chemistry of extraction.
Diagram 2: Conceptual mechanism of how water dilution improves DNA recovery.
- Inhibitor Dilution: Urine contains potent PCR inhibitors such as urea and various metabolic salts. By diluting the sample, WDP reduces the concentration of these inhibitors, diminishing their capacity to interfere with downstream enzymatic reactions like PCR [40]. This mechanism is reflected in the improved 260/230 ratios.
- Enhanced Lysis Efficiency: The dilution step may reduce overall sample viscosity, potentially leading to more efficient cell lysis and DNA release during the subsequent buffer addition steps.
- Contrast with Other Methods: The Standard Protocol processes urine directly, risking co-precipitation of inhibitors with DNA. The Chelation-Assisted Protocol (CAP) uses Tris-EDTA buffer to dissolve urinary crystals [40]; however, its poor performance in the cited study led to its exclusion, suggesting that simple chelation is insufficient for this matrix.
The Water Dilution Protocol (WDP) establishes a simple, reliable, and highly effective method for extracting microbial DNA from urine. By prioritizing DNA purity and minimizing the impact of common PCR inhibitors through a straightforward pre-dilution step, WDP ensures superior performance for sensitive downstream applications like 16S rRNA sequencing and microbiome analysis [40]. Its ability to yield high-quality, reproducible data makes it an invaluable tool for advancing research in urinary biomarkers and microbial ecology, particularly in the context of genitourinary cancers and other urological diseases. For researchers aiming to maximize the fidelity of their urinary microbiome data, integrating WDP into their sample preparation workflow is a highly recommended strategy.
Solving Common Challenges in Microbial DNA Preparation
The presence of polymerase chain reaction (PCR) inhibitors in biological and environmental samples represents a significant challenge in molecular biology, particularly in microbial DNA extraction research. Substances such as heme, humic acids, and polysaccharides can co-purify with nucleic acids and potently inhibit DNA polymerases, leading to reduced amplification efficiency or complete PCR failure [61]. These inhibitors are prevalent in diverse sample types frequently encountered in research and diagnostic settings, including blood, soil, feces, and plant materials [61] [62]. The impact of these interfering substances extends across various molecular applications, including quantitative PCR (qPCR), digital PCR (dPCR), and massively parallel sequencing (MPS), potentially compromising the accuracy of microbial detection, genotyping, and diagnostic results [62]. Understanding the mechanisms of these inhibitors and implementing effective strategies to overcome them is therefore fundamental to ensuring reliable downstream analyses in microbial research and drug development.
Mechanisms of PCR Inhibition
PCR inhibitors disrupt the amplification process through multiple distinct mechanisms, primarily targeting the DNA polymerase, nucleic acids, or essential co-factors.
Inhibition of DNA Polymerase
Many inhibitors function by directly binding to the DNA polymerase enzyme, thereby preventing the elongation of DNA strands during PCR.
- Heme and Hematin: These porphyrin molecules, derived from hemoglobin in blood samples, can inhibit PCR through the release of iron ions, which affect the pH of the reaction and disrupt polymerase activity [63]. Hemoglobin disintegrated by proteinase K is particularly inhibitory, while intact hemoglobin shows less effect [63].
- Humic Acids: These complex organic molecules, prevalent in soil and sediment samples, are potent inhibitors of Taq DNA polymerase, with inhibition occurring at concentrations of less than 1 ng per PCR reaction [64] [62]. Humic acids are degradation products of lignin and represent a heterogeneous group of dibasic weak acids with carboxyl and hydroxyl groups [62].
- Melanin: This metabolite is known to bind reversibly to thermostable DNA polymerase and inhibit its activity [63] [65].
- Immunoglobulin G (IgG): Antibodies present in blood and plasma can form complexes with single-stranded DNA, preventing primer annealing or extension [63]. While Taq polymerase and AmpliTaq cannot amplify DNA in the presence of IgG, the Tth enzyme demonstrates greater tolerance [63].
Interaction with Nucleic Acids
Some inhibitors interfere with the DNA template itself or with the primers, preventing essential steps in the amplification process.
- Polysaccharides: These can crosslink with the DNA template, preventing strand separation during the denaturation step of PCR [61].
- Humic Substances: In addition to polymerase inhibition, humic acids can sequester fluorescent dyes like ethidium bromide, reducing DNA interaction and interfering with detection in real-time PCR [63].
Cofactor Binding
Certain inhibitors function by chelating or binding to essential cofactors required for polymerase activity.
- EDTA and Tannins: These molecules can bind to magnesium ions (Mg²⁺), a critical cofactor for DNA polymerase, thereby decreasing the reaction rate or completely inactivating the enzyme [61].
Table 1: Common PCR Inhibitors, Their Sources, and Primary Mechanisms of Action
| Inhibitor | Common Sample Sources | Primary Mechanism |
|---|---|---|
| Heme/Hematin | Blood, tissues | Release of iron ions affecting pH; polymerase binding [63] |
| Humic Acids | Soil, sediment, water | Direct inhibition of Taq polymerase; fluorescence quenching [63] [62] |
| Polysaccharides | Feces, plants, soil | Crosslinking with DNA; preventing strand separation [61] |
| Immunoglobulin G (IgG) | Blood, plasma | Complex formation with single-stranded DNA [63] |
| Melanin | Hair, skin | Reversible binding to DNA polymerase [63] [65] |
| Calcium ions | Various biological samples | Cofactor interference [65] |
The following diagram illustrates the primary mechanisms through which common PCR inhibitors disrupt the amplification process:
Detection and Assessment of PCR Inhibition
Identifying the presence of PCR inhibitors is a critical step in troubleshooting failed amplification and ensuring reliable results.
Dilution Method
The simplest approach to detect inhibition involves serial dilution of the DNA extract. In uninhibited samples, dilution results in a higher cycle threshold (Ct) value in qPCR due to reduced template concentration. However, in inhibited samples, dilution of the inhibitors may improve amplification efficiency, resulting in a Ct value that is equal to or lower than the undiluted sample [61]. While this method is straightforward, it reduces sensitivity and may not be suitable for samples with low DNA concentration.
Internal Controls
The use of internal amplification controls (IACs) provides a robust method for detecting inhibition. IACs are known quantities of exogenous DNA added to the PCR reaction. Inhibition is indicated by a delay in the Ct value or reduced amplification of the control compared to reactions without sample DNA [66]. This approach is particularly valuable in diagnostic applications where false negatives must be avoided.
Quality Assessment
Spectrophotometric methods can provide indications of contamination through abnormal absorbance ratios (A260/A230 and A260/A280), though they may not detect all inhibitors at concentrations that affect PCR [67].
Strategies for Overcoming PCR Inhibition
Sample Collection and DNA Extraction
The initial steps of sample handling and nucleic acid purification are crucial for minimizing the co-extraction of inhibitors.
Sample Collection Considerations:
- Surface Swabbing: The use of nylon swabs moistened with saline can improve cell recovery while reducing the uptake of inhibitors present in the substrate [63].
- Direct Sampling: For some applications, placing material directly in treatment tubes can increase the number of target cells while potentially minimizing inhibitor exposure [63].
DNA Extraction Methods: Various DNA extraction methods demonstrate different efficiencies in removing common PCR inhibitors. A comparative study evaluated four methods with eight known PCR inhibitors, with results summarized in the table below [65].
Table 2: Comparison of DNA Extraction Methods for Inhibitor Removal
| Extraction Method | Principle | Effectiveness Against Inhibitors | Limitations |
|---|---|---|---|
| PowerClean DNA Clean-Up Kit | Silica-based purification with dedicated inhibitor removal chemistry | Effective against heme, humic acid, collagen, bile salt, hematin, calcium, urea; less effective against indigo [65] | Commercial cost |
| DNA IQ System | Silica-coated paramagnetic beads | Effective against most inhibitors except hematin and indigo at high concentrations [65] | Commercial cost; requires magnetic separator |
| Phenol-Chloroform Extraction | Organic separation of DNA from proteins and contaminants | Effective for humic acids and polysaccharides; requires additional benzyl alcohol for SPS removal [67] [65] | Labor-intensive; hazardous chemicals; may leave inhibitory residues |
| Chelex-100 Method | Chelating resin that binds metal ions | Limited effectiveness; appropriate dilution of extracted DNA required to overcome persistent inhibition [65] [68] | Less effective for complex samples |
Innovative Extraction Additives:
- CTAB-Vitamin Protocol: The combination of cetyl trimethylammonium bromide (CTAB) with a vitamin mixture (pyridoxal and thiamine hydrochloride) in the lysis buffer enables recovery of high-quality genomic DNA from various soils, including those with high humic acid content (up to 100 mg/g of soil) [69]. Adjusting the lysis buffer pH to 7.5 optimizes this method for diverse soil types.
- Benzyl Alcohol Extraction: Effectively removes sodium polyanetholesulfonate (SPS), a potent PCR inhibitor in blood culture media that co-purifies with DNA due to its similar polyanionic nature and alcohol insolubility [67].
The following workflow diagram illustrates a comprehensive approach to processing inhibitor-prone samples:
Chemical and Enzymatic Additives
The addition of specific compounds to PCR reactions can counteract the effects of inhibitors by various mechanisms.
Common PCR Facilitators:
- Bovine Serum Albumin (BSA): Binds to inhibitors such as heme, melanin, and phenols, preventing them from interacting with the DNA polymerase [63]. BSA's ability to bind fatty acids and organic molecules makes it a versatile facilitator for in vitro amplification.
- Betaine: A biologically compatible solute that reduces inhibition, particularly in blood samples, enabling Taq polymerase to function in up to 2% blood when used in combination with other facilitators [64].
- Organic Solvents: Dimethyl sulfoxide (DMSO) and formamide can help reduce inhibition through mechanisms that may involve improving DNA denaturation or preventing nonspecific binding [63].
- Detergents: Inorganic detergents such as Tween 20 and Triton X are used to facilitate the amplification step, though their specific mechanisms are not fully elucidated [63].
Inhibitor-Resistant DNA Polymerases
Engineering of DNA polymerases with enhanced resistance to inhibitors represents a significant advancement in overcoming PCR inhibition.
Mutant Polymerases:
- Klentaq1: An N-terminal deletion mutant of Taq DNA polymerase that demonstrates 10–100-fold greater resistance to whole blood inhibition compared to wild-type Taq [64]. Wild-type Taq is strongly inhibited by 0.1–1% blood, while Klentaq1 maintains activity at higher concentrations.
- Codon 708 Mutants: Specific mutations at codon 708, in both Klentaq1 and full-length Taq, confer enhanced resistance to various inhibitors including whole blood, plasma, hemoglobin, lactoferrin, serum IgG, soil extracts, and humic acid [64]. These mutants also tolerate higher concentrations of intercalating dyes.
Comparative Polymerase Performance: Studies have shown that the inhibitory effect of blood on PCR is primarily upon Taq DNA polymerase, as mutational alteration can overcome inhibition to the extent that DNA purification becomes unnecessary for some applications [64]. Different DNA polymerases exhibit varying degrees of sensitivity to inhibitors; for instance, while Taq polymerase and AmpliTaq Gold are completely inhibited by less than 0.2% whole human blood, other enzymes such as rTth, Tfl, HotTub, and Pwo demonstrate higher tolerance [64].
The Scientist's Toolkit: Research Reagent Solutions
Table 3: Essential Reagents for Overcoming PCR Inhibition
| Reagent/Category | Specific Examples | Function/Application |
|---|---|---|
| Inhibitor-Resistant Polymerases | Klentaq1 mutants, Codon 708 mutants, Phusion Flash | Engineered enzymes tolerant to blood, humic acids, and other inhibitors [64] |
| PCR Facilitators | BSA, Betaine, DMSO, Formamide, Tween 20 | Bind inhibitors, improve DNA denaturation, maintain polymerase activity [63] [64] |
| Commercial Inhibitor Removal Kits | PowerClean DNA Clean-Up Kit, DNA IQ System, OneStep PCR Inhibitor Removal Kit | Designed to remove specific inhibitors (humic acids, tannins, melanin, etc.) during extraction [65] [61] |
| DNA Extraction Additives | CTAB, Vitamin mixture (pyridoxal/thiamine), Potassium chloride | Precipitate humic acids and prevent DNA losses during extraction [69] |
| Specialized Lysis Buffers | TENNS buffer (pH 9.5), CTAB-based buffers | Optimized for cell lysis while maintaining inhibitor separation [69] |
Effective management of PCR inhibitors is essential for successful microbial DNA analysis across diverse sample types. A comprehensive strategy that begins with appropriate sample collection, followed by optimized DNA extraction methods, and culminates in the use of inhibitor-resistant polymerases and chemical facilitators provides the most robust approach to overcoming amplification challenges. The selection of specific techniques should be guided by the sample type, the nature of the anticipated inhibitors, and the requirements of downstream applications. As molecular technologies continue to advance, particularly in the fields of microbial ecology and clinical diagnostics, the development of more effective inhibitor-resistant reagents and streamlined protocols will further enhance our ability to obtain reliable results from even the most challenging samples.
Optimizing DNA Yield from Low-Biomass and Challenging Samples
The pursuit of high-quality, amplifiable DNA is a prerequisite for robust microbiome and metagenomic studies. This endeavor becomes particularly challenging when working with low-biomass samples, where the minimal microbial load is compounded by factors such as co-extracted inhibitors and high contamination potential. These challenges can critically skew the representation of microbial communities and compromise the validity of downstream analyses [70] [71]. Within the broader context of sample preparation research for microbial DNA extraction, optimizing yield and fidelity from these difficult samples is therefore paramount. This application note details validated, sample-specific strategies to overcome these hurdles, providing structured protocols and data to guide researchers in obtaining sufficient, high-integrity DNA for sequencing from even the most challenging sources.
Optimization Strategies for Key Sample Types
The strategies for optimizing DNA yield must be tailored to the specific nature of the low-biomass sample. The table below summarizes the core challenges and recommended solutions for different sample types, as evidenced by recent research.
Table 1: DNA Yield Optimization Strategies for Different Low-Biomass Sample Types
| Sample Type | Core Challenge | Recommended Solution | Key Outcome |
|---|---|---|---|
| Skin & Nasal Lining Fluid [72] [73] | Extremely low microbial load; high contamination risk from reagents and environment. | Use of agar-containing sampling solution (AgST); precipitation-based DNA extraction. | Significantly increased DNA yield; reduced relative abundance of contaminant DNA. |
| Chlorinated Drinking Water [70] | Low cell density (10²–10³ cells/mL); filter membrane choice affects yield. | Use of 0.2 µm polycarbonate filters; sample incubation to increase biomass. | Marked improvement in DNA yield and quality (16S gene copy number). |
| Peaty & Silty Permafrost [71] | External contamination during coring; co-extraction of potent PCR inhibitors. | Rigorous decontamination (bleaching, washing, scraping); use of modified ZymoBIOMICS DNA Microprep kit. | Acquisition of contaminant-free, PCR-amplifiable DNA from inhibitory samples. |
The following diagram illustrates the critical decision points and pathways in a generalized workflow for optimizing DNA extraction from low-biomass samples, integrating the strategies discussed.
Detailed Experimental Protocols
Protocol 1: Enhanced DNA Recovery from Skin and Nasal Fluid
This protocol is adapted from methods developed to address the extreme low biomass of skin and nasal lining fluid (NLF) samples [72] [73].
Sample Collection with Agar-Containing Solution (AgST):
- Prepare AgST Solution: Create a sampling solution of 0.2% (w/v) agar in a sterile, DNA-free buffer (e.g., ST or PBS). Gently heat to dissolve the agar and maintain in a liquid state at 40-50°C until use.
- Sample Collection: Moisten a sterile swab with the warm AgST solution. Firmly swab a defined surface area (e.g., 5 cm² for skin) using a consistent technique.
- Storage: Immediately place the swab tip into a sterile tube containing 1-2 mL of pure AgST solution. Vortex thoroughly to release biomass. Store samples at -80°C.
DNA Extraction using Enzymatic Lysis with Agar:
- Cell Lysis: Transfer the AgST sample to a lysing matrix tube. Add lysozyme (for Gram-positive bacteria) and/or meta-polyzyme (for fungi/yeast) and incubate at 37°C for 30-60 minutes.
- Agar-assisted Precipitation: Add 0.2% (w/v) agar to the lysate. Proceed with phenol-chloroform extraction followed by isopropanol precipitation. The agar acts as a co-precipitant, significantly reducing DNA loss [73].
- Purification: Wash the DNA pellet with freshly prepared 80% ethanol, air-dry, and resuspend in nuclease-free water or TE buffer.
Protocol 2: DNA Extraction from Low-Biomass Water Samples
This protocol is optimized for challenging water samples, such as chlorinated drinking water, where cell density is very low [70].
Biomass Concentration:
- Filter Selection: Use a 0.2 µm polycarbonate (PC) filter membrane. Research shows PC membranes markedly outperform other materials (e.g., PES, PVDF) in terms of DNA yield and quality from low-biomass water [70].
- Filtration: Filter a measured volume of water (e.g., 1 liter) through the membrane under gentle vacuum pressure.
DNA Extraction and Yield Enhancement:
- Direct Incubation (Alternative): For samples where filtration is impractical, a 1-liter water sample can be incubated without nutrient spiking for 24-48 hours to allow for modest microbial growth, thereby increasing the starting biomass [70].
- Cell Lysis from Filter: Aseptically cut the filter into pieces and place them in a PowerBead Pro tube. Use a combination of mechanical lysis (bead beating) and enzymatic lysis to ensure disruption of diverse cell types.
- DNA Purification: Use a column-based kit (e.g., DNeasy PowerWater Kit) or a precipitation method for purification. Elute in a small volume (e.g., 50-100 µL) to concentrate the DNA.
Protocol 3: Decontamination and DNA Extraction from Permafrost
This protocol is designed for peaty and silty permafrost samples, which have low biomass and are prone to contamination and inhibition [71].
Sample Decontamination:
- Tracer Application: To monitor contamination, apply a microbial tracer (e.g., E. coli with a plasmid marker) to the core sections in the field and lab.
- Surface Decontamination: Use a combined method of bleaching, washing, and physical scraping (Protocol 'g' from [71]). This method has been shown to completely remove external contaminants while preserving sufficient material for DNA extraction.
- Subsampling: After decontamination, subsample from the sterile interior of the core for DNA extraction.
Inhibitor-resistant DNA Extraction:
- Kit Selection: Use a modified ZymoBIOMICS DNA Microprep kit. This kit was the only one tested that successfully acquired PCR-amplifiable DNA from both peaty and silty permafrost samples [71].
- Modifications: Incorporate additional bead-beating steps and potentially extra purification washes to remove humic acids and other co-extracted inhibitors common in permafrost.
The Scientist's Toolkit: Research Reagent Solutions
Successful DNA extraction from challenging samples relies on the strategic selection of reagents and kits. The following table catalogues essential solutions featured in the cited research.
Table 2: Key Research Reagents for Optimized DNA Extraction from Low-Biomass Samples
| Reagent / Kit Name | Primary Function | Application Context | Key Advantage |
|---|---|---|---|
| Agar-containing Solution (AgST) [73] | Sample collection & DNA co-precipitant | Skin, nasal fluid, other extremely low-biomass surfaces | Dramatically increases DNA yield by reducing loss during precipitation. |
| Polycarbonate Filter (0.2 µm) [70] | Biomass concentration from liquid samples | Low-biomass water (e.g., chlorinated drinking water) | Superior DNA yield and quality compared to other membrane materials. |
| ZymoBIOMICS DNA Microprep Kit [71] | DNA extraction & purification | Inhibitor-rich samples (e.g., permafrost, peat) | Effectively removes inhibitors; yields PCR-amplifiable DNA where other kits fail. |
| PowerSoil DNA Isolation Kit [73] | DNA extraction & purification | Soil, sediment, and complex environmental samples | Widely used for tough samples; performance can be enhanced with agar [73]. |
| NEB Monarch Spin gDNA Kit [2] | Genomic DNA extraction | Bacterial and fungal pure cultures (for NO-MISS protocol) | Reliable and consistent gDNA extraction for isolate sequencing. |
| Maxwell RSC PureFood Pathogen Kit [2] | Automated DNA extraction | High-throughput applications; hard-to-lyse organisms | Automated bead-beating method for universal and consistent lysis. |
Optimizing DNA yield from low-biomass and challenging samples is a non-trivial yet surmountable challenge that hinges on a methodical, sample-tailored approach. The protocols and data presented herein demonstrate that strategic interventions—such as the use of agar to enhance yield, rigorous decontamination protocols, and the careful selection of filter membranes and extraction kits—can reliably produce DNA of sufficient quantity and quality for advanced molecular analyses. As the field of microbial ecology continues to explore environments with ever-lower biomass, the development and validation of robust sample preparation methods will remain a critical area of research, forming the foundational step for all subsequent discoveries.
In microbial DNA extraction research, the integrity of scientific results is fundamentally dependent on the purity of the extracted nucleic acids. Contamination, the undesirable introduction of exogenous DNA, can obscure true microbial signals, compromise data validity, and lead to erroneous conclusions in downstream analyses such as shotgun metagenomic sequencing [74]. The increasing sensitivity of modern sequencing technologies, while powerful, exacerbates this issue by amplifying trace contaminants that would previously have gone undetected [75]. Within the context of sample preparation for microbial DNA extraction, contamination control is not merely a supplementary procedure but a foundational component of the research methodology. This document outlines a comprehensive, checklist-based framework designed to empower researchers, scientists, and drug development professionals to systematically prevent, identify, and control contamination throughout the DNA extraction workflow.
A Systematic Framework for Contamination Control
Effective contamination management requires a dual-pronged strategy encompassing both robust preventative measures and reliable detection mechanisms [75]. The following sections detail this framework, which is visualized in the workflow below.
Core Principles: Prevention and Detection
The two core areas of activity in a contamination control process are Prevention and Detection [75].
Preventative Measures are designed to proactively minimize the chance of contamination occurring. These include:
- Use of personal protective equipment (PPE) and physical barriers by staff [75].
- Effective spatial and temporal separation of samples from different sources and individuals [75].
- Restricting access to critical areas containing exhibits and consumables [75].
- Use of consumables certified to be free from detectable human DNA, such as those complying with standards like ISO 18385 [75].
- Training practitioners to be aware of contamination risks and the proper use of control measures [75].
Detection Mechanisms are designed to identify contamination when it occurs, despite preventative efforts. These primarily entail:
- Use of negative control samples at appropriate stages of the DNA analysis process, such as during DNA extraction and amplification [75].
- Comparing DNA profiles generated from items against elimination databases containing DNA profiles from laboratory personnel [75].
- Cross-checking profiles within the same batch of samples and from different batches processed in the same laboratory [75].
- Investigating unexpected results and conducting regular reviews of process failure reports [75].
A practical checklist approach in the lab can significantly reduce contamination risk [1]. The table below summarizes common contamination sources and their impacts, followed by a detailed, actionable checklist.
Table 1: Common Contamination Sources in Sequencing Workflows
| Source | Description / Risk | Impact on Results |
|---|---|---|
| Reagent "Kitome" | Low-level DNA inherent in extraction reagents or buffers (varies by batch/brand). | False-positive reads, especially critical in low-input or metagenomic assays [1]. |
| Cross-Sample Carryover | DNA or amplicons from one sample enter another via pipetting, aerosols, or splashes. | Misassigned reads, chimeras, and false results [1]. |
| Post-PCR Product Contamination | Amplified DNA or libraries leak back into upstream, pre-amplification areas. | Exponential amplification of contaminants in new batches, potentially overwhelming the true signal [1]. |
| Operator/Environmental | Introduction of contaminants from skin, gloves, lab surfaces, dust, or clothing. | Background noise and mixed signals, complicating data interpretation [1]. |
Laboratory Contamination Prevention Checklist
Implement the following procedures to mitigate the risks outlined above:
- ☐ Segregate Pre- and Post-PCR Areas: Maintain fully separate physical areas for pre-PCR (sample preparation, DNA extraction) and post-PCR (library amplification, analysis) activities. Personnel must not move between these areas without changing PPE [75]. Ideally, use a service hatch for transferring samples to prevent airborne contamination [75].
- ☐ Use Dedicated Equipment and Consumables: Equip each zone (pre-PCR, post-PCR) with dedicated pipettes, tubes, and other equipment. Always use aerosol-resistant filter tips or positive displacement pipettes to prevent aerosol-borne contamination [1].
- ☐ Aliquot Reagents: Aliquot all reagents (e.g., primers, buffers, enzymes) into single-use vials to minimize repeated opening and the risk of introduction of contaminants or nucleases [1].
- ☐ Enforce Rigorous Decontamination: Regularly decontaminate surfaces and tools using validated procedures, which may include 10-15% bleach solutions, UV irradiation, and commercial DNA decontamination reagents [1].
- ☐ Process Negative Controls: Include negative controls (e.g., extraction blanks with no sample) and no-template controls (NTC) in every workflow run to monitor for reagent or process-related contamination [1] [74].
- ☐ Manage Batch Processing: Keep batch sizes manageable. Process casework samples and reference samples on separate microtiter plates. Minimize the time samples are held in open receptacles and design robotic handling to prevent sample-to-sample transfer [75].
- ☐ Use Certified DNA-Free Consumables: Source consumables that are certified to be free from detectable human DNA, compliant with standards such as PAS 377:2023 or ISO 18385:2016 [75].
DNA Extraction Protocol with Enhanced Contamination Controls
This protocol is adapted for extracting microbial DNA directly from human tissue samples, a context where host DNA contamination is a significant challenge. The following diagram and protocol steps incorporate specific modifications to deplete host DNA and preserve microbial DNA, based on an optimized method for nanopore sequencing [74].
Materials and Equipment
Research Reagent Solutions
| Item | Function / Application |
|---|---|
| Ultra-Deep Microbiome Prep Kit (Molzym) or equivalent | Designed for simultaneous removal of host DNA and extraction of enriched microbial DNA from complex sample types like tissue biopsies [74]. |
| Proteinase K | Digests proteins and degrades nucleases, crucial for efficient cell lysis and liberation of nucleic acids. The extended incubation improves human cell lysis [74]. |
| Tryptic Soy Broth (TSB) or other non-inhibitory buffer | Used to wash and resuspend the microbial pellet after initial lysis and centrifugation, helping to remove residual human DNA and contaminants [74]. |
| DNeasy 96 PowerSoil Pro QIAcube HT Kit (Qiagen) | An alternative for standardized, high-throughput DNA extraction from complex samples, often used with automated systems like the QIAcube HT [76]. |
| Aerosol-Resistant Filter Tips | Prevent cross-contamination between samples during pipetting by trapping aerosols within the tip [1]. |
| Nuclease-Free Water | Used for preparing reagents and eluting DNA; certified to be free of nucleases that would degrade the sample. |
Laboratory Equipment
- TissueLyser II (Qiagen) [76]
- QIAcube HT Instrument (Qiagen) or similar automated system [76]
- Centrifuge capable of 14,000 × g [74]
- Qubit 4 Fluorometer (Thermo Fisher Scientific) or similar for fluorometric quantification [76] [1]
- Bioanalyzer 4200 System (Agilent Technologies) or TapeStation for DNA integrity assessment [76] [1]
Step-by-Step Procedure
Sample Lysis:
- Place up to 25 mg of tissue biopsy in a sterile, DNA-free tube.
- Add the provided lysis buffer and Proteinase K from the Ultra-Deep Microbiome Prep kit.
- Incubate at 56°C for 20 minutes (an extension from the standard 10-minute protocol to enhance human cell lysis) [74].
Human DNA Depletion (Differential Lysis):
- Centrifuge the lysate at 14,000 × g for 10 minutes. This pellets intact microbial cells while the supernatant contains lysed human cells and free human DNA.
- Carefully discard the supernatant.
- Resuspend the pellet in 1 mL of Tryptic Soy Broth (TSB) to wash the microbial cells.
- Optional Enhanced Depletion: For samples with very high human DNA content, repeat the lysis and centrifugation step on the resuspended pellet to further deplete human DNA [74].
Microbial DNA Extraction:
- Proceed with the manufacturer's protocol for microbial DNA extraction from the resulting pellet. This typically involves further lysis of microbial cells, binding DNA to a column, washing, and elution.
- Elute the DNA in a low-EDTA, nuclease-free buffer (e.g., 10 mM Tris-HCl, pH 8.0-8.5) compatible with downstream library preparation [1].
Quality Control and Validation
Post-extraction QC is critical before proceeding to sequencing.
- Fluorometric Quantification: Use a Qubit fluorometer for accurate double-stranded DNA quantification. Avoid reliance solely on UV spectrophotometry, which can be skewed by contaminants [1].
- Purity Assessment: Measure A260/A280 and A260/A230 ratios via spectrophotometry (e.g., NanoDrop). Acceptable ranges are ~1.8 for DNA and ~2.0 for RNA; A260/230 should ideally be >1.8 [1].
- Integrity Analysis: Assess DNA fragmentation using gel electrophoresis (e.g., TapeStation or Bioanalyzer). For RNA, use the RNA Integrity Number (RIN) [1].
- qPCR for Contamination Monitoring: Perform quantitative PCR (qPCR) targeting a human gene (e.g., β-globin, HBB) and a universal bacterial gene (e.g., 16S rRNA) to quantify the ratio of human to microbial DNA and assess the effectiveness of the depletion step [74].
Data Presentation: Quantifying Contamination Control Efficacy
The success of contamination control protocols must be validated with quantitative data. The following table summarizes key QC metrics and their implications.
Table 2: Key Quality Control Metrics and Their Interpretation
| QC Metric | Target / Acceptable Range | Significance & Implication of Deviation |
|---|---|---|
| DNA Yield (Qubit) | Sufficient for library prep protocol. | Low yield: Inefficient extraction, over-degradation. High yield (vs. spectrophotometry): Possible RNA or contaminant presence [1]. |
| A260/A280 Ratio | ~1.8 (DNA); ~2.0 (RNA). | Significantly lower: Protein or phenol contamination [1]. |
| A260/A230 Ratio | >1.8 (Ideal). | Significantly lower: Contamination by salts, carbohydrates, or guanidine [1]. |
| Fragment Size (Bioanalyzer) | Distribution appropriate for sequencing (e.g., main peak >1000 bp for WGS). | Shift to lower sizes: Excessive degradation or fragmentation [1]. |
| qPCR (HBB Ct Value) | As high as possible (>30-35, indicating low abundance). | Low Ct value: Inefficient human DNA depletion, high levels of host contamination remain [74]. |
| Negative Control Result | No amplification or sequencing reads. | Amplification/Reads in control: Indicates reagent or process contamination [1] [75]. |
Effective contamination control is demonstrated by data. For instance, in a study optimizing DNA extraction from infected tissue, a modified protocol that included an additional human DNA depletion step resulted in a clear increase in the Ct value for the human HBB gene from a mean of 28.6 to 32.1 (a 3.5 Ct increase), representing an approximately 10-fold reduction in human DNA, while successfully preserving the target microbial (S. aureus) DNA [74]. This kind of quantitative validation is essential for trusting downstream sequencing results.
Best Practices for Handling GC-Rich Genomes and Difficult-to-Lyse Organisms
The success of downstream genomic analyses, including sequencing and PCR, is fundamentally dependent on the initial quality and integrity of the extracted DNA. This is particularly true for two categories of challenging samples: microorganisms with robust cell walls that resist lysis and genomes characterized by high guanine-cytosine (GC) content. Difficult-to-lyse organisms, such as Mycobacterium spp., Bacillus spores, and various fungi, require specialized disruption methods to access their genetic material efficiently. Concurrently, GC-rich genomes present obstacles during amplification and sequencing due to the formation of stable secondary structures. This application note synthesizes current methodologies and protocols to address these dual challenges, ensuring reliable and high-quality DNA recovery for advanced research and drug development applications.
Sample Preparation and DNA Extraction for Difficult-to-Lyse Organisms
Efficient cell lysis and DNA release are critical for difficult-to-lyse organisms. The extraction efficiency between different protocols can vary surprisingly widely, making method selection paramount [77].
Organism-Specific Lysis Methodologies
A one-size-fits-all approach is ineffective for microbial lysis. The following table summarizes recommended methods for various challenging organisms, as detailed in the Nanopore NO-MISS protocol and supporting research [2] [77].
Table 1: DNA Extraction Methods for Different Microorganism Types
| Organism Type | Recommended Lysis Method | Key Reagents & Kits | Protocol Notes |
|---|---|---|---|
| Gram-positive Bacteria (e.g., Staphylococcus aureus) | Chemical + Enzymatic Lysis | Lysozyme, SDS, Tris-HCl [2] | Optimized for organisms like S. aureus and S. epidermidis. |
| Hard-to-Lyse Bacteria (e.g., Mycobacterium spp.) | Bead-Beating + Chemical Lysis | Lysozyme, Empty FastPrep Lysing Matrix tubes, Glass beads [2] | A combination of mechanical and chemical disruption is essential. |
| Fungi/Yeast (e.g., Candida albicans) | Enzymatic Lysis | MetaPolyzyme [2] | Suitable for fungi/yeast isolates; up to 8-plexing for 50x coverage. |
| General Bacteria (Universal) | Automated Bead-Beating | Maxwell RSC PureFood Pathogen Kit, RNase A, Proteinase K [2] | For high throughput and universal applications. |
| Environmental Samples (e.g., Fermenter Sludge) | Kit-Based (vs. Traditional CTAB) | Silica membrane kits, Guanidinium thiocyanate-based buffers [13] [78] | Kit systems show excellent extraction efficiency and reproducibility vs. traditional methods. |
Assessing DNA Extraction Efficiency
A significant challenge in protocol development is determining the true efficiency of DNA release. Traditional cell counting methods are hampered by clumping and variable genome copy numbers. The acid/HPLC method provides a solution by chemically quantifying the total DNA and RNA content in a bacterial sample, allowing for precise calculation of extraction efficiency [77].
- Method Principle: The technique is based on selective acid-catalyzed depurination of DNA. The quantity of DNA is calculated from the purines (adenine and guanine) released, while RNA in the same sample is quantified via alkaline degradation to ribonucleoside monophosphates. The released compounds are separated and quantified using HPLC [77].
- Key Finding: Studies employing this method have revealed "surprisingly large differences in efficiency between methods," underscoring the importance of rigorous, quantitative protocol validation, especially for hardy organisms like Mycobacterium smegmatis [77].
Overcoming Challenges in GC-Rich Genome Analysis
GC-rich sequences can form stable secondary structures that impede polymerase progression during PCR and sequencing, leading to poor yield, false results, or complete amplification failure.
Specialized Reagents and Kits for GC-Rich Templates
Specialized PCR systems are required to successfully amplify GC-rich targets. These systems often include proprietary buffers and enzyme blends designed to overcome template secondary structures.
Table 2: Reagent Solutions for Challenging Genomic Analyses
| Reagent / Kit Name | Function / Application | Key Features / Components | Research Context |
|---|---|---|---|
| GC-RICH PCR System (Roche) | Amplification of difficult templates like GC-rich targets. | Enzyme blend of Taq and proofreading Tgo polymerase; Includes GC-RICH Resolution Solution [79]. | Enables amplification of fragments up to 5 kb; provides higher yield and fidelity than Taq alone. |
| Fully Enzymatic Synthesis (FES) | Production of long, pure DNA oligos. | Enzyme-based synthesis; operates at high temperature (up to 70°C) and neutral pH [80]. | Synthesizes sequences with high GC content, long homopolymers, and repetitive elements. |
| Rapid Barcoding Kit (SQK-RBK114) (Oxford Nanopore) | Rapid library prep for sequencing. | Compatible with R10.4.1 flow cells which improve accuracy [2]. | Part of an end-to-end workflow (NO-MISS) for microbial isolate sequencing. |
| Guanidinium Thiocyanate (GuSCN) | Lysis buffer component for in-house DNA extraction. | Chaotropic salt that denatures proteins and aids in nucleic acid binding to silica [13]. | A cost-effective alternative; shown to have good DNA recovery and reproducible results. |
Optimized Workflow for Sequencing GC-Rich Microbial Genomes
Integrating specialized extraction and analysis methods into a cohesive workflow is key to success. The following diagram illustrates a recommended pipeline for handling difficult-to-lyse organisms with potentially GC-rich genomes.
Diagram: A workflow for processing difficult-to-lyse and GC-rich microbial genomes, integrating specialized lysis and amplification steps.
Comprehensive Experimental Protocols
Protocol: Bead-Beating DNA Extraction for Difficult-to-Lyse Organisms
This protocol is adapted from the Nanopore NO-MISS guide and supporting literature for robust cell disruption [2] [81].
- Sample Input: 1 ml liquid overnight culture (~1 x 10^8 – 10^9 cfu/ml) [2].
Materials & Reagents:
Methodology:
- Cell Pellet Formation: Centrifuge the culture sample and discard the supernatant.
- Mechanical Lysis:
- Resuspend the pellet in the appropriate lysis buffer and transfer to a PowerBead Pro tube.
- Homogenize using the Bead Ruptor Elite. Parameters (speed, time) must be optimized for the specific organism to balance lysis efficiency against DNA shearing [81].
- Centrifuge the tubes to pellet debris.
- Nucleic Acid Purification:
- Transfer the supernatant to a new tube.
- Perform a phenol:chloroform extraction to remove proteins.
- Precipitate the DNA from the aqueous phase with isopropanol.
- Wash the DNA pellet with 70% ethanol, air-dry, and resuspend in nuclease-free water or TE buffer.
- Post-Extraction Quality Control: Quantify DNA using a fluorescence-based method (e.g., Qubit with PicoGreen) for greater accuracy, as spectrophotometry can be misled by co-eluted impurities [78].
Protocol: PCR Amplification of GC-Rich Regions
This protocol is based on the Roche GC-RICH PCR System specifications [79].
Reaction Setup:
- Template DNA: 1–100 ng of purified genomic DNA.
- GC-RICH Enzyme Mix: 2 U per 50 µL reaction.
- GC-RICH PCR Reaction Buffer (5X): 1X final concentration.
- GC-RICH Resolution Solution: Optimized concentration (varies by template).
- PCR Nucleotide Mix: 200 µM of each dNTP.
- Primers: 0.1–1 µM each.
- PCR Grade Water: to volume.
Thermocycling Conditions:
- Initial Denaturation: 95°C for 2 minutes.
- Amplification (35–40 cycles):
- Denaturation: 95°C for 30 seconds.
- Annealing: 55–65°C (primer-specific) for 30 seconds.
- Extension: 72°C (optimal for this enzyme blend) for 1 minute per 1 kb.
- Final Extension: 72°C for 5 minutes.
Critical Notes:
- The GC-RICH Resolution Solution is a key component for disrupting secondary structures and must be titrated for optimal results.
- The enzyme blend includes a proofreading (3'→5' exonuclease) activity, resulting in higher fidelity amplification compared to standard Taq polymerase [79].
Quality Control and Validation
Robust quality control is non-negotiable when working with challenging samples. Key parameters and methods are summarized below.
Table 3: Quality Control Metrics for DNA Extraction and Amplification
| QC Parameter | Recommended Method | Acceptance Criteria | Notes & Pitfalls |
|---|---|---|---|
| DNA Quantity | PicoGreen fluorescence assay [78] | Sample dependent. | More trustworthy than spectrophotometry for kit-based extracts with chaotropic salts [78]. |
| DNA Purity | Spectrophotometry (A260/280, A260/230) | A260/280 ~1.8; A260/230 >2.0 | Low A260/230 may indicate GuSCN carryover, which may not inhibit PCR [78]. |
| Extraction Efficiency | Acid/HPLC method [77] | Maximize (>90% ideal) | Quantifies total DNA in sample pre-extraction to calculate release efficiency [77]. |
| PCR Suitability | qPCR dilution assay [78] | Efficiency 90–110% [78] | Detects inhibitors; efficiency calculated from standard curve slope. |
| DNA Integrity | Fragment Analyzer / Bioanalyzer | High Molecular Weight | Assesses shearing from mechanical lysis. |
Mastering the sample preparation phase is the foundation for successful genomic analysis of challenging microorganisms. For difficult-to-lyse organisms, this involves selecting a combination of mechanical and chemical lysis methods tailored to the cell wall structure, with efficiency validated by quantitative methods like acid/HPLC. For GC-rich genomes, success relies on using specialized reagents and polymerases designed to mitigate secondary structure formation. By integrating the detailed protocols, workflows, and quality control measures outlined in this application note, researchers and drug development professionals can significantly improve the reliability and quality of their data derived from the most challenging microbial samples.
In microbial DNA extraction research, the isolation of genetic material is merely the first step toward obtaining sequencing-ready samples. Post-extraction polishing encompasses the critical techniques of size selection and cleanup that refine crude nucleic acid extracts, transforming them into high-quality input material for demanding downstream applications such as next-generation sequencing (NGS), long-read sequencing, cloning, and qPCR. This process is indispensable for removing contaminants, selecting specific fragment size ranges, and concentrating samples to meet the stringent requirements of modern genomic platforms.
The importance of effective polishing cannot be overstated, as the quality of input DNA profoundly influences the success of subsequent analyses. Enzymatic efficiency during library preparation depends heavily on sample purity, as contaminants such as phenol, salts, or humic acids can inhibit essential enzymes involved in end repair, adapter ligation, and PCR amplification [1]. Furthermore, fragment integrity directly affects sequencing yield, with highly fragmented or nicked DNA leading to inefficient cluster generation and poorer read mapping [1]. In applications such as microbial metagenomics, where samples may originate from challenging matrices like soil, sediment, or host organisms, effective polishing becomes even more crucial for obtaining accurate community representation [82].
Core Principles of Nucleic Acid Cleanup and Size Selection
Fundamental Mechanisms
Post-extraction polishing techniques operate on several well-established biochemical principles for separating nucleic acids from contaminants and selecting by size:
- Solid-Phase Reversible Immobilization (SPRI): This mechanism underpins most magnetic bead-based methods, where DNA binds to carboxylated magnetic beads in the presence of polyethylene glycol (PEG) and high salt concentrations. The binding is reversible, allowing DNA elution in low-salt buffers [34]. The bead-to-sample ratio precisely controls size selection, with higher ratios retaining smaller fragments.
- Silica Membrane Binding: Spin columns utilize silica membranes that bind DNA in the presence of chaotropic salts, which disrupt hydrogen bonding and facilitate DNA adsorption to the silica surface. Impurities are removed through wash steps, and pure DNA is eluted in low-salt buffers [34] [1].
- Selective Precipitation: High-molecular-weight (HMW) DNA can be preferentially precipitated using buffers containing PVP and specific salt concentrations, allowing shorter fragments to remain in solution [83]. This method is particularly valuable for long-read sequencing applications.
Critical Parameters for Success
Several factors significantly impact the efficiency and outcome of polishing procedures:
- DNA Integrity: Starting material with minimal fragmentation responds better to size selection protocols, especially those targeting longer fragments [1].
- Sample Purity: The presence of contaminants such as humic acids, polysaccharides, or residual proteins can interfere with binding chemistry and must be addressed through optimized wash steps [82] [1].
- Buffer Composition: The pH, salt concentration, and presence of additives like PEG dramatically affect binding specificity and efficiency in both bead-based and column-based methods [34] [83].
- Technique Sensitivity: Factors such as complete removal of residual ethanol, avoidance of bead over-drying, and appropriate incubation times significantly impact recovery yields [34] [1].
Comparative Analysis of Polishing Technologies
Magnetic Bead-Based Methods
Magnetic bead technology has emerged as a powerful alternative to traditional spin columns, particularly for high-throughput and automated workflows. The HighPrep PCR system exemplifies this approach, utilizing SPRI chemistry to selectively bind DNA based on specific bead-to-sample ratios [34]. This method offers exceptional flexibility, as adjusting the ratio enables simultaneous cleanup and size selection in a single protocol.
The advantages of magnetic bead systems include higher recovery rates (94-96% compared to 70-85% for spin columns), reduced hands-on time, and compatibility with automation platforms such as the Thermo Fisher KingFisher Flex, Hamilton Microlab STAR, and Beckman Coulter Biomek systems [34]. Additionally, bead-based methods demonstrate superior performance with fragmented DNA samples common in FFPE and ancient DNA applications.
Table 1: Magnetic Bead Size Selection Ratios for DNA Fragments
| Bead-to-Sample Ratio | DNA Fragment Size Retained |
|---|---|
| 0.6x | >500 bp |
| 0.8x | >300 bp |
| 1.0x | >100 bp |
| 1.8x | >50 bp |
Spin Column-Based Cleanup
Despite the advancement of bead-based methods, spin columns remain widely used, particularly in low-throughput settings or when specialized equipment is unavailable. These systems employ a silica membrane in a column format that binds DNA in the presence of chaotropic salts. While they offer simplicity and require no specialized equipment beyond a centrifuge, they present limitations in scalability, reproducibility, and recovery efficiency, especially with low-concentration samples [34].
Spin columns typically exhibit significant DNA loss during binding and wash steps, with smaller fragments (<100 bp) often being selectively lost. They also lack the flexible size selection capabilities of bead-based methods and are not amenable to automation, making them less suitable for high-throughput applications [34].
Precipitation-Based Size Selection
For applications requiring HMW DNA, such as long-read sequencing on Oxford Nanopore or PacBio platforms, precipitation-based methods offer a valuable approach. The protocol from Oxford Nanopore Technologies uses a specialized size selection buffer containing PVP 360,000 and 1.2 M NaCl to preferentially precipitate HMW DNA while leaving shorter fragments in solution [83].
This method can increase read N50 by 10-25 kb in Nanopore sequencing libraries by enriching for longer fragments without significantly impacting sequencing throughput [83]. Typical recovery rates range from 40-60% when using DNA extracted with kits such as the QIAGEN Genomic-tip and QIAGEN Gentra Puregene, with recovery dependent on the initial fragment size distribution of the sample.
Table 2: Performance Comparison of Polishing Technologies
| Feature | Magnetic Beads | Spin Columns | Precipitation-Based |
|---|---|---|---|
| Recovery Yield | 94–96% | 70–85% | 40–60% |
| DNA Size Range | 100 bp – 50 kb | 100 bp – 10 kb | >10 kb |
| Throughput | High (96-well & automation) | Low (manual only) | Low to medium |
| Size Selection | Yes (via bead ratio) | No | Yes (HMW enrichment) |
| Automation Compatibility | Yes | No | Limited |
| Price per Sample | ~$0.90 | ~$1.75 | ~$0.50 (reagent cost) |
| Protocol Time | <15 minutes | 20–30 minutes | 60–90 minutes |
Detailed Experimental Protocols
Magnetic Bead Cleanup and Size Selection
Protocol: HighPrep PCR Bead-Based Cleanup [34]
Reagents and Equipment:
- HighPrep PCR magnetic beads or equivalent SPRI beads
- Freshly prepared 80% ethanol
- Nuclease-free water or TE buffer
- Magnetic stand suitable for tube or plate format
- Adjustable pipettes and tips
Procedure:
- Binding: Transfer up to 50 µL of DNA sample to a clean tube. Add the appropriate volume of thoroughly resuspended magnetic beads based on desired size selection (refer to Table 1 for guidance). Mix thoroughly by pipetting or gentle vortexing.
- Incubation: Allow the sample-bead mixture to stand at room temperature for 5 minutes to enable complete DNA binding.
- Separation: Place the tube on a magnetic stand and allow separation to occur until the solution clears and beads form a pellet (approximately 2 minutes).
- Washing: Carefully remove and discard the supernatant without disturbing the bead pellet. With the tube remaining on the magnetic stand, add 200 µL of freshly prepared 80% ethanol. Incubate for 30 seconds, then remove and discard the ethanol. Repeat this wash step a second time for a total of two washes.
- Drying: After the second wash, ensure all residual ethanol is removed. Air-dry the bead pellet for 3-5 minutes at room temperature. Avoid over-drying, which can reduce elution efficiency.
- Elution: Remove the tube from the magnetic stand. Resuspend the beads in 20-50 µL of nuclease-free water or TE buffer. Mix thoroughly by pipetting and incubate for 2 minutes at room temperature.
- Final Separation: Return the tube to the magnetic stand. After the solution clears (approximately 2 minutes), transfer the eluted DNA to a clean tube.
- Quantification: Quantify the purified DNA using a fluorometric method (e.g., Qubit dsDNA BR Assay) rather than spectrophotometry for accurate measurement of double-stranded DNA concentration.
Semi-Selective Precipitation for HMW DNA
Protocol: Size Selection of HMW DNA by Semi-Selective Precipitation [83]
Reagents and Equipment:
- 3-10 µg of HMW DNA in TE buffer
- 2X size selection buffer (2.5% w/v PVP 360000, 1.2 M NaCl, 20 mM Tris-HCl pH 8)
- 70% ethanol in nuclease-free water
- TE buffer (10 mM Tris-HCl, 1 mM EDTA, pH 8)
- 1.5 ml Eppendorf DNA LoBind tubes
- Benchtop centrifuge
- Water bath or incubator set at 37°C
Procedure:
- Sample Preparation: Dilute 3-10 μg of HMW DNA in 60-100 μL of TE buffer in a 1.5 ml DNA LoBind tube. The final concentration should be approximately 30-150 ng/μL.
- Precipitation: Add an equal volume of the 2X size selection buffer to the DNA solution. Mix thoroughly by pipetting or brief vortexing.
- Centrifugation: Place the tube in a centrifuge with noted orientation. Centrifuge at 10,000 × g at room temperature for 30 minutes. The HMW DNA will form a pellet on the side of the tube facing outward during centrifugation (the pellet may not be visible).
- Supernatant Removal: Carefully aspirate and discard the supernatant without disturbing the pellet.
- Washing: Add 200 μL of 70% ethanol to the tube without disturbing the pellet. Centrifuge at 10,000 × g for 3 minutes and discard the supernatant.
- Repeat Wash: Repeat Step 5 for a total of two washes.
- Elution: Add 50 μL of TE buffer to the DNA pellet. Mix by gently pipetting approximately 5 times using a wide-bore tip to minimize shearing.
- Resuspension: Incubate the tube at 37°C for 30 minutes. Gently agitate the solution every 5 minutes to aid resuspension.
- Quantification: Quantify the size-selected DNA using the Qubit dsDNA BR Assay Kit. Take three replicate measurements to ensure consistency, which indicates homogeneous resuspension. If measurements are inconsistent, extend the elution time or warm the DNA to 50°C to aid resuspension.
Research Reagent Solutions
Table 3: Essential Research Reagents for Post-Extraction Polishing
| Reagent/Kit | Function | Application Notes |
|---|---|---|
| HighPrep PCR Beads | Magnetic bead-based reagent for cleanup and size selection | Suitable for manual and automated workflows; enables flexible size selection via bead ratios [34] |
| Size Selection Buffer | Preferentially precipitates HMW DNA (>10 kb) | Custom formulation with PVP and high-salt concentration; ideal for long-read sequencing [83] |
| Qubit dsDNA BR Assay | Fluorometric quantification of double-stranded DNA | More accurate for sequencing library preparation than spectrophotometric methods [1] |
| DNA LoBind Tubes | Specialized plasticware with reduced DNA binding | Minimizes sample loss, especially critical with low-concentration or precious samples [83] |
| PVP 360,000 | Polymer additive that reduces binding of polyphenolic contaminants | Particularly valuable for plant and environmental samples with high polyphenol content [83] |
| Fresh 80% Ethanol | Wash solution for removing salts and contaminants | Must be freshly prepared to prevent absorption of atmospheric CO₂ that affects pH [34] |
Application-Specific Workflows
Next-Generation Sequencing Library Preparation
For NGS applications, post-extraction polishing is critical for removing enzymatic inhibitors and selecting the appropriate fragment size for library construction. In metagenomic studies, the removal of humic substances and other environmental contaminants is particularly important, as these compounds can inhibit library preparation enzymes [82]. Magnetic bead-based cleanup with a 0.8x ratio effectively removes primers, dimers, and other small contaminants while retaining the desired library fragments.
Long-Read Sequencing
Applications such as whole-genome sequencing on Oxford Nanopore or PacBio platforms benefit tremendously from HMW DNA enrichment. The semi-selective precipitation protocol increases read N50 by 10-25 kb, significantly enhancing assembly continuity [83]. For hybrid assembly approaches combining long-read and short-read data, careful size selection ensures optimal data generation from both platforms.
Microbial Metagenomics
In metagenomic studies, effective polishing reduces the "kitome" contamination—taxa introduced through DNA extraction reagents—which is particularly problematic in low-biomass samples [82]. Additionally, size selection can help enrich for microbial DNA over host DNA in samples derived from host-associated environments, such as the digestive tract of marine invertebrates or human clinical specimens [82].
Decision Framework for Method Selection
The following workflow diagram illustrates the decision process for selecting the appropriate polishing strategy based on sample characteristics and research objectives:
Polishing Method Selection Workflow
Post-extraction polishing through size selection and cleanup represents a critical phase in sample preparation for microbial DNA extraction research. The choice between magnetic bead-based methods, spin columns, and precipitation-based approaches should be guided by throughput requirements, desired fragment size, and sample characteristics. As sequencing technologies continue to advance toward longer reads and single-molecule applications, effective strategies for HMW DNA isolation and purification will become increasingly important. By implementing the optimized protocols and decision frameworks presented in this application note, researchers can significantly enhance the quality of their sequencing data and the reliability of their genomic conclusions.
Evaluating Extraction Performance: Accuracy, Reproducibility, and Clinical Utility
Benchmarking DNA Extraction Methods Using Defined Mock Communities
The reliability of any microbial community analysis, from 16S rRNA amplicon sequencing to shotgun metagenomics, is fundamentally dependent on the initial DNA extraction step. Biases introduced during extraction can distort the apparent microbial composition, leading to incorrect biological conclusions. The use of defined mock communities, which are artificial mixtures of microorganisms with known compositions, provides a powerful empirical approach to quantify these biases and benchmark the performance of DNA extraction methods. This application note details the experimental framework for conducting such benchmarking studies, providing researchers with protocols to identify the optimal DNA extraction method for their specific sample type and research objectives.
Experimental Design for Benchmarking
The Role of Mock Communities
Mock communities serve as a ground-truth standard against which the performance of DNA extraction protocols can be measured. They are typically constructed from well-characterized bacterial strains, either purchased as commercial standards (e.g., ZymoBIOMICS Microbial Community Standard) or created in-house from isolates relevant to the habitat of interest [84] [85]. The design of a mock community should reflect the challenges inherent in the target samples. Key considerations include:
- Varying Species Abundances: Including both dominant and low-abundance members to test sensitivity and dynamic range [84].
- Intra-genus Differentiation: Including multiple species from the same genus (e.g., Escherichia coli and Salmonella enterica) to assess taxonomic resolution [84] [86].
- Presence of Novel Species: Including strains with less than 98.7% 16S rRNA gene sequence identity to known type strains to evaluate the handling of genetically diverse community members [84].
- Gram-Strain Diversity: Ensuring a mix of both Gram-positive and Gram-negative bacteria, as their different cell wall structures can lead to significant extraction bias [85].
Systematic Workflow for Benchmarking
A robust benchmarking study involves the systematic processing of mock communities through different preparation stages to isolate the bias contributed by each step. The following workflow diagram illustrates the key stages of a comprehensive benchmarking experiment.
This workflow allows researchers to deconvolute the sources of bias. Sequencing mixed PCR products reveals the bias from the sequencing process itself, while sequencing mixed extracted DNA isolates the bias from the PCR amplification step. Comparing results from mixed whole cells processed with different DNA extraction kits reveals the combined impact of cell lysis and DNA purification [84].
Key Performance Metrics and Quantitative Data
The following tables summarize the quantitative metrics and comparative data essential for evaluating DNA extraction performance in a benchmarking study.
Table 1: Key Performance Metrics for Benchmarking DNA Extraction Kits
| Metric | Description | Interpretation |
|---|---|---|
| Measurement Integrity Quotient (MIQ) Score | A composite score calculating the deviation of observed abundances from expected theoretical composition [86]. | A higher score (closer to 100) indicates lower overall bias and better performance. |
| Taxon Accuracy Rate (TAR) | The proportion of expected species that are correctly identified at the species level [86]. | Measures the kit's ability to detect all present taxa. |
| Taxon Detection Rate (TDR) | The proportion of expected genera that are correctly identified at the genus level [86]. | Measures reliable genus-level classification. |
| DNA Yield | Quantity of DNA obtained, measured by fluorometry (e.g., Qubit) [85]. | Low yield may indicate poor lysis efficiency. |
| Purity (A260/280 & A260/230) | Ratios indicating contamination from proteins or organic compounds, measured by spectrophotometry (e.g., NanoDrop) [86]. | Ideal A260/280 is ~1.8; low A260/230 suggests solvent carryover. |
| Gram Stain Bias | The ratio of observed-to-expected abundance for Gram-positive vs. Gram-negative species [85]. | A ratio of 1 indicates no bias; deviation indicates preferential lysis of one type. |
Table 2: Example Performance Comparison of DNA Extraction Kits from Recent Studies
| Extraction Kit / Method | Lysis Principle | Key Findings (from Mock Communities) | Best For / Notes |
|---|---|---|---|
| QIAamp PowerFecal Pro DNA (Qiagen) | Chemical & Mechanical (Bead Beating) | Identified all 6/6 species in an ESKAPE mock community; effective for Gram-positive species (S. aureus, E. faecium) [85]. | Complex samples (stool, soil); recommended for unbiased lysis. |
| FastSpin Soil Kit | Mechanical (Bead Beating) | Achieved the highest average MIQ score (82.6) in a water microbiome study [86]. | Environmental samples; high integrity results. |
| EurX Kit | Not Specified | Yielded high DNA purity and overall good MIQ scores, comparable to in-house methods [86]. | General use; good balance of purity and performance. |
| In-House Protocol | Varies (often bead beating) | Yielded the highest amount of DNA and was the second-best performer in MIQ scoring [86]. | Custom applications; can be cost-effective for high-throughput. |
| ZymoBIOMICs Kit | Mechanical (Bead Beating) | Showed lower MIQ scores in a water microbiome study, indicating higher bias [86]. | Commercial standard; performance may vary by sample type. |
| Enzymatic Lysis-only Kits | Enzymatic (e.g., Lysozyme, Proteinase K) | Retrieved fewer aligned bases for Gram-positive species compared to mechanical lysis methods [85]. | Pure cultures or easy-to-lyse cells; not ideal for complex communities. |
Detailed Experimental Protocol
Preparation of an In-House Mock Community
- Strain Selection and Cultivation: Select bacterial isolates representative of your target habitat (e.g., raw meat, milking machine biofilms, or human gut models) [84]. Culture each strain individually in an appropriate broth (e.g., Tryptic Soy Broth) at its optimal temperature until it reaches the late exponential growth phase.
- Cell Concentration Standardization: Measure the optical density at 600 nm (OD600) for each culture and adjust to a standard value (e.g., OD600 = 0.1). Verify the cell concentration for each strain by performing serial dilution and plating on solid agar media to determine the colony-forming units per milliliter (CFU/mL) [84].
- Community Mixing: Combine equal volumes of each OD-adjusted culture to create a community with even abundances. Alternatively, create staggered mixtures with defined ratios to test dynamic range. For controlled experiments, also prepare mixes from extracted genomic DNA or amplified 16S rRNA PCR products from individual strains [84].
DNA Extraction Benchmarking Procedure
- Kit Selection: Choose at least three to four commercial kits and/or in-house protocols that employ different lysis mechanisms (e.g., bead beating, enzymatic, chemical).
- Sample Processing: Aliquot the mock community (as mixed whole cells) and process each aliquot according to the manufacturers' protocols. Include a minimum of three biological replicates per kit.
- DNA Quality and Quantity Assessment:
- Quantification: Use a fluorescence-based method like the Qubit dsDNA HS Assay for accurate DNA concentration measurement.
- Purity Check: Use spectrophotometry (NanoDrop) to determine the A260/280 and A260/230 ratios.
- Integrity Check: For genomic DNA, run an aliquot on an agarose gel to confirm high molecular weight and the absence of excessive degradation.
Downstream Analysis and Validation
- Library Preparation and Sequencing: For 16S rRNA amplicon sequencing, amplify the full-length 16S rRNA gene using primers (e.g., 27F/1492R) and sequence on a long-read platform like PacBio Sequel (for high accuracy CCS reads) or Oxford Nanopore [84]. For shotgun metagenomics, prepare libraries without amplification if possible and sequence using Illumina or Nanopore platforms [85] [87].
- Bioinformatic Processing: Process raw sequencing data through a standardized pipeline (e.g., QIIME 2 for amplicon data). This includes demultiplexing, quality filtering, denoising, and merging reads. For taxonomic assignment, use a curated reference database (e.g., SILVA, Greengenes, GTDB) [84] [86].
- Bias Calculation: Compare the observed taxonomic profile from sequencing to the expected profile based on cell counts or known mixture proportions. Calculate performance metrics like the MIQ score, TAR, and TDR to quantitatively rank the kits [86].
The Scientist's Toolkit: Research Reagent Solutions
Table 3: Essential Materials for Benchmarking DNA Extraction Methods
| Item | Function in Benchmarking | Example Products / Notes |
|---|---|---|
| Defined Mock Community | Serves as a ground-truth standard for quantifying bias. | ZymoBIOMICS Microbial Community Standard; custom in-house mixes from relevant isolates [84] [85]. |
| DNA Extraction Kits | The core reagents being tested; should represent different lysis chemistries. | QIAamp PowerFecal Pro DNA Kit (Qiagen), FastSpin Soil Kit (MP Biomedicals), DNeasy Blood & Tissue Kit (Qiagen) [84] [86] [85]. |
| Bead Beater | Provides mechanical lysis for breaking tough cell walls (e.g., Gram-positive bacteria). | Qiagen TissueLyser II, MP FastPrep-24; critical for unbiased extraction from diverse communities [85]. |
| Fluorometer | Accurately measures double-stranded DNA concentration. | Qubit Fluorometer with dsDNA HS Assay Kit; more accurate for low-concentration samples than spectrophotometry [85]. |
| Spectrophotometer | Provides a rapid assessment of DNA purity and checks for contaminants. | NanoDrop One; used for A260/280 and A260/230 ratios [86]. |
| Long-read Sequencer | Enables full-length 16S rRNA sequencing for superior species-level resolution. | PacBio Sequel IIe (for HiFi reads), Oxford Nanopore GridION; preferred over short-read for mock community analysis [84] [85]. |
| Bioinformatic Tools | For processing sequencing data and calculating bias metrics. | QIIME 2, Kraken2, miqScore16SPublic (for MIQ score), custom scripts [84] [86] [85]. |
Rigorous benchmarking using defined mock communities is an indispensable practice for validating DNA extraction methods in microbiome research. The experimental framework outlined in this application note demonstrates that the choice of extraction kit, particularly its lysis mechanism, is a primary source of bias that can significantly impact the observed microbial composition and diversity. By systematically comparing kits using metrics like the MIQ score and taxon detection rates, researchers can make informed, evidence-based decisions to select the most accurate and reproducible DNA extraction method for their specific scientific questions, thereby ensuring the integrity of their downstream analyses and conclusions.
Bloodstream infections (BSIs) and sepsis represent life-threatening medical emergencies where rapid and accurate pathogen identification is critical for improving patient outcomes [88]. The gold standard for diagnosis, conventional blood culture, often requires 24–72 hours for microbial growth, followed by an additional 24–48 hours to generate single colonies on solid media for definitive identification [89] [90]. This time delay significantly impacts mortality rates, which increase by 6% to 7% per hour in septic patients without appropriate treatment [91]. Molecular diagnostic techniques have emerged as promising alternatives, offering substantially shorter turnaround times [92]. The efficiency of these molecular methods fundamentally depends on the initial sample preparation step—specifically, the extraction of microbial DNA from whole blood. This application note provides a detailed clinical validation of two primary DNA extraction technologies: magnetic bead-based methods and traditional column-based kits, within the critical context of BSI diagnosis.
Comparative Performance Evaluation
A direct comparative study evaluated one column-based DNA extraction method (QIAamp DNA Blood Mini Kit) against two magnetic bead-based methods (the manual K-SL DNA Extraction Kit and the automated GraBon system) for detecting Escherichia coli and Staphylococcus aureus in whole blood samples [92]. The results demonstrate significant differences in performance metrics crucial for clinical diagnostics.
Table 1: Diagnostic Accuracy of DNA Extraction Methods for Bacterial Detection in Whole Blood
| Extraction Method | Technology | E. coli Detection Accuracy (%) | S. aureus Detection Accuracy (%) | Specificity (%) |
|---|---|---|---|---|
| QIAamp DNA Blood Mini Kit | Column-based | 65.0 | 67.5 | 100 |
| K-SL DNA Extraction Kit | Magnetic Bead-based | 77.5 | 67.5 | 100 |
| GraBon System | Magnetic Bead-based (Automated) | 76.5 | 77.5 | 100 |
The superior performance of magnetic bead-based methods, particularly for E. coli detection, is attributed to differences in their fundamental operational principles. The K-SL and GraBon systems employ magnetic beads to isolate bacteria from whole blood prior to lysis, effectively concentrating the pathogens and providing a cleaner sample with reduced PCR inhibitors [92]. In contrast, the column-based method performs bacterial lysis directly within the complex matrix of whole blood, where co-purification of host proteins, enzymes, and other components can reduce sensitivity and accuracy [92].
For Gram-positive S. aureus, which possesses a thicker, more resilient peptidoglycan cell wall, the automated GraBon system demonstrated the highest accuracy. This performance is facilitated by its unique motor-driven rotating plastic tip that provides vigorous vortexing, enabling more effective mechanical disruption of the tough cell wall compared to gentler tube-mixing methods [92]. Furthermore, the GraBon system's ability to process a larger initial sample volume (500 µL) and concentrate the DNA into a smaller elution volume (100 µL) enhances detection sensitivity for low bacterial loads, a common challenge in clinical BSI cases [92].
Advanced Magnetic Bead-Based Enrichment Strategies
Beyond DNA purification, advanced magnetic bead platforms have been engineered for the specific capture and enrichment of intact pathogens from blood samples. This pre-analytical concentration step significantly improves downstream detection sensitivity.
FcMBL Magnetic Bead System
The FcMBL platform utilizes an engineered version of mannose-binding lectin fused to the Fc portion of human IgG1, conjugated to magnetic beads [89] [90]. This recombinant protein exhibits broad-spectrum binding affinity to pathogen-associated molecular patterns (PAMPs) common across Gram-negative bacteria, Gram-positive bacteria, and fungi [90]. In a clinical validation study, the FcMBL method correctly identified 94.1% (64 of 68) of paediatric positive blood cultures, demonstrating high sensitivity for both Gram-negative (94.7%) and Gram-positive bacteria (93.2%) [89]. Notably, it outperformed the commercially available Bruker MBT-Sepsityper kit, particularly for fungal diagnosis, achieving 100% (3/3) sensitivity for clinical candidemia compared to only 33% (1/3) for the Sepsityper [89] [90].
M1 Beads for Fungal Detection
A similar lectin-based enrichment strategy employs recombinant human mannan-binding lectin (rhMBL, or M1 protein) conjugated to beads for capturing Candida species [93]. When combined with a multiplex recombinase-aided PCR (mRAP) assay, this M1-mRAP method achieved an exceptional limit of detection (LOD) of 1-2 colony-forming units (CFU)/mL for C. albicans, C. tropicalis, and C. glabrata in blood, with a total processing time of approximately 3.5 hours [93]. This highlights the power of targeted enrichment for diagnosing low-level fungemias that are often missed by conventional methods.
Experimental Protocols
Protocol: Manual Magnetic Bead-Based DNA Extraction (K-SL Kit)
This protocol is designed for the efficient isolation of bacterial DNA from whole blood prior to lysis [92].
- Bacterial Isolation: Mix 200 µL of whole blood with specific binding buffer. Incubate with magnetic beads designed to bind bacterial cells. Place the tube on a magnetic stand to separate bead-bound bacteria from blood components. Discard the supernatant.
- Cell Lysis: Resuspend the bead-bacteria complex in a gentle lysis buffer via tube mixing. This step breaks open the bacterial cell walls to release genomic DNA.
- DNA Binding and Washing: Add a binding solution to the lysate to promote the association of DNA with the surface of the magnetic beads. Place on a magnetic stand, discard the supernatant, and wash the beads with an ethanol-based wash buffer to remove salts, proteins, and other impurities.
- Elution: Air-dry the beads to remove residual ethanol. Elute the purified DNA in 100 µL of nuclease-free water or TE buffer.
Protocol: Automated Extraction on GraBon System
The automated protocol on the GraBon system uses the same chemistry as the K-SL kit but enhances consistency and throughput [92].
- Loading: Transfer 500 µL of whole blood and the necessary reagents into a designated cartridge or plate.
- Automated Processing: The instrument automatically performs the sequential steps of bacterial capture, lysis, washing, and elution. A key differentiator is the use of a motor-driven rotating plastic tip for vigorous vortexing during the lysis step, ensuring efficient disruption of tough Gram-positive bacterial walls.
- Collection: The system elutes the final purified DNA in 100 µL of elution buffer, concentrating the DNA from the larger input volume.
Protocol: FcMBL-Based Pathogen Enrichment for MALDI-TOF MS
This protocol enables rapid pathogen identification directly from positive blood cultures by coupling enrichment with mass spectrometry [89] [90].
- Capture: Incubate a sample from a positive blood culture bottle with FcMBL-conjugated magnetic beads. The FcMBL protein binds to a wide array of pathogens.
- Washing: Separate the beads using a magnet and wash thoroughly with buffer to remove unbound host proteins and media components that can interfere with downstream analysis.
- Elution and Spotting: Elute the captured pathogens in a small volume. Mix the eluate with an appropriate matrix solution (e.g., α-cyano-4-hydroxycinnamic acid) and spot it onto a MALDI target plate.
- Analysis: Analyze the spotted sample using MALDI-TOF MS. The resulting protein mass fingerprint is compared against a spectral database for pathogen identification.
The Scientist's Toolkit: Essential Research Reagents
Table 2: Key Reagents and Kits for Microbial DNA Extraction and Pathogen Enrichment
| Product Name | Type | Primary Function in Workflow |
|---|---|---|
| QIAamp DNA Blood Mini Kit | Column-based Kit | Silica-membrane-based purification of DNA directly from lysed whole blood [92]. |
| K-SL DNA Extraction Kit | Magnetic Bead-based Kit | Manual pathogen isolation and DNA extraction using bacterial capture prior to lysis [92]. |
| GraBon System & Reagents | Automated Magnetic Bead-based Platform | Automated, high-throughput processing for consistent DNA extraction with enhanced lysis efficiency [92]. |
| FcMBL Magnetic Beads | Functionalized Beads | Broad-spectrum capture and enrichment of intact pathogens (bacteria, fungi) from complex samples [89] [90]. |
| M1 Beads (rhMBL Beads) | Functionalized Beads | Specific enrichment of Candida species from blood samples via lectin binding [93]. |
| HighPrep PCR Beads | Magnetic Beads | Post-PCR cleanup and size selection to remove primers, enzymes, and salts for improved downstream sequencing or detection [34]. |
Workflow Visualization
The following diagram illustrates the key procedural and decision-making pathways for selecting and implementing the optimal sample preparation strategy in BSI research.
Clinical validation data firmly establishes the superiority of magnetic bead-based technologies over traditional column-based kits for the detection of bloodstream infections. The key advantages of magnetic beads—including pre-lysis pathogen concentration, more effective handling of PCR inhibitors, and superior automation compatibility—translate into higher diagnostic accuracy, especially for challenging Gram-positive bacteria and fungi. The emergence of functionalized beads, such as FcMBL and M1 lectin beads, further extends the utility of this platform by enabling sensitive pathogen enrichment for culture-independent diagnostics. For researchers and clinicians seeking to optimize microbial DNA extraction for BSI diagnosis, magnetic bead-based protocols represent the modern standard, offering a clear path to faster, more reliable results that can directly inform timely therapeutic interventions and improve patient outcomes.
{c:abstract}This application note systematically evaluates two major sources of bias in microbial genomics—GC content and DNA fragmentation methods—and their impact on the accuracy of downstream quantitative analyses. We provide a detailed experimental protocol for bias assessment, along with standardized data correction strategies, to support robust and reproducible research in drug development and microbial characterization.{c:}
{c:section|Introduction} Accurate genomic quantification is foundational for applications ranging from microbial identification in biopharmaceutical processes to antimicrobial resistance profiling. However, technical artifacts introduced during sample preparation can significantly confound biological signals. Two of the most pervasive sources of such bias are the genomic GC content and the method used to fragment DNA prior to sequencing. GC bias, the dependence between read coverage and GC content, can dominate the signal of interest in analyses like copy number estimation [94]. Concurrently, the choice of fragmentation method (e.g., sonication, enzymatic, or nebulization) can introduce variability in library preparation efficiency and subsequent sequencing coverage [95] [96]. This document outlines a standardized framework to assess and correct for these biases, ensuring data integrity within microbial DNA extraction research.
{c:section|The Impact of GC Content on Quantification} GC bias manifests as an uneven read coverage across genomic regions with varying GC composition. In Illumina sequencing, this often presents as a unimodal relationship where both GC-rich and AT-rich fragments are underrepresented in the sequencing results [94] [97]. This bias primarily arises during the PCR amplification stages of library preparation [94] [97].
{c:sub-section|Mechanism and Impact} The bias is not consistent between samples or even between libraries within the same experiment, making it a critical variable to control [94]. In de novo genome assembly, GC bias can lead to reduced assembly completeness and accuracy, particularly when the bias is strong enough to create regions with exceptionally low or high coverage [97]. The effect is observed across all scales, from small bins to large (100 kb) genomic windows [94].
{c:sub-section|Quantifying GC Bias} A standard method for quantification involves calculating the relationship between GC content and normalized read coverage [97]. The workflow for this analysis is outlined in {c:diagram}Diagram 1{c:}.
{c:diagram-title}GC Bias Quantification Workflow{c:}
{c:section|Comparative Analysis of DNA Fragmentation Methods} The method used to fragment genomic DNA is a critical parameter in library preparation, influencing library complexity, insert size distribution, and the potential for introducing sequence errors. The following table summarizes the performance of common fragmentation methods based on published comparative studies.
{c:table|Fragmentation Method Performance Comparison}
| Method | Principle | Typical Fragment Size | Pros | Cons |
|---|---|---|---|---|
| Sonication (AFA) [95] [98] | Physical shearing via ultrasonic waves. | Tunable (100 bp - 3 kb) [98] | High performance in overall sequence quality; low InDel error rate after filtering [95]. | Requires specialized, expensive equipment (e.g., Covaris) [98]. |
| Nebulization [95] | Forces DNA through a small hole with compressed gas. | Heterogeneous mix | Good performance comparable to sonication [95]. | Risk of aerosol contamination; difficult to multiplex [98]. |
| Enzymatic (Fragmentase) [95] [96] | Random nicking and cutting by a two-enzyme mix. | 100 - 800 bp [95] | Simple, no special equipment; high labelling efficiency for biochips [96]. | Higher raw InDel errors; requires post-repair [95]. |
| Microwave Irradiation [98] | Unconventional electromagnetic energy-based shearing. | Suitable for NGS libraries | Potential for easy multiplexing; uniform fragmentation. | Causes severe DNA damage, requires complex post-processing [98]. |
{c:section|Integrated Experimental Protocol for Bias Assessment} This protocol provides a methodology to systematically evaluate the combined impact of DNA fragmentation methods and GC content on quantification bias in a single experiment.
{c:sub-section|Materials and Reagents} The "Research Reagent Solutions" listed below are essential for executing the featured experiment.
{c:table|Research Reagent Solutions}
| Item | Function | Example Vendor/Catalog |
|---|---|---|
| NEBNext dsDNA Fragmentase | Enzymatic fragmentation via random nicking and cutting. | New England Biolabs |
| Covaris AFA System | Instrument for reproducible acoustic shearing. | Covaris |
| MagMAX DNA Multi-Sample Kit | For consistent post-fragmentation DNA purification. | Thermo Fisher Scientific |
| Qubit dsDNA HS Assay | Accurate quantification of low-yield fragmented DNA. | Thermo Fisher Scientific |
| Agilent High-Sensitivity DNA Kit | Precise analysis of fragment size distribution. | Agilent Technologies |
{c:sub-section|Procedure}
- Sample Preparation and Fragmentation Arm
- Starting Material: Use 1 µg of high-quality, high-molecular-weight genomic DNA from your target microbial isolate (e.g., E. coli).
- Fragmentation: Aliquot the DNA and process it in parallel using at least two different methods:
- Acoustic Shearing: Using a Covaris S2 system, target a peak fragment size of 500 bp with the following parameters: Peak Incident Power: 175 W, Duty Factor: 10%, Cycles per Burst: 200, Treatment Time: 60 seconds [98].
- Enzymatic Fragmentation: Use NEBNext dsDNA Fragmentase according to manufacturer instructions. Incubate 1 µg of DNA for 30 minutes at 37°C, then heat-inactivate at 65°C for 30 minutes [95].
- Purification: Clean up all fragmented DNA samples using a magnetic bead-based kit like MagMAX DNA Multi-Sample Kit.
Library Preparation and Sequencing
- Quantify and check the size distribution of the purified fragments using a Qubit fluorometer and Agilent Bioanalyzer.
- Prepare sequencing libraries from each fragmented sample using an identical, standardized kit and protocol (e.g., NEBNext Ultra II DNA Library Prep Kit).
- Pool libraries in equimolar ratios and sequence on an Illumina platform to achieve a minimum coverage of 50x.
Data Analysis for Bias Quantification
- GC Bias Workflow: Follow the workflow in {c:diagram}Diagram 1{c:} for each sample. Map reads to a reference genome, calculate coverage in sliding windows (e.g., size = mean fragment length), and plot normalized coverage against GC content. The slope of a linear fit quantifies the GC bias [97].
- Fragmentation Method Analysis: Compare data quality metrics across methods, including:
- Coverage Uniformity: Assess the evenness of coverage across the genome.
- Error Profiles: Calculate rates of substitutions, insertions, and deletions relative to the reference genome [95].
- Library Complexity: Estimate the number of unique DNA molecules sequenced.
{c:section|Bias Correction and Data Normalization} Once quantified, biases can be mitigated computationally. For GC bias, a common approach is to model the observed relationship between GC content and read count, then use this model to normalize the coverage data [94]. This can be done using LOESS regression or by assuming a unimodal curve family for the relationship. The following diagram illustrates the logical decision process for addressing identified biases.
{c:diagram-title}Bias Identification and Correction Pathway{c:}
{c:section|Conclusion} GC content and DNA fragmentation methods are significant, interacting variables that can introduce substantial quantification bias in microbial genomics. The experimental protocol and analysis frameworks provided here empower researchers to systematically evaluate these biases in their specific sample preparation workflows. For robust results in downstream applications such as variant calling, genome assembly, and metagenomic profiling, we recommend the adoption of such bias assessment as a standard quality control step. Proactively identifying and correcting for these technical confounders is essential for generating the high-quality, reliable data required for critical drug development and diagnostic decisions.
Establishing Performance Metrics and Quality Control Thresholds for Reproducibility
Reproducibility is a cornerstone of credible scientific research, particularly in microbial genomics where DNA extraction serves as the critical first step in analytical workflows. In the context of a broader thesis on sample preparation for microbial DNA extraction, establishing robust performance metrics and quality control (QC) thresholds becomes paramount for generating reliable, comparable data. The extraction of microbial DNA from complex samples presents substantial challenges, with DNA extraction protocols identified as a major contributor to experimental variability [99]. Without standardized quality measures, results across studies become incomparable, potentially leading to errant conclusions.
This protocol provides a comprehensive framework for establishing performance metrics and QC thresholds specifically tailored for microbial DNA extraction workflows. We detail standardized methodologies for quantifying extraction efficiency, assessing DNA quality, and implementing control samples to ensure both intra- and inter-laboratory reproducibility. By implementing these rigorous quality measures, researchers can significantly enhance the reliability of downstream applications including 16S rRNA gene sequencing, whole-genome shotgun metagenomics, and pathogen detection.
Critical Performance Metrics for DNA Extraction
Quantitative Metrics for Assessment
Several key metrics must be quantified to evaluate the performance and efficiency of DNA extraction protocols. These parameters provide objective measures for comparing different extraction methods and establishing laboratory-specific benchmarks.
Table 1: Core Performance Metrics for DNA Extraction Protocols
| Metric | Target Value | Measurement Technique | Significance |
|---|---|---|---|
| DNA Recovery Efficiency | >90% (optimized protocols) | Quantitative-competitive PCR with external DNA recovery standard [100] | Directly measures protocol effectiveness; commercial kits often show 2.4-28.3% efficiency without optimization [100] |
| Host DNA Depletion | >90% reduction in host DNA | qPCR quantification of host vs. microbial genes [101] | Critical for samples with high host DNA content (e.g., milk, tissue); improves microbial sequencing depth |
| Inhibitor Presence | Absence of PCR inhibition | qPCR amplification efficiency | Ensures DNA is suitable for downstream applications |
| DNA Integrity | Clear high-molecular-weight bands | Electrophoresis (TapeStation, agarose gels) [101] | Indicates minimal fragmentation; essential for long-read sequencing |
| Yield Consistency | CV <15% across replicates | Nanodrop/Qubit with statistical analysis | Measures protocol robustness and technical variability |
Establishing QC Thresholds
Quality control thresholds should be established based on both technical capabilities and downstream application requirements. For microbial genomics studies, the following thresholds are recommended:
- Minimum DNA Recovery Efficiency: 70% for high-biomass samples (feces), 50% for low-biomass samples (tissue, fluid) when using an external DNA recovery standard [100]. Optimal protocols can achieve approximately 95% recovery with carrier RNA and successive elutions [102].
- Maximum Host DNA Contamination: <80% host DNA in the final extract for metagenomic studies [101]. Specific kits like HostZero demonstrate superior host depletion capabilities [101].
- Minimum DNA Concentration: >0.5 ng/μL for low-biomass samples to ensure sufficient material for library preparation.
- Acceptable Integrity: DNA Integrity Number (DIN) >7 for short-read sequencing, clear high-molecular-weight bands for long-read sequencing.
Experimental Protocols for Metric Validation
Protocol 1: Determining DNA Extraction Efficiency
Principle: This method utilizes an external DNA recovery standard (Lambda DNA contained within pBR322) added to samples prior to extraction, with quantification via quantitative-competitive PCR (QC-PCR) to precisely calculate recovery percentages [100].
Reagents Required:
- External DNA recovery standard (Lambda DNA in pBR322)
- Quantitative-competitive PCR reagents
- DNA extraction kits/test protocols for evaluation
- Sample matrix matching experimental conditions
Procedure:
- Standard Preparation: Prepare a dilution series of the external DNA recovery standard in the same matrix as experimental samples (e.g., sediment, milk, tissue homogenate).
- Sample Spiking: Add a known quantity (e.g., 1×10^3-10^5 copies) of the recovery standard to experimental samples prior to DNA extraction.
- DNA Extraction: Perform extraction using the protocol(s) under evaluation.
- QC-PCR Analysis: Quantify the recovered standard using quantitative-competitive PCR with primers specific to the target sequence.
- Efficiency Calculation: Calculate percentage recovery as (Quantity recovered/Quantity added) × 100.
Calculation:
Validation: This approach has proven robust even in challenging matrices such as sediments heavily polluted with polycyclic aromatic hydrocarbons, detecting the recovery standard from as few as 1×10^3 cells added to 0.5 g sediment [100].
Protocol 2: Assessing Host DNA Depletion Efficiency
Principle: This protocol uses qPCR with species-specific primers to quantify the relative abundance of host versus microbial DNA in extracts, critical for optimizing host depletion methods in host-associated microbiome studies.
Reagents Required:
- Species-specific host gene primers (e.g., mammalian GAPDH, β-actin)
- Universal microbial 16S rRNA gene primers
- qPCR master mix
- DNA standards for absolute quantification
Procedure:
- DNA Extraction: Perform extraction with and without host depletion methods.
- qPCR Setup: Perform separate qPCR reactions with:
- Host-specific primers
- Microbial universal primers (16S rRNA gene)
- Standard Curves: Generate standard curves for absolute quantification using serial dilutions of known DNA quantities.
- Calculation: Calculate host DNA percentage and depletion efficiency.
Calculation:
Application: This method validated the HostZero kit as consistently producing higher DNA yields with more effective host DNA depletion compared to other commercial kits [101].
Protocol 3: Comprehensive Quality Control Framework
Principle: Implementing a systematic QC approach using positive and negative controls throughout the extraction process to monitor technical variability and identify contamination.
Reagents Required:
- Positive control: Mock microbial communities or defined chemostat cultures
- Negative control: Extraction blanks (no sample)
- Environmental contamination controls: Swabs of collection tubes, gloves, workspace
Procedure:
- Control Inclusion:
- Include a positive control in each extraction batch (mock community or chemostat sample)
- Include extraction blanks with each batch to identify reagent contamination
- Collect environmental controls during sample collection
- DNA Extraction: Perform extractions following standardized protocols
- Analysis:
- Sequence positive controls and calculate coefficients of variation (CV) for community composition
- Sequence negative controls to identify contaminating taxa
- Report intraclass correlation coefficients for positive controls
Interpretation: CV <15% for positive controls indicates acceptable technical variability. Contamination in blanks should be documented and subtracted from experimental samples when significant [99].
Workflow Integration and Visualization
The following workflow integrates all quality control measures into a comprehensive framework for ensuring reproducible DNA extraction:
Figure 1: Comprehensive quality control workflow for reproducible DNA extraction. The diagram illustrates the integration of controls and metrics at each stage, with clear pass/fail decision points.
The Scientist's Toolkit: Essential Research Reagents
Table 2: Essential Research Reagents for Quality-Controlled DNA Extraction
| Reagent/Category | Specific Examples | Function & Importance |
|---|---|---|
| DNA Recovery Standards | Lambda DNA in pBR322 vector [100] | External standard for quantifying extraction efficiency; enables cross-protocol comparisons |
| Host Depletion Kits | HostZero, Molysis Complete5, SPINeasy Host depletion [101] | Selectively remove host DNA to improve microbial sequencing depth; critical for host-associated samples |
| Positive Control Materials | Mock microbial communities, Chemostat cultures, Complex environmental samples [99] | Evaluate extraction reproducibility and batch-to-batch variability |
| Mechanical Lysis Tools | Bead beaters, Sonicators | Ensure efficient lysis of diverse microbial cell types; critical for Gram-positive bacteria |
| Inhibitor Removal Resins | Silica-based columns, Chelating resins | Remove PCR inhibitors (humic acids, polyphenols) that affect downstream applications |
| Nucleic Acid Quantification | Qubit fluorometer, TapeStation, qPCR | Accurate quantification and quality assessment beyond spectral absorbance |
Implementation and Reporting Standards
Successful implementation of these performance metrics requires consistent application and thorough documentation. We recommend the following reporting standards for all studies involving microbial DNA extraction:
- Detailed Methodology: Document all DNA extraction procedures with sufficient detail to enable exact replication, including equipment models, reagent lot numbers, and deviation tracking [99].
- Control Reporting: Report results from all positive and negative controls, including coefficients of variation for positive controls and contamination profiles for blanks [99].
- Efficiency Metrics: Include DNA recovery efficiency calculations for each sample type using standardized approaches [100].
- Threshold Justification: Provide rationale for established QC thresholds based on experimental needs and sample limitations.
For multi-site studies, utilizing the same DNA extraction protocol across all sites is essential for generating comparable data [99]. Protocol standardization should be prioritized over individual laboratory preferences when pooling data for integrated analysis.
Establishing performance metrics and quality control thresholds is not merely a procedural formality but a fundamental requirement for generating reproducible, reliable microbial genomics data. The protocols and metrics detailed herein provide a robust framework for validating DNA extraction methods, monitoring technical variability, and ensuring comparability across experiments and laboratories. By implementing these standardized approaches and maintaining rigorous quality control practices, researchers can significantly enhance the credibility and translational potential of their microbial DNA extraction research, contributing to more reproducible science across the field of microbial genomics.
In human microbiome research, technical variation introduced during sample processing poses a significant challenge to data comparability and reproducibility across different studies and laboratories. Among all laboratory processing steps, DNA extraction methodologies have been consistently identified as the largest source of experimental variability, potentially hindering scientific progress and the development of reliable diagnostic and therapeutic products [99]. This variability stems from multiple factors, including differences in cell lysis efficiency (particularly for Gram-positive bacteria with tough cell walls), reagent contamination, and variations between laboratory personnel or equipment [103] [99].
Interlaboratory comparison studies serve as essential tools for quantifying and mitigating these technical variations. These systematic assessments evaluate the performance of analytical methods across multiple laboratories to establish consensus protocols and quality standards [104] [105]. For the microbiome industry, such standardization efforts are crucial for supporting product development, enabling multi-center clinical trials, and facilitating meta-analyses of combined datasets [103]. This application note outlines validated protocols, performance metrics, and implementation guidelines to support transferability and standardization of microbial DNA extraction methods based on recent interlaboratory studies.
Comparative Performance of DNA Extraction Methods
Quantitative Assessment of Extraction Kits
Systematic evaluation of DNA extraction methods using defined mock communities has revealed significant differences in performance characteristics. The table below summarizes key findings from recent interlaboratory comparisons assessing various extraction kits:
Table 1: Performance Comparison of Selected DNA Extraction Methods from Interlaboratory Studies
| Extraction Method | DNA Yield | Gram-positive Efficiency | Trueness (gmAFD) | Precision (qmCV) | Interlaboratory Reproducibility |
|---|---|---|---|---|---|
| QIAamp PowerFecal Pro (PF) | High | Excellent | 1.06-1.15× | 0.9-2.1% | High |
| DNeasy PowerSoil HTP (PS) | High | Excellent | 1.07-1.18× | 1.0-2.3% | High |
| Magnetic Soil & Stool (MS) | Moderate | Good | 1.18-1.32× | 1.8-3.2% | Moderate |
| QIAamp Fast DNA Stool (FS) | Moderate | Moderate | 1.22-1.41× | 2.1-4.1% | Moderate to Low |
Performance metrics explained: gmAFD (geometric mean of absolute fold-differences) measures trueness relative to ground truth (lower is better); qmCV (quadratic mean of coefficients of variation) measures precision (lower is better) [103] [106].
Methods utilizing mechanical lysis with small beads (such as PF and PS) demonstrate superior performance in extracting DNA from Gram-positive bacteria, resulting in more accurate representation of microbial community structure [106]. These methods also show higher consistency across technical replicates and between different laboratories, making them particularly suitable for large-scale multi-center studies where comparability is essential.
Impact of Method Selection on Microbial Community Profiles
The choice of DNA extraction method significantly influences observed microbial community composition, potentially leading to erroneous biological interpretations. Studies demonstrate that the extraction method alone can account for approximately 21.4% of the overall observed microbiome variation in fecal samples, affecting the detected abundances of up to 32% of microbial species [106]. This methodological bias is particularly pronounced for taxa with challenging cell wall structures, such as Gram-positive bacteria including Firmicutes and Actinobacteria [103] [107].
The consistency of community profiles is also affected by the DNA extraction workflow. Automated systems generally show improved reproducibility compared to manual protocols, primarily through reduced operator-induced variability [108]. Furthermore, methods that achieve more complete lysis of diverse bacterial populations yield higher estimates of microbial diversity, which may more accurately reflect the true complexity of the sample [107].
Validated Protocols for Standardized DNA Extraction
Recommended Protocol for Fecal Samples
Based on interlaboratory validation studies, the following protocol is recommended for standardized processing of human fecal samples:
Table 2: Essential Research Reagent Solutions for Standardized DNA Extraction
| Reagent/Kit | Function | Application Note |
|---|---|---|
| QIAamp PowerFecal Pro Kit | Simultaneous lysis and inhibition removal | Optimal for manual processing |
| DNeasy PowerSoil HTP Kit | High-throughput soil/stool DNA isolation | Suitable for 96-well automation |
| Microbial Mock Community | Extraction process control | Verifies lysis efficiency and quantification accuracy |
| Adenine Quantification Standard | Cellular biomass quantification | Alternative to fluorometric DNA quantification |
| Inhibitor Removal Technology | Binds PCR inhibitors | Critical for complex sample matrices |
Procedure:
- Sample Aliquoting: Dispense 180-220 mg of homogenized fecal material into a sterile tube
- Mechanical Lysis: Add recommended buffers and disrupt using bead-beating with 0.1 mm glass beads for 10 minutes at maximum speed
- Inhibitor Removal: Transfer supernatant to inhibitor removal matrix and centrifuge at 13,000 × g for 1 minute
- DNA Binding: Combine flow-through with binding buffer and transfer to spin column
- Washing: Perform two wash steps with appropriate wash buffers
- Elution: Elute DNA in 50-100 μL elution buffer pre-warmed to 55°C
- Quality Assessment: Quantify DNA yield by fluorometry and assess purity via A260/A280 ratio (target: 1.8-2.0) [103] [106] [107]
This protocol has demonstrated excellent interlaboratory transferability across nine industry-based laboratories, with minimal variability in measured taxonomic profiles (qmCV < 2.5% for most abundant taxa) [103].
Protocol for Low-Biomass and Tissue Samples
Samples with low microbial biomass (e.g., tissue biopsies, body fluids) present additional challenges due to increased susceptibility to contamination and high host DNA content. A modified protocol based on the Ultra-Deep Microbiome Prep kit has been validated for such samples:
Procedure:
- Extended Proteinase K Digestion: Incubate tissue sample (approximately 10 mg) with proteinase K for 20 minutes at 56°C
- Host Cell Lysis: Add selective lysis buffer to disrupt human cells and degrade extracellular human DNA
- Microbial Enrichment: Pellet intact microbial cells by centrifugation at 14,000 × g for 10 minutes
- Repeat Lysis Step: Resuspend pellet in transport medium and repeat the host cell lysis step
- Microbial DNA Release: Apply mechanical and enzymatic lysis to released microbial cells
- DNA Purification: Isolve DNA using silica membrane technology
- Host DNA Depletion Assessment: Verify reduction of human DNA content by qPCR targeting human β-globin gene [109]
This optimized approach achieves an additional 10-fold reduction in human DNA while preserving microbial DNA, significantly improving the detection sensitivity for pathogens in low-biomass samples [109].
Experimental Design for Method Validation
Essential Control Materials
Robust validation of DNA extraction methods requires incorporation of appropriate control materials to assess accuracy, precision, and potential contamination:
Table 3: Control Materials for DNA Extraction Validation
| Control Type | Purpose | Implementation |
|---|---|---|
| Artificial Mock Community | Trueness assessment | Defined mixture of known microbial strains |
| Complex Reference Material | Precision monitoring | Aliquots of well-characterized natural sample |
| Extraction Blanks | Contamination monitoring | Processing without sample material |
| Environmental Controls | Background assessment | Swabs of collection tubes, workspace, etc. |
Artificial mock communities should include bacteria with varying genomic GC content (31.5-69.0%) and cell wall structures (Gram-positive and Gram-negative) to adequately challenge the extraction method [103]. For complex reference materials, large batches should be prepared and aliquoted for long-term use to enable longitudinal performance monitoring.
Performance Metrics and Target Values
Interlaboratory studies employ specific quantitative metrics to evaluate method performance:
- Trueness: Geometric mean of absolute fold-differences (gmAFD) between measured and expected abundances in mock communities
- Precision: Quadratic mean of coefficients of variation (qmCV) across technical replicates
- GC Bias: Slope of regression between log-ratio of strain abundances and their GC content differences
- Inhibition: PCR amplification efficiency with and without sample DNA
Based on collaborative trials, the following performance targets should be achieved for validated methods: gmAFD < 1.25×, qmCV < 5% for abundant taxa, and GC bias slope magnitude < 0.015 per 1% GC difference [103].
Implementation Framework
Quality Management System
Successful implementation of standardized methods requires integration into a comprehensive quality framework:
- Documentation: Maintain detailed standard operating procedures (SOPs) with sufficient detail to enable precise protocol replication
- Training: Ensure consistent implementation across operators through hands-on training and demonstration videos
- Process Monitoring: Regularly analyze control materials and track performance metrics over time
- Contamination Management: Systematically include and document extraction blanks and environmental controls
Interlaboratory comparisons have demonstrated that even with standardized protocols, approximately 12-18% of variability can persist due to differences in reagent lots, equipment, and operator technique, highlighting the need for ongoing quality assessment [110].
Minimum Reporting Standards
To enhance reproducibility and enable meaningful comparison between studies, the following information should be documented for all DNA extraction procedures:
- Complete kit details including manufacturer, catalog number, and lot numbers
- Any modifications to the manufacturer's protocol
- Sample mass or volume processed
- Elution volume and buffer composition
- Details of any homogenization or pre-processing steps
- Equipment used for mechanical lysis (instrument type, duration, intensity)
- Quantification method and quality metrics
- Results from positive and negative controls [99]
Adherence to these reporting standards enables critical evaluation of methodological quality and facilitates appropriate interpretation of results in the context of technical limitations.
Visual Workflow of Interlaboratory Validation
The following diagram illustrates the comprehensive workflow for validating DNA extraction methods through interlaboratory comparison:
Figure 1: Workflow for interlaboratory validation of DNA extraction methods, showing key stages from initial planning to establishment of standardized protocols.
Standardization of DNA extraction methods through systematic interlaboratory studies is fundamental to advancing microbiome research and its applications in therapeutic development. The protocols and framework presented here provide a validated foundation for achieving consistent, reproducible, and comparable results across different laboratories and studies. Implementation of these standardized approaches, coupled with rigorous quality control and comprehensive reporting, will enhance data reliability and facilitate meaningful meta-analyses, ultimately accelerating the translation of microbiome research into clinical applications.
Adherence to these best practices is particularly crucial for industry-based applications such as diagnostic development, clinical trials, and product manufacturing, where methodological consistency directly impacts regulatory evaluation and product viability [103]. As the field continues to evolve, ongoing interlaboratory comparisons will be essential for validating new technologies and maintaining quality standards across the microbiome research community.
Conclusion
Successful microbial DNA extraction is a multifaceted process where the choice of sample preparation method directly dictates the accuracy and reliability of all downstream data. This synthesis of knowledge confirms that magnetic bead-based methods, particularly automated systems, often provide superior yield and purity for complex clinical samples like blood, while method customization for specific sample types—such as the Water Dilution Protocol for urine—is essential for unlocking true microbial diversity. Rigorous validation using standardized metrics and mock communities is non-negotiable for clinical translation and cross-study comparisons. Future directions will focus on the full automation of integrated workflows, from sample to sequencer, and the development of universal methods that can efficiently handle the extreme diversity of microbial life for accelerated biomarker discovery and diagnostic development.
References
- 1. Preparation: How to Get High- Sequencing /RNA Sample Quality DNA [https://www.cd-genomics.com/resource-sample-preparation-for-sequencing.html]
- 2. Nanopore-only Microbial Isolate Sequencing Solution... [https://nanoporetech.com/document/no-miss-isolate-sequencing-rapid-barcoding-v14]
- 3. Input DNA /RNA QC | Oxford Nanopore Technologies [https://nanoporetech.com/document/input-dna-rna-qc]
- 4. How-to: NGS Quality | Front Line Genomics Control [https://frontlinegenomics.com/how-to-ngs-quality-control/]
- 5. tips and best practices for HiFi DNA - PacBio extraction sequencing [https://www.pacb.com/blog/dna-extraction-tips-and-best-practices-for-hifi-sequencing/]
- 6. Why Quality ( Control ) is Crucial for Accurate NGS Testing QC [https://3billion.io/blog/why-quality-control-qc-is-performed-for-ngs-testing]
- 7. Guide: Mastering 7 Essential DNA Types Extraction Sample [https://www.thermofisher.com/blog/life-in-the-lab/dna-extraction-guide-mastering-7-essential-sample-types/]
- 8. 【指南与共识】高通量宏基因组测序技术检测病原微生物的临床应用规范化专家共识-海南省生物材料与医疗器械工程研究中心 [https://www.muhn.edu.cn/ecmd/info/1471/10704.htm]
- 9. DNA extract characterization process for microbial detection methods development and validation - PMC [https://pmc.ncbi.nlm.nih.gov/articles/PMC3599793/]
- 10. Evaluation of Methods for the Extraction and Purification of DNA from the Human Microbiome | PLOS One [https://journals.plos.org/plosone/article?id=10.1371/journal.pone.0033865]
- 11. Accumulated lipids rather than the rigid impede the... cell walls [https://microbialcellfactories.biomedcentral.com/articles/10.1186/1475-2859-12-106]
- 12. DNA extraction and quantitation of forensic samples using the phenol-chloroform method and real-time PCR - PubMed [https://pubmed.ncbi.nlm.nih.gov/15570097/]
- 13. Comparison of DNA Extraction Methods for the Direct Quantification of Bacteria from Water Using Quantitative Real-Time PCR [https://www.mdpi.com/2073-4441/14/22/3736]
- 14. Frontiers | Evaluation of Methods for the Extraction of Microbial DNA From Vaginal Swabs Used for Microbiome Studies [https://www.frontiersin.org/journals/cellular-and-infection-microbiology/articles/10.3389/fcimb.2019.00197/full]
- 15. Fast and Sustainable Thermo-osmotic DNA Extraction Protocol for Trans-spectrum Contingency and Field Use - PMC [https://pmc.ncbi.nlm.nih.gov/articles/PMC10501911/]
- 16. DNA Source Selection for Downstream Applications Based on DNA Quality Indicators Analysis - PMC [https://pmc.ncbi.nlm.nih.gov/articles/PMC4991598/]
- 17. using... | Research Square Microbial DNA quantification [https://www.researchsquare.com/article/rs-6299186/v1]
- 18. C-SOP-202: Genomic DNA Purity Measurement using a Nanodrop Spectrophotometer [https://www.protocols.io/view/c-sop-202-genomic-dna-purity-measurement-using-a-n-hdpkb25kx.html]
- 19. Purity Ratios | Nucleic Acid Ratios | Technical Note 130 [https://www.denovix.com/tn-130-purity-ratios-explained/]
- 20. Developing whole cell standards for the microbiome field | Microbiome [https://microbiomejournal.biomedcentral.com/articles/10.1186/s40168-022-01313-z]
- 21. Genomic DNA Quality Control, TapeStation | Agilent [https://www.agilent.com/en/product/automated-electrophoresis/tapestation-systems/tapestation-dna-screentape-reagents/genomic-dna-screentape-analysis-228261]
- 22. DNA / RNA Extraction Kits | Complete Genomics [https://www.completegenomics.com/products/kits-reagents/dna-rna-extraction-kits/]
- 23. A non-destructive, fast, inexpensive, non-toxic chelating resin-based... [https://pmc.ncbi.nlm.nih.gov/articles/PMC12132034/]
- 24. , Purification, and Quantitation | SpringerLink Microbial DNA Extraction [https://link.springer.com/protocol/10.1007/978-3-642-34410-7_1]
- 25. Frontiers | A Comparison of Methods for the Extraction of Plasmids... [https://www.frontiersin.org/journals/microbiology/articles/10.3389/fmicb.2018.01731/full]
- 26. of ten different Comparison procedures with respect... DNA extraction [https://pubmed.ncbi.nlm.nih.gov/29056447/]
- 27. of high-quality genomic Extraction from different plant orders... DNA [https://bnrc.springeropen.com/articles/10.1186/s42269-019-0066-1]
- 28. Design, Development, and Clinical Validation of a Novel Kit for Cell-Free DNA Extraction [https://www.mdpi.com/2075-4418/15/15/1897]
- 29. Revolutionary DNA Analysis Method Set to Transform Insights into Disease [https://bioengineer.org/revolutionary-dna-analysis-method-set-to-transform-insights-into-disease-evolution/]
- 30. The current status and trends of DNA extraction - PubMed [https://pubmed.ncbi.nlm.nih.gov/37338306/]
- 31. A rapid and high-yield method for nucleic acid extraction | Scientific Reports [https://www.nature.com/articles/s41598-025-95226-0]
- 32. Kits DNA : Spin Extraction . Compared Columns vs Magnetic Beads [https://synapse.patsnap.com/article/dna-extraction-kits-compared-spin-columns-vs-magnetic-beads]
- 33. and Limitations of Spin Advantages ... Column DNA Extraction [https://geneticeducation.co.in/advantages-and-limitations-of-spin-column-dna-extraction-technique/]
- 34. SPRI Beads Spin vs | MagBio Genomics Columns [https://www.magbiogenomics.com/latest/post/magnetic-bead-dna-cleanup-protocols-optimizing-pcr-cleanups-with-highprep-vs-spin-columns]
- 35. Utility of Magnetic Bead-Based Automated DNA Extraction to Improve Chagas Disease Molecular Diagnosis [https://www.mdpi.com/1422-0067/26/3/937]
- 36. of the Comparison and Disadvantages of Several Advantages ... DNA [https://www.linkedin.com/pulse/comparison-advantages-disadvantages-several-dna-extraction-methods-1jgbf]
- 37. Integrated DNA and RNA extraction using magnetic beads from viral pathogens causing acute respiratory infections | Scientific Reports [https://www.nature.com/articles/srep45199]
- 38. Frontiers | Comparison of DNA methods for detecting... extraction [https://www.frontiersin.org/journals/veterinary-science/articles/10.3389/fvets.2025.1675115/full]
- 39. What are Magnetic Beads and How Do They Work for Isolation of Biomolecules? | MagBio Genomics [https://www.magbiogenomics.com/latest/post/what-are-magnetic-beads-and-how-do-they-work-for-isolation-of-biomolecules]
- 40. Optimizing extraction of microbial DNA from urine: Advancing urinary microbiome research in bladder cancer - PMC [https://pmc.ncbi.nlm.nih.gov/articles/PMC12058534/]
- 41. Improved single-swab sample preparation for recovering bacterial and phage DNA from human skin and wound microbiomes | BMC Microbiology | Full Text [https://bmcmicrobiol.biomedcentral.com/articles/10.1186/s12866-019-1586-4]
- 42. Optimizing extraction of microbial DNA from urine: Advancing urinary microbiome research in bladder cancer - PubMed [https://pubmed.ncbi.nlm.nih.gov/40312907/]
- 43. Microbiome Sample - Tips and Tricks Preparation [https://www.qiagen.com/us/knowledge-and-support/knowledge-hub/science-matters/microbiome/microbiome-sample-preparation-tips-and-tricks]
- 44. Bacterial and Fungal DNA from Extraction : Manual... Blood Samples [https://link.springer.com/protocol/10.1007/978-1-4939-1776-1_11]
- 45. Culture independent DNA extraction method for bacterial cells concentrated from water - PMC [https://pmc.ncbi.nlm.nih.gov/articles/PMC8933712/]
- 46. Genomic DNA Extraction - PureLink | Thermo Fisher Scientific - US [https://www.thermofisher.com/us/en/home/references/protocols/nucleic-acid-purification-and-analysis/dna-extraction-protocols/genomic-dnaextractiion-purelink.html]
- 47. How to Master the Microbiome: Lysis and... | ZYMO RESEARCH [https://www.zymoresearch.com/blogs/blog/how-to-master-the-microbiome-lysis-and-extraction]
- 48. - Gram vs Gram-negative positive - Difference and... | Diffen Bacteria [https://www.diffen.com/difference/Gram-negative_Bacteria_vs_Gram-positive_Bacteria]
- 49. Comparative study of fungal cell disruption—scope and limitations of the methods - PMC [https://pmc.ncbi.nlm.nih.gov/articles/PMC3189342/]
- 50. The bacteriolytic activity of native and covalently immobilized lysozyme... [https://pubmed.ncbi.nlm.nih.gov/30868059/]
- 51. Impact of RNA extraction on respiratory microbiome analysis using... [https://bmcgenomics.biomedcentral.com/articles/10.1186/s12864-025-12028-4]
- 52. The Development of an Effective Bacterial Single-Cell Lysis Method Suitable for Whole Genome Amplification in Microfluidic Platforms | MDPI [https://www.mdpi.com/2072-666X/9/8/367]
- 53. Simple lysis of bacterial cells for DNA-based diagnostics using hydrophilic ionic liquids | Scientific Reports [https://www.nature.com/articles/s41598-019-50246-5]
- 54. Comparison of Methods for Isolation of Bacterial and Fungal DNA from Human Blood - PMC [https://www.ncbi.nlm.nih.gov/pmc/articles/PMC3895209/]
- 55. of four Comparison methods for 16s rRNA microbiota... DNA extraction [https://bmcresnotes.biomedcentral.com/articles/10.1186/s13104-023-06451-7]
- 56. : The Right Platform for Automation - High Throughput DNA Extraction [https://norgenbiotek.com/blog/automation-right-platform-high-throughput-dna-extraction]
- 57. vs. Manual Automated : Advancing Molecular Biology... DNA Extraction [https://blog.invitek.com/articles/lifescience/automated-vs.-manual-dna-extraction]
- 58. DNA Purification | DNA Extraction Methods [https://www.promega.com/resources/guides/nucleic-acid-analysis/dna-purification/]
- 59. Applications & Solutions - Genomics - Nucleic acid purification [https://lifesciences.tecan.com/applications_and_solutions/genomics/nucleic_acid_purification]
- 60. of four Comparison kits efficiency for 16SrDNA... DNA extraction [https://pmc.ncbi.nlm.nih.gov/articles/PMC10051199/]
- 61. What Are PCR ? | ZYMO RESEARCH Inhibitors [https://www.zymoresearch.com/blogs/blog/what-are-pcr-inhibitors]
- 62. in qPCR, dPCR and MPS— PCR and solutions inhibition mechanisms [https://link.springer.com/article/10.1007/s00216-020-02490-2]
- 63. Reducing PCR in Forensic Science Inhibition [https://www.news-medical.net/life-sciences/Reducing-PCR-Inhibition-in-Forensic-Science.aspx]
- 64. Mutants of Taq DNA polymerase resistant to PCR allow... inhibitors [https://pmc.ncbi.nlm.nih.gov/articles/PMC2655666/]
- 65. A comparison of four methods for PCR inhibitor removal - ScienceDirect [https://www.sciencedirect.com/science/article/abs/pii/S1872497314002762]
- 66. Optimizing Forensic DNA : Best Practices for Trace and... Extraction [https://blog.invitek.com/articles/lifescience/optimizing-forensic-dna-extraction-best-practices-for-trace-and-degraded-evidence]
- 67. Improved amplification of microbial from blood cultures by... DNA [https://pubmed.ncbi.nlm.nih.gov/9738025/]
- 68. Rapid and reliable DNA techniques from... extraction [https://experts.umn.edu/en/publications/rapid-and-reliable-dna-extraction-techniques-from-trypan-blue-sta]
- 69. Novel perspectives to purify genomic DNA from high humic acid content and contaminated soils - ScienceDirect [https://www.sciencedirect.com/science/article/pii/S1383586610002947]
- 70. Frontiers | Enhancing the DNA yield intended for microbial sequencing from a low-biomass chlorinated drinking water [https://www.frontiersin.org/journals/microbiology/articles/10.3389/fmicb.2024.1339844/full]
- 71. of subsampling, decontamination, and Optimization ... DNA extraction [https://www.nature.com/articles/s41598-020-71234-0?error=cookies_not_supported&code=b6f0a749-957a-4fc0-89dc-96350f710289]
- 72. of Optimisation from Nasal Lining Fluid to Assess the... DNA Extraction [https://pubmed.ncbi.nlm.nih.gov/40466051/]
- 73. Recovery of microbial DNA by agar-containing solution from extremely low-biomass specimens including skin | Scientific Reports [https://www.nature.com/articles/s41598-023-46890-7]
- 74. of DNA directly from infected tissue: an... extraction microbial DNA [https://www.nature.com/articles/s41598-020-59957-6?error=cookies_not_supported]
- 75. controls: DNA (accessible) - GOV.UK contamination laboratory [https://www.gov.uk/government/publications/dna-contamination-controls-laboratory/dna-contamination-controls-laboratory-accessible]
- 76. Collection, Sample , and Library Construction... DNA Extraction [https://pmc.ncbi.nlm.nih.gov/articles/PMC10260709/]
- 77. A method for assessing efficiency of bacterial cell disruption and DNA release - PMC [https://pmc.ncbi.nlm.nih.gov/articles/PMC5002184/]
- 78. DNA and RNA Extraction and Quantitative Real-Time PCR-Based Assays for Biogas Biocenoses in an Interlaboratory Comparison - PMC [https://www.ncbi.nlm.nih.gov/pmc/articles/PMC5597165/]
- 79. GC-Rich PCR System with dNTPs Roche [https://www.sigmaaldrich.com/US/en/product/roche/04743784001]
- 80. High/Low GC Content DNA Sequences - Molecular Assemblies [https://molecularassemblies.com/high-low-gc-content/]
- 81. How to Work with Challenging or Limited Genomic Samples... [https://blog.omni-inc.com/blog/how-to-work-with-challenging-or-limited-genomic-samples-updated-for-2025]
- 82. Benchmarking DNA isolation methods for marine metagenomics | Scientific Reports [https://www.nature.com/articles/s41598-023-48804-z]
- 83. of HMW Size by semi- selection precipitation DNA selective DNA [https://nanoporetech.com/document/extraction-method/size-selection2]
- 84. Impact of DNA , PCR amplification, sequencing, and... extraction [https://bmcmicrobiol.biomedcentral.com/articles/10.1186/s12866-024-03677-8]
- 85. Evaluation of DNA kits for long-read shotgun metagenomics... extraction [https://www.nature.com/articles/s41598-024-80660-3?error=cookies_not_supported&code=b53e7523-ee5e-448d-b3b3-6d635df93559]
- 86. of Benchmarking for... | Preprints.org DNA Extraction Methods [https://www.preprints.org/manuscript/202409.0722/v1]
- 87. Measuring sequencer size bias using REcount: a novel method for highly accurate Illumina sequencing-based quantification | Genome Biology | Full Text [https://genomebiology.biomedcentral.com/articles/10.1186/s13059-019-1691-6]
- 88. Fast Track Diagnostic Tools for Clinical Management of Sepsis: Paradigm Shift from Conventional to Advanced Methods [https://www.mdpi.com/2075-4418/13/2/277]
- 89. FcMBL magnetic - bead MALDI-TOF MS rapidly identifies... based [https://pubmed.ncbi.nlm.nih.gov/36413530/]
- 90. FcMBL magnetic -based MALDI-TOF MS rapidly... | PLOS One bead [https://journals.plos.org/plosone/article?id=10.1371/journal.pone.0276777]
- 91. Development of a Multiplexed qPCR Kit for the Detection of... [https://pmc.ncbi.nlm.nih.gov/articles/PMC12089792/]
- 92. Comparison evaluation of bacterial DNA extraction methods for improved molecular diagnostic accuracy of sepsis-causing pathogens in clinical whole blood samples | Scientific Reports [https://www.nature.com/articles/s41598-025-87225-y]
- 93. Frontiers | Rapid and sensitive identification of Candida in blood based... [https://www.frontiersin.org/journals/cellular-and-infection-microbiology/articles/10.3389/fcimb.2025.1552529/full]
- 94. Summarizing and correcting the GC in high-throughput... content bias [https://pmc.ncbi.nlm.nih.gov/articles/PMC3378858/]
- 95. Systematic Comparison of Three Methods for Fragmentation of Long-Range PCR Products for Next Generation Sequencing - PMC [https://pmc.ncbi.nlm.nih.gov/articles/PMC3227650/]
- 96. A comparison of DNA fragmentation methods - Applications for the biochip technology - PubMed [https://pubmed.ncbi.nlm.nih.gov/28666852/]
- 97. Effects of GC in Next-Generation-Sequencing Data... | PLOS One Bias [https://journals.plos.org/plosone/article?id=10.1371/journal.pone.0062856]
- 98. Fragmentation of Genomic DNA using Microwave Irradiation - PMC [https://pmc.ncbi.nlm.nih.gov/articles/PMC3671502/]
- 99. DNA extraction for human microbiome studies: the issue of standardization | Genome Biology | Full Text [https://genomebiology.biomedcentral.com/articles/10.1186/s13059-019-1843-8]
- 100. Convenient determination of DNA extraction efficiency using an external DNA recovery standard and quantitative-competitive PCR - PubMed [https://pubmed.ncbi.nlm.nih.gov/15063066/]
- 101. Frontiers | Optimizing sample for culture-free nanopore... preparation [https://www.frontiersin.org/journals/microbiology/articles/10.3389/fmicb.2025.1680165/full]
- 102. Methods for ensuring the highest DNA concentration and yield in future and retrospective trace DNA extracts - ScienceDirect [https://www.sciencedirect.com/science/article/abs/pii/S1355030620303129]
- 103. Validation and standardization of DNA and library... extraction [https://microbiomejournal.biomedcentral.com/articles/10.1186/s40168-021-01048-3]
- 104. interlaboratory comparison study: Topics by Science.gov [https://www.science.gov/topicpages/i/interlaboratory+comparison+study.html]
- 105. Evaluating Inter-Laboratory Comparison Data | NIST [https://www.nist.gov/publications/evaluating-inter-laboratory-comparison-data]
- 106. Impact of DNA on Gut Microbiome Profiles... Extraction Methods [https://link.springer.com/article/10.1007/s43657-025-00232-x]
- 107. Towards standards for human fecal sample... | Nature Biotechnology [https://www.nature.com/articles/nbt.3960?error=cookies_not_supported&code=1d5452b6-0a78-482e-8ba8-0d787a3f6a32]
- 108. Optimization of DNA extraction and sampling methods for successful forensic microbiome analyses of the skin and saliva - PubMed [https://pubmed.ncbi.nlm.nih.gov/36416962/]
- 109. DNA extraction of microbial DNA directly from infected tissue: an optimized protocol for use in nanopore sequencing | Scientific Reports [https://www.nature.com/articles/s41598-020-59957-6]
- 110. of an intestinal triple culture to confirm... Interlaboratory comparison [https://pmc.ncbi.nlm.nih.gov/articles/PMC11756443/]