How to Fix Smeared Bands in Agarose Gel Electrophoresis: A Complete Troubleshooting Guide
Smeared bands in agarose gel electrophoresis are a common yet critical issue that can compromise data integrity in molecular biology, diagnostics, and drug development workflows.
How to Fix Smeared Bands in Agarose Gel Electrophoresis: A Complete Troubleshooting Guide
Abstract
Smeared bands in agarose gel electrophoresis are a common yet critical issue that can compromise data integrity in molecular biology, diagnostics, and drug development workflows. This article provides a comprehensive, step-by-step guide for researchers and scientists to diagnose, resolve, and prevent band smearing. Covering foundational principles, methodological best practices, a systematic troubleshooting protocol, and advanced validation techniques, this resource synthesizes current knowledge to enable clear, reproducible nucleic acid separation and accurate experimental results.
Understanding Band Smearing: Causes and Consequences for Data Integrity
What is Band Smearing? Defining Diffused, Fuzzy Bands and Their Impact on Analysis
Band smearing, also known as diffused or fuzzy bands, is a common problem in gel electrophoresis where nucleic acid bands appear blurry, poorly resolved, and spread out rather than as sharp, distinct lines [1]. This artifact hinders accurate analysis by making it difficult to determine fragment sizes, quantify samples, and interpret results, ultimately compromising downstream experiments and data integrity [1] [2].
What is Band Smearing?
In a well-functioning gel, DNA or RNA fragments of the same size migrate together as a tight, sharp band. Band smearing occurs when these fragments spread out vertically in the lane, creating a diffuse, "smeared" appearance from larger to smaller fragment sizes [1] [2]. This is distinct from "smiling" or "frowning" bands, which are caused by uneven heat distribution across the gel [2].
Smearing directly impacts analytical results by reducing resolution, making it impossible to distinguish closely sized fragments, and leading to inaccurate quantification of nucleic acid concentration or purity [1].
Troubleshooting Guide: Causes and Solutions
A systematic approach is essential for diagnosing and resolving band smearing. The following tables summarize the primary causes and their solutions.
Sample Preparation Issues
| Cause | Description | Solution |
|---|---|---|
| Sample Degradation [1] [2] | Nucleic acids are broken down by nucleases (DNAse or RNAse) into random fragments, creating a continuous smear. | Use nuclease-free reagents and labware. Wear gloves, and work in a designated, clean area [1]. |
| Sample Overloading [1] [3] [4] | Too much DNA in a well overwhelms the gel's sieving capacity, causing trailing smears and U-shaped bands. | Load 0.1–0.2 μg of DNA per mm of well width. For ladders, 50-200 ng per lane is often sufficient [1] [4]. |
| High Salt Concentration [1] | Excess salt in the sample increases local conductivity, distorting the electric field and migration. | Dilute, purify, or precipitate the sample to remove salts. Resuspend in nuclease-free water [1]. |
| Protein Contamination [1] | Proteins in the sample can bind to nucleic acids, interfering with their mobility through the gel. | Purify the sample or use a loading dye with SDS and heat the sample to denature and dissociate proteins [1]. |
| Incorrect Loading Buffer [1] | Using a non-denaturing buffer for single-stranded nucleic acids can allow secondary structures to form. | For RNA or ssDNA, use a loading dye containing a denaturant (e.g., formamide, urea) and heat the sample [1]. |
Gel and Electrophoresis Conditions
| Cause | Description | Solution |
|---|---|---|
| Incorrect Gel Percentage [1] [2] | A gel with pores that are too large will not resolve small fragments well; pores that are too small will impede large fragments. | Use an appropriate gel concentration for your fragment size range (see table below) [1] [5]. |
| Poorly Formed Wells [1] | Wells that are torn, connected, or have a thin bottom can cause sample leakage and smearing. | Use a clean comb, avoid pushing it to the very bottom of the gel tray, and remove it carefully after solidification [1]. |
| Excessive Voltage [1] [6] [2] | High voltage generates excessive heat, which can denature DNA and cause band diffusion and smearing. | Run the gel at a lower voltage (e.g., 5-10 V/cm of gel length). Use a power supply with constant current mode if available [6] [2]. |
| Incorrect Running Buffer [1] [7] | Using old, depleted, or incorrectly prepared buffer reduces buffering capacity and can lead to poor resolution. | Prepare fresh running buffer (TAE or TBE) for each run. TBE has higher buffering capacity for longer runs [1] [7] [5]. |
| Improper Staining [1] [4] | Performing "pre-staining" (adding dye to the gel) can interfere with DNA migration, especially with high-affinity dyes. | Use a post-staining protocol where the gel is submerged in a dilute dye solution after electrophoresis [4]. |
Key Experimental Protocols for Prevention
Agarose Gel Preparation and Casting
- Gel Thickness: Keep horizontal agarose gels between 3–4 mm thick to prevent band diffusion during the run [1].
- Well Formation: Ensure wells are properly formed by using a clean comb and allowing the gel to solidify completely before removal. Avoid overfilling the gel tray to prevent connected wells [1].
- Buffer Selection: Choose between TAE and TBE based on your needs. TBE buffer offers higher buffering capacity and sharper resolution for smaller fragments (<1 kb), while TAE is better for larger DNA fragments and is more compatible with downstream enzymatic reactions [6] [5].
Sample Preparation Best Practices
- Quantification and Loading: Accurately quantify DNA and avoid overloading. A general guideline is to load a maximum of 100-250 ng of DNA per millimeter of well width [1] [5].
- Desalting Samples: If you suspect high salt, purify samples using a spin column or ethanol precipitation and resuspend in nuclease-free water or a low-salt buffer [1].
- Denaturation for RNA/ssDNA: For single-stranded nucleic acids, use a denaturing loading buffer and heat samples at 65-70°C for 5-10 minutes before loading to prevent secondary structure formation [1].
Gel Running Conditions
- Voltage and Cooling: Run gels at a moderate voltage (5-10 V/cm) to minimize heat generation. If overheating is a persistent issue, run the gel in a cold room or use a recirculating cooler [6] [2].
- Run Time Monitoring: Monitor the migration of the loading dye. Do not over-run the gel, as this can cause smaller fragments to migrate off the gel and lead to diffusion of others [1].
The Scientist's Toolkit: Essential Reagents and Materials
| Item | Function in Preventing Smearing |
|---|---|
| Low EEO Agarose (e.g., Agarose LE A1705) | Minimizes electroendosmosis (EEO), which can cause band distortion and blurring [6]. |
| Molecular Biology Grade Water | Ensures reagents and samples are nuclease-free, preventing sample degradation [1]. |
| Fresh APS and TEMED | Critical for complete and consistent polymerization of polyacrylamide gels, preventing poorly formed gels that cause smearing [8] [5]. |
| TAE or TBE Buffer | Provides the ionic environment and pH for electrophoresis. Fresh buffer is crucial for consistent results [7]. |
| Appropriate Loading Dye | Contains density agents to sink samples and tracking dyes. Must be chosen based on nucleic acid type (denaturing vs. non-denaturing) [1]. |
| Spin Desalting Columns | Quickly remove excess salts from samples before loading, preventing salt-induced smearing [1] [5]. |
| Post-staining Dye (e.g., GelRed) | Staining the gel after the run eliminates potential interference of the dye with DNA migration [4]. |
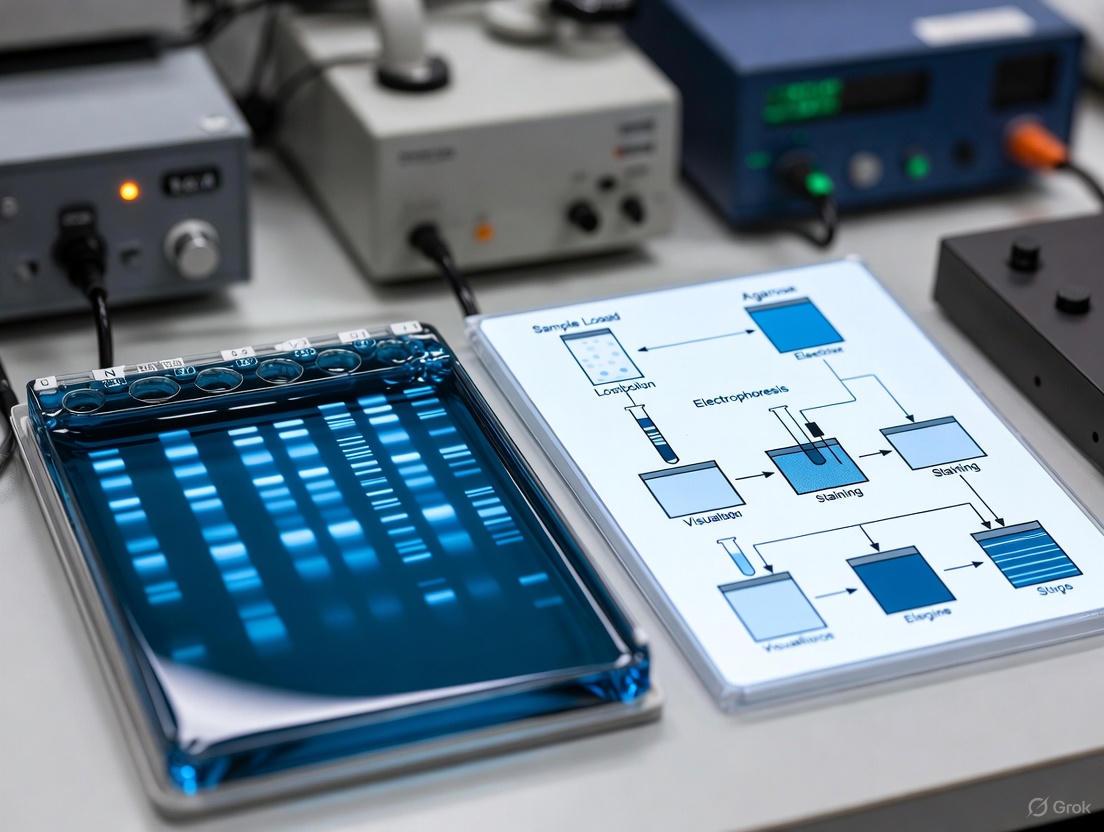
The following workflow diagram outlines the systematic thought process for diagnosing and resolving band smearing.
Frequently Asked Questions (FAQs)
What is the most common cause of band smearing?
The most frequent causes are sample degradation by nucleases and sample overloading [1] [2]. Always practice good laboratory hygiene to prevent nuclease contamination and carefully quantify your DNA before loading.
How does too much DNA cause smearing?
Overloading the well with DNA exceeds the gel's sieving capacity. The excess DNA cannot be resolved properly, leading to a trailing smear behind the main band or a thick, fused band [1] [4]. Reducing the amount of DNA loaded per lane is often the quickest fix.
Can the running buffer really cause smearing?
Yes. Using old, depleted, or incorrectly prepared running buffer reduces its buffering capacity. This can lead to pH shifts and an unstable electrical field during the run, resulting in poor resolution and smeared bands [1] [7]. Always use fresh buffer.
My PCR product is smeared. What should I check first?
For PCR-specific smearing, first try reducing the amount of template DNA and lowering the number of PCR cycles (stay within 20-35 cycles) [3]. Other common fixes include raising the annealing temperature to improve specificity and ensuring you are using fresh reagents [3] [9].
When should I use a denaturing gel?
You should use a denaturing gel (containing urea or formamide) when running RNA or single-stranded DNA [1] [5]. These denaturants prevent the nucleic acids from forming secondary structures, which can cause aberrant migration and smearing on a native gel. For double-stranded DNA, a standard (non-denaturing) gel is appropriate.
Agarose gel electrophoresis is a foundational technique in molecular biology labs worldwide, enabling the separation, analysis, and purification of nucleic acids. At the heart of this technique lies a critical interaction: the relationship between the pore size of the agarose gel matrix and the mobility of DNA and RNA fragments. This article explores the science behind this interaction and provides a comprehensive technical support framework, focusing on resolving the common yet frustrating issue of smeared bands, a key challenge in quantitative and qualitative nucleic acid analysis.
Core Principles: Pore Size and Molecular Sieving
The effectiveness of agarose gel electrophoresis is governed by a fundamental physical principle: charged particles migrate towards an electrode of the opposite polarity when subjected to an electric field [10]. For nucleic acids, which possess a uniform negative charge due to their phosphate backbone, the primary factor influencing their differential migration is their size, as they navigate the porous gel matrix [10].
The agarose gel acts as a molecular sieve. Its pore size directly determines the frictional coefficient that DNA molecules encounter. Smaller molecules can navigate the gel's pores more easily and thus migrate faster, while larger molecules are impeded and move more slowly [10]. The median pore size of a standard 1% agarose gel is approximately 100 nanometers [11]. However, unlike synthetic polymers like polyacrylamide, agarose does not have a perfectly consistent pore size, leading to a range of pore dimensions within a single gel [11].
The concentration of agarose used to cast the gel is the single most important factor determining the average pore size and, consequently, the optimal size range of nucleic acids that can be effectively separated.
Table 1: Agarose Gel Concentration and Optimal DNA Separation Range
| Agarose Gel Concentration (%) | Optimal DNA Fragment Size Range (base pairs) |
|---|---|
| 0.5% | 1,000 - 30,000 |
| 0.8% | 800 - 10,000 |
| 1.0% | 500 - 7,000 |
| 1.2% | 400 - 5,000 |
| 1.5% | 200 - 3,000 |
| 2.0% | 100 - 2,000 |
| 3.0% | 50 - 1,000 |
Source: Adapted from GoldBio Agarose Gel FAQs [11]
Using a gel concentration inappropriate for your target fragment size is a primary cause of poor resolution and smearing. A gel with too low a concentration (too large pores) will not adequately resolve small fragments, while a gel with too high a concentration (too small pores) can hinder the migration of large fragments, leading to diffusion and smearing [1] [12].
Troubleshooting Guide: Resolving Smeared Bands
Smeared or diffused bands are a common issue that compromises the integrity of your data. The following workflow diagram outlines a systematic approach to diagnose and fix this problem, with detailed explanations provided in the subsequent table.
Diagram 1: A systematic troubleshooting workflow for resolving smeared bands.
Table 2: Comprehensive Troubleshooting Guide for Smeared Bands
| Category | Possible Cause | Recommended Solution |
|---|---|---|
| Sample Quality | DNA Degradation (e.g., by nuclease contamination) [13] [12] | Use molecular biology-grade reagents and nuclease-free labware. Wear gloves, and use dedicated areas for nucleic acid work [1]. Re-isolate DNA if necessary [14]. |
| Protein Contamination [1] | Purify the sample or use a loading dye containing SDS and heat the sample before loading to denature and dissociate proteins [1]. | |
| Gel & Electrophoresis | Incorrect Gel Concentration [1] [12] | Prepare a new gel at a percentage appropriate for your DNA fragment size (see Table 1). Ensure the gel volume is adjusted with water after boiling to compensate for evaporation and prevent an unintentionally high gel percentage [1]. |
| Too Much Template DNA [14] | Reduce the amount of DNA loaded into the well. The general recommendation is 0.1–0.2 μg of DNA per millimeter of gel well width [1]. | |
| Voltage Too High [12] | High voltage (>150V) can cause smearing. Run the gel at a lower voltage (e.g., 110-130V) [12]. Excessive heat generated during a long run can also denature samples and cause band diffusion [1]. | |
| Old or Incorrect Running Buffer [12] | Always use freshly prepared running buffer. For small gels, change the TAE/TBE buffer with every run [14]. A buffer with high buffering capacity is recommended for runs longer than 2 hours [1]. | |
| Sample Preparation | High Salt Concentration in Sample [1] | Dilute the sample in nuclease-free water before adding the loading buffer, or purify/precipitate the nucleic acid to remove excess salt [1]. |
| Incompatible Loading Buffer [1] | For double-stranded DNA, avoid loading dyes with denaturants. For single-stranded nucleic acids like RNA, use a denaturing loading dye and heat the sample to prevent secondary structure formation [1]. | |
| Visualization | Band Diffusion | Avoid delays between electrophoresis and visualization. If a delay is necessary, wrap the gel in plastic wrap without buffer and store at 4°C to prevent DNA from leaching out and smearing [11]. |
Frequently Asked Questions (FAQs)
1. Why are my PCR bands faint or weak? Faint bands are often due to low quantity of sample, degraded DNA, or suboptimal PCR conditions [14] [1]. To resolve this, consider increasing your cycle times, checking your DNA template concentration (and increasing it if too low), ensuring you are using fresh reagents, and increasing primer concentration [14]. For visualization, ensure you are using a sensitive stain and that it is thoroughly mixed into the gel [1].
2. My gel shows three bands for my uncut plasmid. Is this normal? Yes, this is a classic and expected result. Uncut plasmid DNA can exist in several conformations: supercoiled (fastest migrating), linear (intermediate migration), and nicked/open circular (slowest migrating) [15]. When you linearize the plasmid with a restriction enzyme, these should consolidate into a single, clean band [15].
3. Can I reuse my agarose gel? Agarose can be remelted and reused, which is a cost-saving measure for routine checks or demonstrations [11]. However, for critical work like cloning, sequencing, or publication, it is highly recommended to use a fresh gel, as background interference increases with each reuse [11]. If reusing, be cautious when remelting agarose containing ethidium bromide, as vapor release is a concern [11].
4. How do I know if my DNA is degraded? Run your DNA sample on a 0.8% - 1% gel at low voltage (~75V) for about 45 minutes. Intact genomic DNA should appear as a tight, high-molecular-weight band near the top of the gel. A smeared trail running down the gel is a strong indication of degradation [11].
The Scientist's Toolkit: Essential Research Reagents
Table 3: Key Reagents for Agarose Gel Electrophoresis
| Reagent/Material | Function & Importance |
|---|---|
| Agarose | A polysaccharide derived from seaweed that forms the porous gel matrix for separation. The concentration used dictates the pore size and resolution range [11]. |
| TAE or TBE Buffer | Provides the ions necessary to carry the electrical current and maintains a stable pH during electrophoresis. Fresh buffer is critical, as exhausted buffer leads to poor conductivity and smearing [14] [10]. |
| DNA Molecular Weight Ladder | A mixture of DNA fragments of known sizes, essential for estimating the size of unknown DNA fragments in adjacent lanes. Available in various size ranges (e.g., 50 bp, 100 bp, 1 kb) to match your experiment [16] [17]. |
| Loading Dye | Typically contains a dense agent (e.g., glycerol) to help the sample sink into the well, and one or more colored dyes (e.g., bromophenol blue) to visually track the progress of the electrophoresis run [10]. |
| Nucleic Acid Stain | Allows visualization of DNA/RNA under specific light. Common stains include Ethidium Bromide (EtBr), SYBR Safe, GelRed, and GelGreen. Stains can be added to the gel during casting or used to stain the gel after electrophoresis [12]. Safety and sensitivity vary between stains [12]. |
Experimental Protocol: Standard Agarose Gel Electrophoresis
This detailed protocol ensures consistent, high-quality results for the separation of DNA fragments.
Gel Preparation:
- Select an agarose concentration based on your expected DNA fragment sizes (refer to Table 1).
- Weigh the appropriate mass of agarose powder and add it to the correct volume of TAE or TBE buffer in a flask. The flask should be 2-4 times the volume of the solution to prevent boiling over [11].
- Heat the mixture in a microwave in short bursts (e.g., 30 seconds), swirling in between, until the agarose is completely dissolved and the solution is clear [11].
- Allow the solution to cool to about 50-60°C. If you are adding fluorescent stain (e.g., EtBr, SYBR Safe), add it at this stage and mix thoroughly.
- Pour the gel into a casting tray with the comb in place. Allow it to solidify completely at room temperature.
Sample and Ladder Loading:
- Once solidified, carefully remove the comb and place the gel into the electrophoresis chamber. Submerge the gel completely in running buffer (TAE/TBE).
- Mix your DNA samples with an appropriate loading dye.
- Load your samples and a suitable DNA molecular weight ladder into the wells. Ensure you do not exceed the well's capacity (0.1–0.2 μg of DNA per millimeter of well width) [1].
Electrophoresis Run:
- Connect the electrodes correctly (DNA is negatively charged and will run to the positive anode/red electrode).
- Apply an appropriate voltage. For sharp, well-resolved bands, 110-130V is often recommended [12]. Monitor the migration of the dye fronts.
Visualization and Analysis:
- After the run, visualize the gel using a UV transilluminator or blue light system if using a compatible stain.
- Compare the migration distance of your sample bands to the DNA ladder to estimate fragment sizes.
This troubleshooting guide addresses the common issue of smeared bands in agarose gel electrophoresis, a critical technical challenge that can compromise data integrity and delay research progress in molecular biology and drug development. Smearing presents as diffused, fuzzy bands rather than sharp, distinct ones, often indicating problems with sample integrity, gel preparation, or running conditions. This guide provides a systematic approach to diagnosing and resolving these issues through targeted FAQs and detailed protocols.
Troubleshooting FAQs
1. Why are my DNA bands smeared instead of sharp?
Smeared bands typically result from sample degradation, gel overloading, or suboptimal electrophoresis conditions. Sample degradation occurs due to nuclease contamination or improper handling, fragmenting DNA into various sizes that appear as a smear [2] [1]. Overloading wells with too much DNA (exceeding 0.1-0.2 μg per millimeter of well width) causes trailing smears as the gel's capacity is exceeded [1] [18]. Excessive voltage (>150V for standard gels) generates heat that can denature DNA and cause band diffusion [12] [2]. Incorrect gel concentration prevents proper size separation—too low a percentage doesn't resolve small fragments, while too high a percentage impedes large fragments [2] [18].
2. How can I prevent smearing when running high-sensitivity samples?
For valuable or low-concentration samples, implement these preventive measures: Use fresh reagents including buffers and staining solutions to avoid nuclease contamination [19] [2]. Optimize loading amounts by loading 0.1-0.2 μg DNA per millimeter of well width and using deep, narrow wells for better resolution [1]. Employ proper running conditions—maintain voltage between 80-130V, use appropriate run times, and ensure adequate buffer levels to prevent overheating [12] [18]. Handle samples carefully using nuclease-free reagents, wearing gloves, and working in clean areas designated for nucleic acid handling [1].
3. My PCR product shows smearing. Is this a gel issue or PCR problem?
Smeared PCR products can originate from either source. PCR-related causes include too much template DNA, excessive cycle numbers, or primer-related issues [19]. Gel-related causes encompass overloading, incorrect voltage, or buffer problems [12] [1]. To diagnose: Run a DNA ladder—if it appears smeared, the issue is likely with the gel or running conditions; if only PCR samples are smeared, optimize PCR parameters by reducing template amount, lowering cycle numbers, or increasing annealing temperature [19].
4. What causes "smiling" or "frowning" bands where migration is uneven?
Uneven band migration patterns result from temperature gradients across the gel. "Smiling" bands (curving upward) occur when the center of the gel becomes hotter than edges, causing DNA in middle lanes to migrate faster [2]. This Joule heating effect is pronounced at high voltages or with depleted buffers [2]. Solutions include: Reducing voltage to minimize heat generation, using fresh buffer with consistent levels across the tank, and employing constant current power supplies to maintain uniform temperature [2].
5. Why do I see no bands at all after electrophoresis?
Complete absence of bands indicates fundamental issues with detection or electrophoresis setup. Visualization failures include forgetting to add stain, using degraded stain, or incorrect light sources for fluorescent dyes [12] [20]. Electrophoresis setup errors encompass reversed electrodes (DNA runs backward), power supply not functioning, or buffer concentration errors [1] [20]. Sample issues include severe degradation, insufficient concentration, or failed amplification [2] [1]. Always include a DNA ladder control—if the ladder is visible but samples aren't, the issue lies with sample preparation rather than the gel system [2].
Troubleshooting Flowchart
The following diagram outlines a systematic approach to diagnose and resolve smearing issues in agarose gel electrophoresis:
Optimized Experimental Conditions Table
The table below summarizes key parameters for preventing smearing and achieving optimal band resolution:
| Parameter | Problematic Range | Optimal Range | Effect on Band Appearance |
|---|---|---|---|
| DNA Load | >0.2 µg/mm well width | 0.1-0.2 µg/mm well width | Prevents overloading smears & U-shaped bands [1] |
| Voltage | >150V | 80-130V | Reduces heat-induced smearing & denaturation [12] [2] |
| Agarose % | <0.8% (large fragments)>2.5% (small fragments) | 0.8-2.0% (DNA)Higher for small fragments | Ensures appropriate pore size for fragment separation [18] |
| Cycle Number | >35 cycles (PCR) | 20-35 cycles | Prevents excessive product generation & nonspecific binding [19] |
| Gel Thickness | >5mm | 3-4mm | Prevents band diffusion during electrophoresis [1] |
| Run Time | Very short or very long | Fragment size-dependent | Ensures sufficient separation without excessive diffusion [1] |
Research Reagent Solutions
This table outlines essential reagents and materials for high-quality agarose gel electrophoresis:
| Reagent/Material | Function | Optimization Tips |
|---|---|---|
| Agarose | Forms porous matrix for size separation | Choose concentration based on fragment size: 0.8% for large (1-10kb), 2% for small (100-500bp) fragments [18] |
| TAE/TBE Buffer | Conducts current & maintains pH | Prepare fresh for each run; TAE for longer fragments, TBE for smaller fragments & higher voltages [18] |
| DNA Stain | Visualizes nucleic acids | Use appropriate stain (EthBr, SYBR, GelRed); ensure correct concentration & penetration time [12] [1] |
| Loading Dye | Adds density & tracking | Contains glycerol to help samples sink; includes tracking dyes to monitor migration [21] [18] |
| DNA Ladder | Size reference | Always include to verify electrophoresis performance & fragment size determination [12] [2] |
Detailed Troubleshooting Protocols
Protocol 1: Addressing Sample Degradation
Objective: Eliminate nuclease contamination and preserve sample integrity throughout processing.
Materials:
- Molecular biology grade reagents
- Nuclease-free tubes and tips
- Fresh glove supply
- Dedicated RNA/DNA work area
Methodology:
- Wear gloves throughout procedure and change frequently [1]
- Use dedicated work areas and equipment for nucleic acid handling [1]
- Prepare fresh buffers using molecular biology grade reagents [2]
- Store samples appropriately at -20°C or -80°C for long-term preservation
- Include degradation controls by running intact control DNA alongside experimental samples
Expected Outcomes: Sharp, distinct bands without the downward smearing characteristic of degraded nucleic acids.
Protocol 2: Optimizing Gel Running Conditions
Objective: Establish electrophoretic conditions that minimize heat generation and maximize separation efficiency.
Materials:
- Constant current power supply
- Fresh running buffer (TAE or TBE)
- Cooling apparatus (optional)
- Gel box with evenly spaced electrodes
Methodology:
- Prepare adequate buffer volume to ensure sufficient buffering capacity and heat dissipation [2]
- Set appropriate voltage based on gel size and fragment separation needs (typically 5-10V/cm) [2] [18]
- Monitor buffer temperature during run; if excessively warm (>45°C), reduce voltage [2]
- Use constant current mode if available to maintain uniform temperature [2]
- Run for appropriate duration based on fragment size and gel concentration [1]
Expected Outcomes: Even band migration without smiling/frowning effects and minimal background smearing.
Advanced Technical Considerations
For researchers encountering persistent smearing despite addressing basic parameters, consider these advanced factors:
Nucleic Acid Conformation: Different DNA conformations (supercoiled, nicked circular, linear) migrate at different rates and can cause multiple bands or smearing if not properly accounted for. Using appropriate gel conditions and stains optimized for your specific nucleic acid type is essential [1].
Buffer Composition and pH: Depleted or incorrectly prepared buffers alter system resistance and migration patterns. Always use freshly prepared buffers at correct concentrations and pH (typically 8.0 for TAE/TBE) [2] [18]. For runs longer than 2 hours, use buffers with high buffering capacity [1].
Field Inversion Gel Electrophoresis: For very large DNA fragments (>10kb), conventional electrophoresis may inherently produce smearing. Consider pulsed-field or field inversion techniques that periodically alter current direction to improve separation of large molecules.
Smeared bands on an agarose gel are a common frustration in molecular biology, indicating suboptimal conditions that can compromise experimental results. Within the context of a broader thesis on fixing smeared bands, this guide provides a systematic framework for diagnosing and resolving these issues. By interpreting the specific appearance of the smear—whether it manifests as a high-molecular-weight haze, a low-molecular-weight trail, or a generalized fog—researchers can directly identify the underlying cause, from sample degradation to inappropriate electrophoresis parameters, and apply the correct remedial action. This targeted troubleshooting is essential for ensuring the integrity of data in downstream applications such as cloning, sequencing, and drug development.
FAQ: Diagnosing Your Smeared Bands
What does a smear throughout the entire lane, from top to bottom, typically indicate?
This pattern often points to sample degradation [1] [12]. If the nucleic acids have been broken down by nucleases, you will see a continuous spread of fragments of various sizes instead of discrete, sharp bands. This is a common issue when working with RNA but can also affect DNA if proper sterile techniques are not followed.
What causes a smeared band that appears to "trail" from a sharp band into a lower molecular weight haze?
This "tailing" effect is frequently a sign of overloading your gel [1] [12]. When too much DNA is loaded into a well, the gel matrix becomes saturated, and the DNA cannot migrate cleanly, resulting in a diffuse trail. Reducing the amount of sample loaded will typically resolve this issue.
Why do my bands look fuzzy and poorly resolved, sometimes with a "smiling" effect?
Fuzzy or "smiling" bands (where bands curve upward at the edges) are often the result of excessive heat during electrophoresis [12] [22]. Running a gel at too high a voltage generates heat, which can denature the DNA and cause it to migrate unevenly. Using a lower voltage and ensuring the running buffer is fresh can help maintain a consistent temperature.
I see a smear only in my PCR samples, not in the DNA ladder. What does this mean?
When the smear is isolated to your PCR samples, the problem likely lies in the PCR reaction itself, not the gel process. Common causes include too much template DNA, too many PCR cycles, an excessively long extension time, or a suboptimal annealing temperature that leads to non-specific amplification [23] [24].
Troubleshooting Guide: From Smear to Clear
Use the following table to diagnose your smear pattern and implement the recommended solutions.
| Smear Pattern & Description | Common Causes | Recommended Solutions |
|---|---|---|
| Generalized Smearing (Full-Lane) | ||
| A continuous smear of DNA from the well to the front of the lane [1]. | Sample degraded by nucleases [1] [12]. | Use nuclease-free reagents and labware; always wear gloves; work in a designated, clean area [1]. |
| Gel is too thick (e.g., >5 mm) [1]. | Cast horizontal agarose gels with a thickness of 3–4 mm [1]. | |
| Tailing Smear | ||
| A sharp band with a diffuse "tail" of DNA trailing behind it [1]. | Sample overloaded in the well [1] [12]. | Load 0.1–0.2 μg of DNA per mm of well width; reduce sample volume [1] [23]. |
| High salt concentration in sample buffer [1]. | Dilute sample in nuclease-free water or purify/precipitate DNA to remove salts [1]. | |
| Heat-Related Smearing | ||
| Bands are fuzzy, poorly resolved, and may curve ("smile") [12] [22]. | Voltage set too high, generating excessive heat [12] [22]. | Run gel at a lower voltage (e.g., 50-130V); for longer runs, use a buffer with high buffering capacity like TBE [1] [12] [22]. |
| Running buffer was old or not fresh [22]. | Always use freshly diluted running buffer for each gel run [22]. | |
| PCR-Specific Smearing | ||
| Smearing is observed only in PCR product lanes [23] [24]. | Non-specific amplification due to low annealing temperature or long extension time [23] [24]. | Increase annealing temperature in 2°C increments; reduce extension time; use touchdown PCR [23] [24]. |
| Too much template DNA or too many PCR cycles [23] [24]. | Reduce the amount of template DNA; limit cycles to 20-35 [23] [24]. |
Experimental Protocols for Resolution
Protocol 1: Decontaminating a Degraded Sample
If you suspect nuclease contamination, follow this protocol to clean your sample and equipment.
- Re-purify DNA: Use a commercial DNA clean-up kit to remove nucleases and other contaminants.
- Decontaminate Surfaces: Wipe down your workstation, pipettes, and gel tank with a 10% bleach solution followed by 70% ethanol [24].
- Use Fresh Reagents: Prepare fresh aliquots of buffers, loading dye, and water from concentrated stocks [23].
- UV Irradiation: Leave pipettes and consumables under a UV light in a laminar flow hood overnight to cross-link any residual DNA [24].
Protocol 2: Optimizing Electrophoresis Conditions to Minimize Heat
This protocol is designed to achieve sharp, well-resolved bands by controlling temperature.
- Prepare Fresh Buffer: Dilute a stock solution of TAE or TBE buffer to 1X working concentration on the day of use [22].
- Set Optimal Voltage: For a standard mini-gel, run at a constant voltage of 50-75V [22]. While higher voltages (e.g., 110-130V) can be used [12], lower voltages produce less heat and better resolution.
- Control Temperature: If possible, run the gel in a cold room or use a cooling apparatus to maintain a stable, low temperature [22].
- Monitor Migration: Allow the gel to run slowly until the loading dye has migrated at least two-thirds the length of the gel for sufficient separation.
Protocol 3: Troubleshooting a Smearing PCR Reaction
Follow this step-by-step guide to optimize your PCR and eliminate smearing in the gel.
- Run a Negative Control: Include a reaction with no template DNA to check for contamination [24]. If the negative control is smeared, decontaminate your workspace and use new reagents.
- Reduce Template: If the negative control is clean, reduce the amount of template DNA by 2-5 fold [24].
- Increase Stringency:
- Optimize Cycle Number: Reduce the number of PCR cycles to the minimum necessary for good yield, typically between 20-35 cycles [23].
The Scientist's Toolkit: Research Reagent Solutions
The following table lists key reagents and materials essential for preventing and resolving gel smearing issues.
| Item | Function & Importance in Troubleshooting |
|---|---|
| Molecular Biology Grade Water | Nuclease-free water is essential for preparing samples and buffers to prevent nucleic acid degradation [1]. |
| Fresh Electrophoresis Buffer (TAE/TBE) | Fresh buffer maintains correct pH and ionic strength. Old buffer has reduced buffering capacity, leading to overheating and smearing [22]. |
| DNA Clean-up Kit | Used to re-purify DNA samples contaminated with salts, proteins, or nucleases—common causes of smearing [1] [24]. |
| Hot-Start DNA Polymerase | Reduces non-specific amplification and primer-dimer formation in PCR, which are common sources of smearing [24]. |
| Appropriate Agarose Percentage | Using the correct gel concentration is critical for resolving fragments of your target size. Higher percentages are needed for smaller fragments [1]. |
| Fluorescent Nucleic Acid Stain | Stains like GelRed/GelGreen are safer alternatives to ethidium bromide. Ensure even mixing with agarose for clear visualization [12]. |
Diagnostic and Experimental Workflows
The following diagrams outline the logical process for diagnosing smear patterns and the key steps in a preventive gel protocol.
Diagnostic Decision Tree for Gel Smearing
This workflow helps you systematically identify the cause of smearing based on its visual characteristics.
Optimized Gel Electrophoresis Workflow
This diagram illustrates a standardized experimental protocol designed to prevent smearing from the outset.
Smeared bands in agarose gel electrophoresis are a common technical hurdle that extends beyond a mere aesthetic issue. These diffuse, blurry bands indicate a failure to properly resolve nucleic acids by size, directly compromising the accuracy of fragment analysis and the success of subsequent experimental steps. This troubleshooting guide addresses the root causes of smearing, provides actionable protocols for its resolution, and details how achieving clear, sharp bands is fundamental to data integrity and the reliability of downstream applications in molecular biology and drug development.
Troubleshooting Guide: Resolving Smeared Bands
The following table outlines the primary causes of smeared bands and their corresponding solutions.
| Problem Area | Possible Cause | Recommended Solution | Impact on Downstream Applications |
|---|---|---|---|
| Sample Preparation | Nucleic Acid Degradation [1] [12] | Use nuclease-free reagents and labware; wear gloves; work in designated, clean areas; avoid repeated freeze-thaw cycles. | Degraded DNA/RNA is unusable for cloning, sequencing, or reverse transcription, leading to failed experiments and inaccurate data. |
| Protein Contamination [1] [25] | Purify the sample via phenol-chloroform extraction or use a spin-column kit; add SDS to the loading dye and heat the sample. | Proteins can block restriction enzyme sites or inhibit PCR, causing incomplete digests or amplification failure. | |
| Sample Overloading [1] [12] | Load 0.1–0.2 μg of DNA per millimeter of gel well width. | Overloading distorts band shape, prevents accurate quantification, and can lead to misidentification of fragments. | |
| Incompatible Loading Buffer [1] | For ssDNA/RNA, use a denaturing loading dye and heat sample. For dsDNA, avoid denaturants. | Improper denaturation causes formation of secondary structures, leading to aberrant migration and incorrect size determination. | |
| Gel & Electrophoresis | Incorrect Gel Percentage [1] [25] | Use an appropriate agarose concentration for your fragment size (see Reagent Solutions table). | A suboptimal gel matrix fails to resolve fragments of similar sizes, complicating analysis and gel extraction. |
| Voltage Too High [12] [26] | Run the gel at 5-8 V/cm; for a standard minigel, this is typically 80-120V. | High voltage causes band smiling, smearing due to heat, and can denature DNA, affecting downstream ligation efficiency. | |
| Gel Over-running [1] [25] | Monitor the migration of the loading dye; do not run smaller fragments off the gel. | Running the gel too long results in loss of small fragments from the gel, making them unavailable for recovery. | |
| Poorly Formed Wells [1] | Use a clean comb; do not push it to the very bottom of the gel tray; remove comb carefully after solidification. | Damaged wells cause sample leakage and uneven migration, leading to cross-contamination between lanes. |
Frequently Asked Questions (FAQs)
1. My DNA ladder is smearing, but my samples look fine. What should I do? A smearing DNA ladder is a clear indicator of a problem. The most common causes are degradation of the ladder or contamination with proteins (e.g., from nucleases). To resolve this, use a fresh aliquot of ladder and ensure you are using DNase-free pipette tips. Do not heat your DNA ladder before loading, as this can cause denaturation and smearing [25].
2. I see smearing only in my PCR product lanes. What is the specific cause? Smearing in PCR products specifically can be caused by non-optimal PCR conditions, such as too much template, too many cycles, or primer-dimer formation. However, the most common causes related to gel analysis are overloading the well with too much PCR product or running the gel at an excessively high voltage [12]. Ensure you are loading an appropriate volume (e.g., 3-5 µL) and running the gel at 110-130V.
3. How does smearing affect my ability to quantify nucleic acids? Smearing directly compromises reliable quantification. Densitometric analysis software measures the intensity of a defined, sharp band to calculate concentration. A smeared band spreads the signal across a larger area, making intensity measurements inaccurate and leading to incorrect conclusions about sample concentration, which can skew the results of downstream reactions like qPCR or NGS library preparation [27].
4. What is the "smile effect" and how is it different from smearing? The "smile effect" (where bands curve upward at the edges) is typically caused by uneven heat distribution across the gel, often from running at too high a voltage or inadequate buffer circulation [28]. Smearing, in contrast, refers to a diffuse, vertical spread of the nucleic acid signal within a single lane. While both are artifacts, they have distinct causes.
Experimental Protocols for Diagnosis and Resolution
Protocol 1: Systematic Check for Sample Degradation
Purpose: To determine if nucleic acid degradation is the root cause of smearing. Materials: Fresh loading dye, fresh electrophoresis buffer, molecular biology grade water, two identical agarose gels. Method:
- Divide your sample: Split the suspect sample into two tubes.
- Treat the first aliquot: Mix the first aliquot with fresh loading dye and load it onto the first gel as usual.
- Treat the second aliquot: On the second gel, load a fresh, undegraded control sample (e.g., a known good DNA ladder or a different, non-degraded sample).
- Run both gels simultaneously under identical, standard conditions (e.g., 1x TAE, 100V, 45 min).
- Analyze: If the suspect sample is smeared but the control sample on the second gel is sharp, the issue is with the sample itself (likely degradation or contamination). If both gels show smearing, the issue is systemic (e.g., with the buffer, gel, or running conditions) [29].
Protocol 2: Optimizing Voltage and Run Time
Purpose: To establish the ideal electrophoresis conditions to prevent heat-induced smearing. Materials: Agarose, running buffer (e.g., 1x TAE or TBE), power supply. Method:
- Prepare a standard 1% agarose gel.
- Load your sample and ladder across multiple lanes.
- Run the gel at different voltages: While a single gel can be run at one voltage, for optimization, run identical gels at different voltages (e.g., 80V, 100V, 120V) for a duration that allows the leading dye to migrate 75-80% of the gel length.
- Compare results: You will typically observe that lower voltages (e.g., 80-100V) yield sharper, better-resolved bands, while higher voltages (e.g., >150V) can cause smearing, band distortion, and the "smile effect" [12] [26]. Select the lowest voltage that provides resolution in a reasonable time.
Troubleshooting Workflow
The following diagram illustrates a logical pathway for diagnosing and resolving the causes of smeared bands.
The Scientist's Toolkit: Research Reagent Solutions
| Item | Function & Rationale | Specification / Notes |
|---|---|---|
| Agarose | Forms the porous matrix that separates nucleic acids by size. | Choose concentration based on fragment size: 0.8-1.0% for 0.5-10 kb, 1.5-2.0% for 0.1-3 kb, 2.0-3.0% for <1 kb [12] [25]. |
| DNA Ladder | Essential molecular weight standard for sizing unknown fragments. | Use a ready-to-use ladder with a defined range that covers your fragments of interest. Do not heat before loading [25]. |
| Running Buffer | Conducts current and maintains stable pH during electrophoresis. | TAE (Tris-Acetate-EDTA): Better for larger fragments (>20 kb), gel extraction. TBE (Tris-Borate-EDTA): Higher buffering capacity, better for smaller fragments (<1 kb) and longer runs [27] [26]. Always use freshly prepared buffer. |
| Nucleic Acid Stain | Visualizes separated DNA/RNA fragments by intercalating or binding. | Ethidium Bromide (EtBr): Traditional, cost-effective; mutagenic. GelRed/GelGreen: Safer alternatives with similar sensitivity. SYBR Gold/SYBR Safe: High sensitivity, safer; SYBR Safe is compatible with blue light transillumination [30] [12]. |
| Loading Dye | Adds density to sink sample into well and provides visual tracking of migration. | Contains dyes (e.g., bromophenol blue, xylene cyanol) that migrate at predictable rates. For ssDNA/RNA, ensure it contains a denaturant (e.g., formamide) [1] [25]. |
Proactive Protocols: Methodological Best Practices to Prevent Smearing
FAQs: Agarose Concentration and Melting
What is the consequence of selecting the wrong agarose concentration? Choosing an incorrect agarose percentage is a primary cause of poorly resolved or smeared bands [1]. A concentration that is too low for your DNA fragment size will provide inadequate sieving, resulting in poor separation between similar-sized fragments. Conversely, a concentration that is too high can hinder the migration of larger fragments, make the gel brittle, and potentially cause band distortion [31] [32].
How do I choose the right agarose percentage for my DNA fragments? The optimal agarose concentration depends entirely on the size range of the DNA fragments you need to resolve. The general guideline is to use lower percentages for larger fragments and higher percentages for smaller fragments [33]. The table below provides a detailed breakdown.
Table 1: Agarose Gel Concentration Guidelines for DNA Separation
| Agarose Percentage (%) | Optimal DNA Fragment Size Range (base pairs) | Typical Application |
|---|---|---|
| 0.7% | 1,000 - 10,000+ | Separation of very large fragments, genomic DNA [32] [34] |
| 1.0% | 500 - 1,000+ | Standard range for general purpose analysis [32] |
| 1.2% | 400 - 7,000 | Broad range separation |
| 1.5% | 200 - 3,000 | Good for PCR products, small fragments [33] |
| 2.0% | 100 - 1,500 | High resolution for small fragments (<500 bp) [32] [33] |
| 2.5% - 3.0% | 50 - 1,000 | Very high resolution for very small fragments; can be brittle [31] |
Why is complete melting of agarose so critical, and what problems does it prevent? Incomplete melting results in an inhomogeneous gel solution with undissolved agarose particles or "micelles." When cast, this creates a gel with non-uniform pore sizes [12]. During electrophoresis, this inconsistency causes DNA bands to smear, appear fuzzy, or migrate in an irregular and unpredictable pattern, severely impacting resolution and interpretation [12].
What is the correct method to ensure agarose is completely melted? The most reliable method is to heat the agarose-buffer mixture in a flask using a microwave oven. After swirling initially, heat in short bursts (30-45 seconds) followed by swirling to dissolve all particles and ensure an even, clear solution without cloudiness [12]. To prevent evaporation, cover the flask loosely with sealing film. Always use protective gloves when handling the hot flask [12].
Troubleshooting Guide: Smeared Bands
Smeared bands are a common issue that can stem from various steps in the gel preparation and running process. The following workflow will help you diagnose and correct the problem.
Diagram: Troubleshooting workflow for smeared bands in agarose gel electrophoresis.
Detailed Explanations of Troubleshooting Steps
Gel Preparation Issues:
- Incorrect Agarose Percentage: Refer to Table 1 to select the correct percentage for your DNA fragment size. Using a 2% gel for large DNA fragments will cause poor migration and smearing, while using a 0.8% gel for small fragments will not resolve them [1] [33].
- Incomplete Melting: Ensure the agarose solution is heated until it is completely clear and without any visible particles. An uneven gel matrix from incomplete melting directly causes fuzzy and smeared bands [12].
Sample Preparation Issues:
- Sample Overloading: Loading more than the recommended 0.1-0.2 μg of DNA per millimeter of well width is a frequent cause of smearing. This leads to over-saturation and trailing in the lane [1].
- Sample Degradation: Nuclease contamination or improper storage can degrade DNA, creating a continuous smear of fragments. Always use molecular biology-grade reagents, nuclease-free labware, and proper protective equipment [1] [35].
Electrophoresis Conditions:
- Voltage Too High: Running the gel at excessively high voltage (e.g., >150V) generates heat that can denature DNA and cause band smearing. For sharper bands, run at a moderate voltage of 110-130V [12] [32].
- Old or Incorrect Running Buffer: Buffers lose their ionic strength over time and through repeated use. Always use freshly prepared TAE or TBE buffer for each run to maintain proper conductivity and buffering capacity [35] [32].
The Scientist's Toolkit: Essential Reagents & Materials
Table 2: Key Research Reagent Solutions for Optimal Gel Electrophoresis
| Reagent/Material | Function/Purpose | Key Considerations |
|---|---|---|
| Agarose | Forms the porous matrix that separates DNA fragments by size. | Select concentration based on target DNA size (see Table 1). High-sieving agarose is available for very small fragments [12] [31]. |
| TAE Buffer (Tris-Acetate-EDTA) | Most common running buffer; provides ions to carry current and maintains stable pH. | Preferred for longer DNA fragments (>1 kb) and preparative gels. Not ideal for very long runs [34]. |
| TBE Buffer (Tris-Borate-EDTA) | Alternative running buffer with higher buffering capacity. | Provides sharper resolution for small DNA fragments (<1 kb) and is suitable for longer run times [34]. |
| DNA Gel Stain (e.g., SYBR Safe, GelRed, Ethidium Bromide) | Intercalates with DNA to allow visualization under specific light sources. | Consider sensitivity, safety (mutagenicity), and compatibility with your visualization system (UV vs. blue light) [12]. |
| DNA Ladder/Marker | Contains DNA fragments of known sizes for estimating sample fragment sizes. | Choose a ladder with bands in the size range of your samples for accurate sizing [34]. |
| Loading Dye | Contains dyes to track migration progress and glycerol to make sample sink in well. | Ensure the dye front does not comigrate with your bands of interest (e.g., Orange G migrates at ~50 bp) [34]. |
Troubleshooting Guides
Issue: Smeared DNA Band on Agarose Gel
- Q: My DNA sample appears as a smear instead of a sharp band. What are the primary causes?
- A: DNA degradation is the most common cause. This can result from RNase/DNase contamination, excessive heat, or mechanical shearing. Improper electrophoresis conditions (e.g., voltage too high, buffer exhaustion) can also contribute.
- Q: How can I confirm the DNA is degraded?
- A: Run the sample on an agarose gel alongside an intact DNA ladder. Degraded DNA will appear as a low molecular weight smear or a missing high molecular weight band.
Issue: Incorrect DNA Concentration
- Q: My spectrophotometer (NanoDrop) gives a high concentration, but the band is faint on the gel. Why?
- A: Spectrophotometers detect all nucleotides, including contaminants like RNA, free nucleotides, or salts. A faint band indicates the actual intact DNA concentration is lower than measured. Use a fluorometric assay (e.g., Qubit) for accurate double-stranded DNA quantification.
- Q: What happens if I load a DNA concentration outside the 0.1–0.2 μg/mm range?
- A:
- Too Low (<0.1 μg/mm): Faint or non-visible bands.
- Too High (>0.2 μg/mm): Overloading causes smearing, distorted bands, and poor resolution.
- A:
FAQs
- Q: What is the most critical step to prevent nuclease degradation?
- A: Always work on ice or at 4°C and use nuclease-free reagents, tubes, and tips. Include EDTA in buffers to chelate Mg²⁺, a cofactor for many nucleases.
- Q: How do I properly store DNA samples to maintain integrity?
- A: Store DNA in TE buffer (pH 8.0) at -20°C or -80°C for long-term storage. Avoid repeated freeze-thaw cycles by aliquoting samples.
- Q: What is the difference between A260/A280 and A260/A230 ratios?
- A: See the table below for a summary of purity metrics.
Data Presentation
Table 1: DNA Quantification and Purity Assessment Methods
| Method | Principle | Ideal Purity Ratios | Best For |
|---|---|---|---|
| UV Spectrophotometry | Absorbance of UV light by nucleotides. | A260/A280: ~1.8 (DNA) A260/A230: 2.0-2.2 | Quick, initial concentration and purity check. |
| Fluorometry | Fluorescence emission from DNA-binding dyes. | N/A | Accurate quantification of intact, double-stranded DNA. |
Table 2: Troubleshooting Smeared Bands and Concentration Issues
| Symptom | Possible Cause | Solution |
|---|---|---|
| Smear throughout the lane | DNA Degradation | Use fresh nuclease-free reagents; add EDTA; work on ice. |
| Bands are fuzzy or poorly resolved | Electrophoresis Voltage Too High | Run gel at 5-8 V/cm; use fresh running buffer. |
| Faint band, good A260/A280 | RNA contamination | Treat sample with RNase A; re-purify. |
| High concentration but faint band | Protein/phenol contamination | Perform a chloroform extraction and ethanol precipitation. |
Experimental Protocols
Protocol 1: Accurate DNA Quantification and Purity Assessment
- Fluorometric Quantification (Recommended):
- Prepare assay working solution as per kit instructions (e.g., Qubit dsDNA HS Assay).
- Prepare standards and mix 1-20 μL of sample with working solution for a 200 μL total volume.
- Incubate for 2 minutes at room temperature, protected from light.
- Measure fluorescence and calculate concentration based on the standard curve.
- Spectrophotometric Purity Check:
- Blank the instrument with the same buffer used to suspend the DNA.
- Apply 1-2 μL of sample and measure absorbance at 230nm, 260nm, and 280nm.
- Record the A260/A280 and A260/A230 ratios to assess contaminant levels.
Protocol 2: DNA Clean-Up via Ethanol Precipitation
- Add 1/10 volume of 3 M Sodium Acetate (pH 5.2) to the DNA sample.
- Add 2-2.5 volumes of ice-cold 100% ethanol.
- Mix thoroughly and incubate at -20°C for 30 minutes to overnight.
- Centrifuge at >12,000 × g for 15 minutes at 4°C to pellet DNA.
- Carefully decant the supernatant and wash the pellet with 500 μL of 70% ethanol.
- Centrifuge again for 5 minutes, remove all supernatant, and air-dry the pellet for 5-10 minutes.
- Resuspend the DNA in an appropriate volume of nuclease-free TE buffer or water.
Mandatory Visualization
Diagram 1: DNA Degradation Pathways
Diagram 2: Optimal Sample Prep Workflow
The Scientist's Toolkit
Table 3: Research Reagent Solutions for DNA Sample Prep
| Reagent/Material | Function |
|---|---|
| Nuclease-free Water | Solvent for resuspending DNA and preparing reagents; free of RNases and DNases. |
| TE Buffer (pH 8.0) | DNA storage buffer; Tris maintains pH, EDTA chelates Mg²⁺ to inhibit nucleases. |
| EDTA (0.5 M, pH 8.0) | A chelating agent used to inactivate metal-dependent nucleases. |
| RNase A | Enzyme used to degrade RNA contaminants in DNA preparations. |
| Qubit dsDNA HS Assay Kit | Fluorometric assay for highly specific and accurate quantification of dsDNA. |
| 3 M Sodium Acetate (pH 5.2) | Salt used in ethanol precipitation to neutralize DNA charge and facilitate precipitation. |
In agarose gel electrophoresis, the choice of running buffer is a critical parameter that directly influences the resolution and quality of nucleic acid separation. The buffer serves multiple essential functions: it conducts electric current, allows nucleic acids to move through the agarose matrix, and maintains stable pH and ion concentration throughout electrophoresis [36]. Two primary buffers dominate molecular biology laboratories: TAE (Tris-Acetate-EDTA) and TBE (Tris-Borate-EDTA). While both contain Tris as a pH buffer and EDTA to chelate metal ions and inhibit nucleases, their different acidic components—acetic acid in TAE versus boric acid in TBE—impart distinct separation characteristics and performance attributes [36] [37].
Understanding the precise role of these buffers is particularly crucial when troubleshooting common experimental problems such as smeared bands, poor resolution, or failed downstream applications. This guide provides a comprehensive framework for selecting the appropriate electrophoresis buffer based on specific experimental needs, with particular emphasis on resolving smeared band artifacts in agarose gel electrophoresis.
Buffer Composition and Properties: A Comparative Analysis
Chemical Composition and Functional Mechanisms
TAE Buffer consists of Tris base, glacial acetic acid, and EDTA. The combination of Tris and acetic acid provides buffering capacity around pH 8.0, which is optimal for DNA stability and migration [36] [37]. The relatively higher conductivity of TAE can lead to increased heat generation during electrophoresis, which may impact DNA migration, especially during extended runs [37].
TBE Buffer comprises Tris base, boric acid, and EDTA. The Tris-borate system buffers at a slightly higher pH (approximately 8.3) and exhibits lower conductivity compared to TAE [37]. This lower conductivity allows for application of higher voltages with reduced heat generation, making TBE more suitable for longer runs or procedures requiring higher resolution [36] [37]. However, the borate ions in TBE can form complexes with various biological molecules and may inhibit downstream enzymatic reactions if carried over during DNA extraction from gels [36].
Table 1: Comparative Analysis of TAE and TBE Buffer Properties
| Property | TAE Buffer | TBE Buffer |
|---|---|---|
| Full Name | Tris-Acetate-EDTA | Tris-Borate-EDTA |
| Components | Tris base, glacial acetic acid, EDTA | Tris base, boric acid, EDTA |
| Typical pH | ~8.0 [37] | ~8.3 [37] |
| Conductivity | Higher [37] | Lower [37] |
| Buffering Capacity | Lower - may deteriorate during long runs [36] [37] | Higher - maintains stable pH over extended periods [36] [37] |
| Heat Generation | Higher under equivalent conditions [37] | Lower, allowing higher voltage applications [37] |
Separation Performance and Resolution Characteristics
The different chemical properties of TAE and TBE directly impact their separation performance for various DNA fragment sizes:
TAE Buffer demonstrates superior separation for larger DNA fragments (typically >2-4 kb) [36]. Its composition creates a environment where larger molecules can navigate through the agarose matrix more effectively, resulting in better resolution for cloning experiments and large fragment analysis. Additionally, TAE is preferred when DNA will be extracted from the gel for downstream applications because it lacks borate, which can inhibit enzymes such as ligases [36].
TBE Buffer provides excellent resolution for smaller DNA fragments (<2 kb) [36]. The borate ions in TBE interact with the sugar-phosphate backbone of DNA, creating a sieving effect that enhances separation of similarly sized small fragments. This makes TBE ideal for analyzing polymerase chain reaction (PCR) products, restriction fragments, and other small nucleic acid species where high resolution is critical.
Table 2: Buffer Selection Guide Based on Experimental Requirements
| Experimental Goal | Recommended Buffer | Rationale |
|---|---|---|
| Large DNA fragments (>2-4 kb) | TAE [36] | Better separation and migration of large molecules |
| Small DNA fragments (<2 kb) | TBE [36] | Superior resolution and sharper bands for small fragments |
| DNA extraction for cloning | TAE [36] | No borate to inhibit downstream enzymes (ligases, etc.) |
| Long electrophoresis runs (>4 hours) | TBE [36] | Higher buffering capacity maintains stable pH |
| High-voltage electrophoresis | TBE [37] | Lower conductivity reduces heat generation |
| DNA extraction from gel | TAE [36] | More efficient DNA recovery from agarose |
Troubleshooting Guide: Addressing Smeared Bands Through Buffer Optimization
FAQ: Buffer-Related Experimental Issues
Q1: Why do I consistently observe smeared bands in my agarose gels, and how can buffer choice help resolve this?
Smeared bands can result from multiple factors, but inappropriate buffer selection often contributes significantly to this problem. For small DNA fragments (<2 kb), TAE buffer may provide insufficient resolution, leading to diffusion and smearing [36]. Conversely, for large DNA fragments (>4 kb), TBE might cause poor separation and smearing. Solution: Match your buffer to your fragment size—use TBE for small fragments and TAE for large fragments [36]. Additionally, ensure you're using fresh buffer at the correct concentration, as exhausted buffer can cause smearing due to pH instability and reduced buffering capacity [1].
Q2: How does buffer choice affect my downstream applications like cloning or sequencing?
TBE buffer contains borate ions that can co-purify with DNA extracted from gels and inhibit enzymatic reactions in downstream applications [36]. This inhibition can significantly reduce ligation efficiency in cloning experiments and affect sequencing reactions. TAE buffer does not present this problem and is therefore strongly recommended when you plan to extract DNA from the gel for subsequent enzymatic manipulations [36].
Q3: My DNA bands appear fuzzy and poorly resolved after extended electrophoresis runs. Could my buffer be the cause?
Yes. TAE buffer has lower buffering capacity compared to TBE and may deteriorate during long electrophoresis runs, leading to pH shifts and poor band resolution [36] [37]. For runs exceeding 2-4 hours, TBE is generally preferred due to its superior ability to maintain stable pH throughout the electrophoresis process [36]. If you must use TAE for long runs, consider replacing the buffer in the electrophoresis chamber or using a higher concentration (2X) to maintain buffering capacity [37].
Q4: I'm seeing unusual migration patterns and band distortion. Could this be buffer-related?
Unusual migration patterns can indeed result from buffer issues. Using different buffers in the gel and the electrophoresis chamber can cause irregular migration [38]. Always use the same batch of buffer for both gel preparation and the running chamber. Additionally, ensure your buffer is at the correct concentration and pH, as deviations can alter conductivity and cause band distortion [1].
Comprehensive Troubleshooting Framework for Smeared Bands
Diagram 1: Troubleshooting workflow for identifying and resolving smeared bands in agarose gel electrophoresis, highlighting buffer-related solutions.
Smeared bands represent one of the most common challenges in agarose gel electrophoresis. While buffer selection is crucial, a systematic approach to troubleshooting should consider multiple potential causes:
Sample-Related Issues:
- DNA Degradation: Nuclease contamination or improper storage can cause DNA degradation and smearing. Use nuclease-free reagents and equipment, and include EDTA in your buffer to inhibit nuclease activity [36] [1].
- Sample Overloading: Loading too much DNA (typically >0.5 μg per mm of well width) can overwhelm the separation capacity of the gel, causing trailing and smearing [1] [38]. Reduce the amount of DNA loaded, particularly for concentrated samples.
- Protein Contamination: Proteins bound to DNA can alter migration patterns and cause smearing. Purify DNA samples or use loading dyes containing SDS to dissociate proteins [1].
Electrophoresis Conditions:
- Inappropriate Voltage: Excessively high voltage can cause overheating and DNA denaturation, leading to smearing. Apply 1-5 V/cm between electrodes for optimal resolution [38]. Lower voltages generally provide better resolution for larger fragments.
- Extended Run Times: Prolonged electrophoresis can cause band diffusion and smearing. Monitor the migration of tracking dyes and stop the run before smaller fragments exit the gel [1] [38].
The Scientist's Toolkit: Essential Reagents for Optimal Electrophoresis
Table 3: Research Reagent Solutions for Agarose Gel Electrophoresis
| Reagent/Material | Function/Purpose | Optimization Tips |
|---|---|---|
| TAE Buffer | Separation of large DNA fragments (>2 kb); DNA extraction for downstream enzymatic applications [36] | Prepare fresh or use concentrated stocks; replace if pH changes noticeably |
| TBE Buffer | High-resolution separation of small DNA fragments (<2 kb); extended electrophoresis runs [36] | Avoid for DNA extraction for cloning; borate inhibits enzymes [36] |
| Agarose | Matrix for size-based separation of nucleic acids [39] | Choose concentration based on fragment size: 0.7-1% for large fragments, 1.5-2% for small fragments [39] |
| DNA Ladder | Molecular weight standard for size estimation [38] | Use appropriate ladder for expected fragment sizes; avoid overloading [38] |
| Loading Dye | Provides density for loading wells; contains tracking dyes to monitor migration [38] | Includes glycerol or Ficoll; may contain xylene cyanol and bromophenol blue as tracking dyes [38] |
| Ethidium Bromide/Safe Dyes | DNA intercalation and visualization under UV light [40] | Optimize concentration for sensitivity; follow safety protocols for mutagenic dyes |
Experimental Protocol: Buffer Selection and Optimization Workflow
Diagram 2: Experimental workflow for optimal buffer selection and electrophoresis conditions to prevent smeared bands.
Step-by-Step Buffer Preparation and Gel Casting
Buffer Selection Decision Point: Based on your experimental goals (refer to Table 2), select either TAE or TBE buffer. For general purpose applications with mixed fragment sizes, TAE often serves as a satisfactory compromise [36].
Buffer Preparation:
- TAE Buffer (50X Stock): Combine 242 g Tris base, 57.1 mL glacial acetic acid, and 100 mL of 0.5 M EDTA (pH 8.0). Adjust final volume to 1 L with distilled water. Dilute to 1X for use [36].
- TBE Buffer (10X Stock): Combine 108 g Tris base, 55 g boric acid, and 40 mL of 0.5 M EDTA (pH 8.0). Adjust final volume to 1 L with distilled water. Dilute to 1X for use [36].
- Always confirm the pH of diluted working solutions (pH 8.0 for TAE, pH 8.3 for TBE) before use.
Agarose Gel Preparation:
- Select agarose concentration based on your target DNA fragment sizes (refer to Tables 2 and 3 in Section 4).
- Mix agarose powder with the appropriate 1X buffer (TAE or TBE) in a heat-resistant flask.
- Heat the mixture until the agarose is completely dissolved, using a microwave or hot plate, swirling periodically to ensure even heating.
- Cool the agarose solution to approximately 50-60°C before pouring into the gel casting tray with well comb inserted.
- Allow the gel to solidify completely (typically 20-30 minutes at room temperature) before removing the comb.
Electrophoresis Execution:
- Place the solidified gel in the electrophoresis chamber and cover with the same type and concentration of buffer used to cast the gel.
- Load DNA samples mixed with appropriate loading dye into the wells.
- Connect the power supply, ensuring correct polarity (DNA migrates toward the anode/positive electrode).
- Run at optimal voltage (1-5 V/cm distance between electrodes) [38].
- Monitor migration using tracking dyes (bromophenol blue migrates at approximately 300 bp in TAE; xylene cyanol at approximately 4 kb in TAE).
- Stop electrophoresis when fragments have adequately separated.
Visualization and Analysis:
- Stain the gel with an appropriate DNA intercalating dye (ethidium bromide, SYBR Safe, etc.).
- Visualize using UV transillumination or appropriate light source.
- Document results and analyze band patterns. If smearing is observed, consult the troubleshooting workflow in Diagram 1.
The strategic selection between TAE and TBE buffers represents a fundamental decision point in designing successful agarose gel electrophoresis experiments. TAE excels with larger DNA fragments and downstream enzymatic applications, while TBE provides superior resolution for smaller fragments and extended runs. By understanding the distinct properties and optimal applications of each buffer system, researchers can significantly improve electrophoresis results, minimize common artifacts like smeared bands, and ensure the success of subsequent molecular biology applications. The systematic approach outlined in this guide—incorporating appropriate buffer selection, optimized experimental conditions, and comprehensive troubleshooting strategies—provides a robust framework for achieving consistent, high-quality DNA separation in diverse research contexts.
Quantitative Guidelines for Optimal Sample Loading
The following table summarizes key quantitative data to guide precise sample preparation and loading, helping to prevent smearing and other artifacts [1] [41].
| Parameter | Recommended Optimal Range | Notes & Consequences |
|---|---|---|
| DNA Mass per Band | ≥20 ng (EtBr/SYBR Safe)≥1 ng (SYBR Gold) | Too little DNA results in faint bands; too much causes smearing, slower migration, and inaccurate sizing [41]. |
| Total DNA per Well Width | 0.1 – 0.2 μg per millimeter | Overloading wells is a common cause of trailing smears, warped (U-shaped), or fused bands [1]. |
| Sample Volume in Well | Fill at least 30% of the well volume | Prevents band distortion by ensuring the sample sinks properly into the well [1]. |
| General Template Guidelines (PCR) | 1–100 ng genomic DNA≤5 ng plasmid/lambda DNA | Using too much template is a frequent cause of smearing and high background [42] [43]. |
Experimental Protocols for Precision Loading and Well Integrity
Gel Casting for Perfect Wells
A properly cast gel is the foundation for undamaged wells and clean sample loading [1].
- Protocol:
- Clean Combs: Ensure the gel comb is clean and free of residual agarose from previous casts [1].
- Correct Placement: When setting a horizontal gel, do not push the comb all the way to the bottom of the gel tray. A small space prevents sample leakage and subsequent smearing [1].
- Avoid Overfilling: Do not overfill the gel tray, as this can lead to connected wells [1].
- Solidification Time: Allow sufficient time for the gel to solidify completely before removing the comb. Rushing can tear the wells [1] [44].
- Careful Comb Removal: Remove the comb steadily and carefully to prevent damage to the well walls and bottom [1].
Sample Loading Technique to Avoid Well Damage
The physical act of loading the sample can easily damage fragile wells.
- Protocol:
- Steady Hands: Use a pipette with a steady hand to avoid touching the tip to the sides or bottom of the well, which can scratch or puncture the gel [1].
- Proper Positioning: Place the tip of the pipette just above the well, in the buffer. Do not insert the tip deep into the well [44].
- Slow Dispensing: Expel the sample slowly and steadily. Watch as the dense sample, weighted by the loading dye, sinks into the well [44].
- Avoid Bubbles: Ensure no air bubbles are trapped in the tip and released into the well, as they can displace the sample and distort bands [1].
Sample Preparation for Clean Results
The composition of your loaded sample is as critical as the loading technique.
- Protocol:
- Check Sample Purity: If the sample contains high amounts of protein or is in a high-salt buffer, it can cause smearing. Purify the sample or precipitate and resuspend it in nuclease-free water to remove contaminants [1].
- Use Correct Loading Dye: Ensure the loading buffer is appropriate for your nucleic acid. For double-stranded DNA, use a non-denaturing dye. For RNA or single-stranded DNA, use a denaturing loading dye and heat the sample to prevent secondary structures [1].
- Mind the Dye Front: Be aware that the tracking dyes in the loading buffer co-migrate with specific nucleic acid sizes (e.g., Orange G ~50 bp, Bromophenol Blue ~100-500 bp, Xylene Cyanol ~4,000 bp). Avoid using a dye that migrates at the same size as your band of interest, as it can mask your result [41].
Precision Loading Troubleshooting Workflow
Frequently Asked Questions (FAQs)
Q1: I did not damage the wells during loading, but my bands are still smeared. What else could it be? Smearing can have multiple causes beyond well damage. First, confirm you have not overloaded the sample by checking the quantitative guidelines above. If the problem persists, the issue may be sample degradation. Ensure you use nuclease-free reagents and labware and follow good practices like wearing gloves. Alternatively, suboptimal electrophoresis conditions, such as running the gel at a very high voltage or for too long, can generate excessive heat and cause band diffusion [1].
Q2: My negative control in a PCR experiment shows a smear. What does this indicate? If your negative (no-template) control shows a smear, it strongly indicates contamination of your PCR reagents with foreign DNA. You must determine the contamination source, which may require replacing all PCR reagents and decontaminating pipettes and your workstation [45].
Q3: I see a "smiling effect" where bands in the center lanes curve upward. Is this related to loading? The "smiling effect," where bands in center lanes migrate faster than those on the sides, is typically not caused by loading technique but by uneven heating across the gel, often from using too high a voltage. To fix this, run the gel at a lower voltage. The effect can also be caused by an uneven electric field due to loose contacts in the electrophoresis tank [41].
Q4: My band is faint, not smeared. Could this still be a loading issue? Yes, faint bands are often a result of loading an insufficient quantity of DNA into the well. Refer to the quantitative guidelines for the minimum amount needed for your stain. Other causes include low sensitivity of the stain, incorrect light source for visualization, or complete degradation of the DNA sample [1].
Research Reagent Solutions
The following table details essential materials and their functions for achieving precision in gel electrophoresis [1] [41] [44].
| Reagent/Material | Function & Importance |
|---|---|
| TAE or TBE Buffer | Provides the necessary ions to conduct current. Using water or incorrect buffer concentration will cause the gel to melt or run poorly [44] [20]. |
| Appropriate DNA Ladder | A chromatography-purified ladder with bands in your size range of interest is essential for accurately determining the size of your DNA fragments [41]. |
| Optimal Agarose Percentage | Higher percentages (e.g., 2%) resolve smaller DNA fragments, while lower percentages (e.g., 0.7%) resolve larger fragments. Using the wrong percentage leads to poor separation [44] [20]. |
| High-Quality DNA Stain | Stains like EtBr, SYBR Safe, or SYBR Gold intercalate with DNA for visualization under UV light. Their sensitivities vary, affecting how much DNA you need to load [41]. |
| Correct Loading Dye | Contains a dense agent (e.g., glycerol) to make the sample sink into the well and tracking dyes to monitor migration progress. The dye type must be compatible with your nucleic acid (denaturing vs. non-denaturing) [1] [41]. |
A guide to resolving smeared bands and achieving publication-quality gel images.
Fuzzy, smeared bands ruining your agarose gel? This common issue often stems from incorrect voltage and run time settings. This guide provides targeted troubleshooting and protocols to help you achieve crisp, publication-ready results.
Why Do My Bands Look Smeared?
Band smearing occurs when DNA fragments do not resolve into sharp, distinct bands. Instead, they appear as diffuse, blurry trails [12]. The table below outlines the primary causes related to electrophoresis conditions and sample preparation.
| Primary Cause | Underlying Reason | Impact on Band Morphology |
|---|---|---|
| Applied Voltage Too High | Generates excessive heat, denaturing DNA and causing band diffusion [12]. | Fuzzy, smeared bands down the lane. |
| Insufficient or Excessive Run Time | Short runs prevent separation; long runs cause band diffusion and excessive heat [1]. | Poorly resolved, diffuse, or overlapping bands. |
| Sample Overloading | >500 ng of DNA in a single well can overwhelm the gel's sieving capacity [12]. | "Smiling" or U-shaped, warped bands [1]. |
| Sample Degradation | Nuclease activity or mechanical shearing fragments the DNA [1]. | Continuous smear from the well downward. |
| High Salt Concentration | High ionic strength in sample buffer disrupts uniform electric field [12] [1]. | Skewed or wavy band migration. |
Optimizing Voltage and Run Time
Voltage and run time are interlinked parameters that directly control resolution. The following workflow provides a systematic approach to optimization.
Adhering to the recommended voltage of 110-130V is critical [12]. High voltage (>150V) generates excessive heat within the gel, which can denature DNA double strands and cause band diffusion and smearing [12]. Always use fresh running buffer, as its ionic strength maintains a stable current and prevents overheating [12].
Troubleshooting Other Common Issues
Beyond voltage, other factors can compromise band clarity. This section addresses frequent problems and their solutions.
Faint or No Bands
| Problem | Possible Cause | Solution |
|---|---|---|
| No bands, marker visible | PCR amplification failed; nucleic acid extraction failed or concentration too low [12]. | Optimize PCR conditions; check extraction protocol and use a fluorometer for quantification. |
| No bands, marker not visible | Loading dye not added or degraded; electrodes reversed [12] [1]. | Always include loading dye; ensure gel wells are on the cathode (negative, black) side. |
| Faint bands from large fragments | Large DNA fragments bind fluorescent stain less efficiently [12]. | Increase stain concentration; reduce loading volume to minimize dye migration [12]. |
Poor Band Separation
Inadequate spacing between bands is often a function of gel concentration and run time.
| DNA Fragment Size | Recommended Agarose % | Key Considerations |
|---|---|---|
| > 1000 bp | 0.8% - 1.0% | Standard range for optimal separation [46] [47]. |
| 500 - 1000 bp | 1.0% - 1.5% | Increases resolution for medium-sized fragments. |
| < 500 bp | 1.5% - 2.5% or High Sieving Agarose | Higher percentage creates a denser matrix for separating small fragments [12] [1]. |
- For poorly formed wells: Ensure combs are clean, do not push them to the very bottom of the gel tray, and remove them carefully after the gel is fully set [1].
- For sample overloading: A general recommendation is to load 0.1–0.2 μg of DNA per millimeter of the gel well's width [1].
Advanced Protocol: Concentrating Dilute DNA Samples
The SUccessive Reloading Electrophoresis (SURE) method allows you to concentrate a large volume of a dilute DNA sample into a single, sharp band by reloading the same well multiple times [46]. This is ideal for visualizing or purifying DNA from dilute PCR reactions.
SURE Gel Electrophoresis Protocol [46]
- Prepare Gel: Cast a standard 0.8% agarose gel in 1X TAE buffer.
- Load and Pulse:
- Load your maximum well volume (e.g., 25-35 µL) of sample mixed with loading dye.
- Connect the power supply and apply a brief pulse of 84 V (6 V/cm) for 20-40 seconds.
- Turn off the power and disconnect the leads.
- Reload and Repeat:
- Carefully load another identical volume of the same sample into the same well.
- Apply the same voltage and time pulse.
- Repeat this cycle 6-20 times, depending on your total sample volume.
- Complete the Run: After the final reload and pulse, continue electrophoresis at a standard constant voltage (e.g., 110-130 V) until the tracking dye has migrated sufficiently.
The Scientist's Toolkit: Essential Reagents & Materials
The table below lists key reagents for successful nucleic acid electrophoresis.
| Item | Function & Key Characteristics |
|---|---|
| Agarose LE | Standard grade agarose for routine nucleic acid electrophoresis [46]. |
| High Sieving Agarose | Specifically designed for high resolution of small DNA fragments (20-800 bp), comparable to polyacrylamide [12]. |
| DNA Stains (e.g., GelRed/GelGreen) | Fluorescent dyes that intercalate into DNA for visualization. Safer alternatives to ethidium bromide (EB). GelGreen is compatible with blue-light transilluminators [12]. |
| DNA Ladders/Markers | Size standards for estimating sample fragment length. Select a ladder with a range covering your fragments of interest (e.g., 100 bp, 1 kb) [12]. |
| TAE or TBE Buffer | Running buffers that provide ions to carry current and maintain stable pH. TBE offers higher buffering capacity for longer runs [46]. |
| Loading Dye | Contains a dense agent (e.g., glycerol, Ficoll) for sample sedimentation and tracking dyes to monitor migration progress [46]. |
Frequently Asked Questions
What is the number one fix for a smeared band in my agarose gel? The most common fix is to reduce the applied voltage to the 110-130 V range and ensure you are not overloading the well with more than 0.1-0.2 μg of DNA per millimeter of well width [12] [1].
My bands are still smeared after optimizing voltage. What should I check next? Thoroughly check for nuclease contamination in your samples or buffers. Always wear gloves, use nuclease-free tips and tubes, and work in a dedicated clean area, especially when handling RNA [1].
Can the type of loading dye I use cause smearing? Yes. Using a loading dye containing a denaturant (like SDS) is recommended for single-stranded nucleic acids (e.g., RNA) to prevent secondary structure formation. Conversely, for double-stranded DNA, avoid denaturants and do not heat the sample after adding the dye to preserve the duplex structure [1].
How can I visualize very faint bands from a dilute DNA sample? Beyond increasing stain concentration, you can use the SURE electrophoresis protocol detailed above to concentrate a large volume of a dilute sample into a single, detectable band [46].
Systematic Troubleshooting: A Step-by-Step Diagnostic and Optimization Framework
FAQ: How do sample-related issues cause smeared bands in agarose gel electrophoresis?
Smeared, fuzzy, or diffused bands on your agarose gel are a common frustration that can often be traced back to problems with the sample itself before it's even loaded. The three primary sample-related culprits are sample degradation, overloading, and high salt content. Identifying the correct cause is the first step to a clear, interpretable result [1].
1. What does sample degradation look like and what causes it? Degraded DNA or RNA samples appear as a continuous smear running down the lane, often with a lack of distinct, sharp bands [48]. This occurs when nucleases (DNases or RNases) break the nucleic acids into random fragments.
- Causes: The primary cause is nuclease contamination from non-sterile reagents, labware, or improper technique [1].
- Solutions:
2. How does sample overloading lead to smearing? Overloading a well with too much DNA can cause a thick, intense smear, often with U-shaped or warped bands that appear fused together [1].
- Causes: Loading more than the well's capacity can handle.
- Solutions:
3. Why does high salt content in my sample cause smearing? A high salt concentration in the sample buffer can distort the electric field around the well, leading to band distortion and smearing as the sample enters the gel [1].
- Causes: Using elution buffers with high salt concentrations or failing to properly desalt samples after purification.
- Solutions:
Experimental Protocols for Diagnosis and Resolution
Protocol 1: Assessing and Mitigating Sample Degradation
This protocol outlines steps to check for and prevent nuclease degradation.
- Visual Inspection: Run a small aliquot of your sample on a gel alongside a known intact control (e.g., a non-degraded DNA ladder). A smear in your sample lane but not the control lane indicates degradation.
- Proper Resuspension: After precipitation, do not overdry the nucleic acid pellet, as this makes it difficult to resuspend and can lead to clumping. Briefly air-dry the tube open on the bench for a few minutes. Resuspend in the desired buffer using a large volume to accelerate resuspension [49].
- DNase/RNase Inactivation: For RNA or sensitive DNA samples, consider adding RNase or DNase inhibitors to your storage buffer.
- Equipment Check: If degradation is sporadic, test your sample tubes by aliquoting a control sample into different tubes. Occasional tubes may contain residual contaminants or nucleases [49].
Protocol 2: Correcting for Sample Overloading or High Salt
This procedure helps concentrate dilute samples or reduce salt content without overloading the well.
- Ethanol Precipitation:
- Add 1/10 volume of 3 M sodium acetate (pH 5.2) and 2-2.5 volumes of cold 100% ethanol to your sample.
- Incubate at -20°C for 30 minutes or overnight.
- Centrifuge at high speed (≥12,000 g) for 15 minutes to pellet the DNA.
- Wash the pellet with 70-80% cold ethanol to remove residual salt [49].
- Centrifuge again, carefully aspirate the ethanol, and air-dry the pellet.
- Resuspend in a smaller volume of nuclease-free water or low-salt TE buffer [1].
- Alternative to Precipitation: For a quick salt reduction, simply dilute your sample in nuclease-free water before mixing it with the loading dye [1].
Data Presentation: Agarose Concentration Guidelines
Selecting the correct agarose concentration is critical for optimal separation. The table below summarizes the appropriate gel percentages for resolving different DNA fragment sizes [48].
| Agarose Concentration (%) | Optimal DNA Size Resolution (base pairs) |
|---|---|
| 0.5 | 1,000 – 25,000 |
| 0.75 | 800 – 12,000 |
| 1.0 | 500 – 10,000 |
| 1.2 | 400 – 7,500 |
| 1.5 | 200 – 3,000 |
| 2.0 | 50 – 1,500 |
Research Reagent Solutions
The following table lists key reagents essential for preventing sample-related smearing.
| Reagent/Item | Function in Preventing Sample-Related Smearing |
|---|---|
| Molecular Biology Grade Water | Provides a nuclease-free environment for resuspending samples and diluting buffers, preventing degradation [1]. |
| Nuclease-Free Microcentrifuge Tubes | Prevents sample degradation from DNase/RNase contamination present on low-quality tube surfaces [49]. |
| Appropriate Loading Dye | Adds density for even sinking into the well; some contain SDS to dissociate proteins from DNA, reducing smearing [1] [46]. |
| Ethanol (70-80%) | Used in pellet washing steps to effectively remove excess salt from precipitated nucleic acids without dissolving the pellet [49]. |
| TE Buffer (pH 8.0) | A low-salt, slightly basic buffer for storing and resuspending DNA, which minimizes degradation and avoids salt-induced smearing [46]. |
Troubleshooting Workflow for Sample-Related Smearing
The following diagram outlines a logical, step-by-step process to diagnose and address smearing caused by sample issues.
Frequently Asked Questions
Q1: How does gel concentration affect band separation? The concentration of agarose in a gel determines the size of the pores in the matrix, which directly controls the range of DNA fragment sizes that can be effectively separated. Using an incorrect percentage is a common cause of poorly resolved or poorly separated bands [1].
Q2: What are the consequences of poorly formed wells? Poorly formed wells can lead to sample leakage, cross-contamination between lanes, and irregular, smeared, or distorted bands. Damaged wells may cause bands to bulge or bend instead of migrating in a straight line [1] [50].
Q3: Why is complete gel setting important? Allowing the gel to set completely is crucial for achieving a uniform matrix. If the comb is removed too early or the gel is run before it is fully solidified, the wells can deform, and the gel's structure may be weak, leading to distorted migration and poor resolution [50].
Troubleshooting Guide: Data and Protocols
Agarose Gel Concentration Guidelines
Selecting the correct agarose concentration is critical for resolving DNA fragments of different sizes. The table below summarizes appropriate percentages for various fragment ranges [44] [51].
| Agarose Percentage (% w/v) | Effective Separation Range (bp) |
|---|---|
| 0.7% | 1,000 - 20,000 |
| 1.0% | 500 - 10,000 |
| 1.2% | 400 - 7,000 |
| 1.5% | 200 - 3,000 |
| 2.0% | 100 - 2,000 |
Protocol: Casting a Gel with Well-Formed Wells
A detailed methodology to prevent common well-forming issues [1] [44] [51].
- Cool Agarose Adequately: After microwaving, let the molten agarose cool to approximately 50-65°C before pouring. Pouring it while too hot can warp the gel tray [51].
- Proper Comb Placement: Ensure the comb is clean and positioned so that it does not touch the bottom of the gel tray. A small space should remain to prevent the well from having a very thin base that can break easily and cause sample leakage [1].
- Allow Complete Solidification: Let the gel solidify at room temperature for 20-30 minutes, or until it is completely set and cool to the touch. It should appear slightly cloudy. For faster setting, it can be placed at 4°C for 10-15 minutes [44] [50].
- Careful Comb Removal: Once set, remove the comb steadily and carefully in a straight upward motion to avoid tearing the wells [1].
Protocol: Verifying Complete Gel Polymerization
To ensure your gel has set correctly before running an experiment [50].
- Visual Inspection: The gel should be firm and uniformly opaque (cloudy) with no liquid areas.
- Tactile Check: The surface should feel solid and cool to the touch, especially on the bottom of the tray.
- Well Inspection: After removing the comb, check that the wells have smooth, defined walls and flat bottoms without any tears or connections to adjacent wells.
Troubleshooting Workflow for Gel Preparation Issues
The following diagram outlines the logical process for diagnosing and resolving the gel-related problems discussed in this guide.
Research Reagent Solutions
Essential materials and their functions for successful gel preparation and analysis.
| Reagent/Equipment | Primary Function |
|---|---|
| Agarose | A polysaccharide derived from seaweed that forms a porous gel matrix to separate DNA fragments by size [51]. |
| TAE or TBE Buffer | Provides the ions necessary to conduct current and maintains a stable pH during electrophoresis [44]. |
| Gel Comb | Creates wells in the solidified agarose for loading DNA samples [1]. |
| DNA Ladder | A mixture of DNA fragments of known sizes, run alongside samples to estimate the size of unknown DNA fragments [44]. |
| Loading Dye | Contains dyes to track migration progress and glycerol to increase sample density, ensuring it sinks to the bottom of the well [51]. |
| Ethidium Bromide (EtBr) | A fluorescent dye that intercalates with DNA, allowing visualization of bands under UV light. Note: EtBr is a suspected mutagen and must be handled with appropriate safety precautions [51]. |
Troubleshooting FAQs
1. How does high voltage cause smeared bands and how can I fix it? Excessive voltage generates significant heat within the gel, which can denature DNA fragments and cause band smearing due to uneven migration [1] [12]. This often appears as a "smiling" effect where samples in center lanes migrate faster than those in peripheral lanes [34].
- Solution: Run the gel at a lower voltage. The recommended range is typically 1–5 volts per centimeter of distance between electrodes [51] [52]. For a standard mini-gel, this often translates to 80–130 V [53] [54]. Lower voltage for a longer duration allows for better heat dissipation and sharper bands [44].
2. What are the consequences of an incorrect run time?
- Run time too short: Insufficient separation leads to poorly resolved or stacked bands, which can be mistaken for smearing [1] [52].
- Run time too long: Excessive run time can cause smaller DNA fragments to migrate off the gel entirely. It can also generate heat, leading to band diffusion and smearing [1].
- Solution: Monitor the migration of the loading dye. A common practice is to stop the run when the dye front has migrated two-thirds to three-quarters of the way down the gel [55] [44].
3. How does the running buffer affect band resolution? Using the wrong buffer type, a buffer with incorrect pH, or a buffer with low ionic strength can all contribute to poor resolution and smearing [1] [12].
- Solution:
- Always use freshly prepared running buffer [12].
- Ensure the same buffer is used for both gel preparation and the running tank (e.g., do not use TAE-made gel in TBE buffer) [52].
- Choose the appropriate buffer for your application [34]:
- TAE (Tris-Acetate-EDTA): Better for longer DNA fragments (>1 kb) and is compatible with downstream enzymatic reactions.
- TBE (Tris-Borate-EDTA): Provides sharper resolution for smaller DNA fragments and has higher buffering capacity, making it suitable for longer runs.
For easy reference, the following table summarizes the optimal conditions for critical electrophoresis parameters to prevent smearing.
| Parameter | Common Pitfalls | Optimal Conditions & Solutions |
|---|---|---|
| Voltage | High voltage (>150 V) causes overheating and smearing [12]. | Apply 1-5 V/cm (e.g., 80-130 V for mini-gel) [51] [53]. Run at lower voltage for longer for better resolution [44]. |
| Run Time | Too short: poor separation [1].Too long: DNA runs off gel or bands diffuse [1]. | Stop when the loading dye has migrated ~75% down the gel [55] [44]. |
| Running Buffer | Wrong buffer type, low buffering capacity, or using old/broken-down buffer [1] [12]. | Use fresh TAE (for long fragments) or TBE (for small fragments) [34]. Ensure buffer covers gel by 3-5 mm [34]. |
| Agarose Concentration | Incorrect pore size prevents effective size-based separation [1]. | Use the correct gel percentage for your DNA's size range (see table below) [55] [52]. |
Agarose Gel Concentration Guide
Selecting the correct agarose concentration is crucial for resolving DNA fragments of different sizes and preventing poorly separated or smeared bands [1].
| % Agarose (w/v) | Optimal DNA Separation Range (base pairs) |
|---|---|
| 0.5% | 1,000 – 25,000 [55] [52] |
| 0.7% | 800 – 12,000 [55] |
| 1.0% | 500 – 10,000 [55] [52] |
| 1.2% | 400 – 7,500 [55] |
| 1.5% | 200 – 3,000 [55] [52] |
| 2.0% | 50 – 1,500 [55] [52] |
Experimental Protocol: Optimizing Electrophoresis Conditions
This protocol provides a standardized method for running an agarose gel with conditions designed to minimize smearing.
Materials:
- Electrophoresis-grade agarose
- 1x TAE or TBE running buffer
- DNA samples and appropriate DNA ladder
- 6x DNA loading dye
- Gel casting tray, comb, and electrophoresis chamber
- Power supply
- Microwave or hot plate
Methodology:
- Prepare Agarose Gel: Based on the expected size of your DNA fragments, select an appropriate agarose percentage from the table above. Dissolve the agarose powder in 1x running buffer by heating until the solution is completely clear [51] [44]. Cool the solution to approximately 50-55°C before pouring [55] [44].
- Cast the Gel: Place a comb onto the casting tray and pour the molten agarose. Allow the gel to solidify completely at room temperature for 20-30 minutes [55].
- Set Up Gel Box: Once solidified, remove the comb and place the gel into the electrophoresis chamber. Fill the chamber with 1x running buffer until the gel is fully submerged [44].
- Prepare and Load Samples: Mix DNA samples with 6x loading dye to a final 1x concentration [54]. Load the recommended amount of DNA ladder and your samples into the wells. Avoid overloading wells, as this is a primary cause of smearing [1].
- Execute Electrophoresis:
- Visualize: Image the gel using a UV or blue-light transilluminator.
Troubleshooting smeared bands by evaluating electrophoresis conditions.
Research Reagent Solutions
The following reagents are essential for successful agarose gel electrophoresis.
| Reagent | Function | Key Considerations |
|---|---|---|
| Agarose | Forms the porous gel matrix that separates DNA by size. | Concentration determines resolution range; use low % for large DNA, high % for small DNA [55]. |
| TAE Buffer | Common running buffer (Tris-Acetate-EDTA). | Ideal for longer fragments (>1 kb) and downstream enzymatic applications [34]. |
| TBE Buffer | Common running buffer (Tris-Borate-EDTA). | Provides sharper resolution for small fragments and has higher buffering capacity for long runs [34]. |
| DNA Loading Dye | Contains dyes for tracking migration and glycerol for sample density. | Ensures sample sinks into well; dye migration indicates progress [51]. Avoid dyes that mask your fragment size [1]. |
| DNA Ladder | Contains DNA fragments of known sizes for molecular weight comparison. | Essential for determining the size of unknown samples; use a ladder appropriate for your expected fragment size [34]. |
Frequently Asked Questions
What causes band diffusion or smearing in my agarose gel? Band diffusion and smearing are commonly caused by issues with sample integrity, gel conditions, or electrophoresis parameters. The most frequent causes are [56] [1] [2]:
- Sample degradation from nuclease activity
- Overloading the gel wells with too much DNA
- Running the gel at an excessively high voltage
- Using an incorrect gel concentration for your DNA fragment size
- DNA degradation during sample preparation or storage
Why are my bands faint or invisible after staining? Faint bands typically indicate problems with staining efficiency, sample concentration, or visualization methods [1] [57]:
- Insufficient DNA quantity loaded per well (below detection limit)
- Inefficient staining due to incorrect dye concentration, short staining time, or cold temperatures
- Stain degradation, especially if added to molten agarose when using heat-sensitive dyes like GelRed
- Incorrect light source or filter during visualization that doesn't match your dye's excitation/emission spectrum
How does the choice of nucleic acid dye affect band appearance? Different dyes have distinct chemical properties that impact migration and visualization [4] [57]:
- High-affinity dyes like GelRed and GelGreen are larger molecules that can alter DNA migration, especially in precast gels
- Ethidium bromide alternatives may require protocol adjustments for optimal results
- Dye concentration and staining method (pre-cast vs. post-staining) significantly impact band sharpness and background
Can electrophoresis conditions cause smiling or frowning bands? Yes, "smiling" or "frowning" bands (curved migration patterns) are typically caused by uneven heat distribution across the gel [2]. This occurs most often at high voltages where the center of the gel becomes hotter than the edges, causing differential migration rates. Reducing voltage and using fresh buffer usually resolves this issue.
Troubleshooting Guide
Troubleshooting Band Diffusion and Smearing
| Problem Category | Specific Issue | Solution |
|---|---|---|
| Sample Quality | DNA/RNA degradation [1] [2] | Use fresh nuclease-free reagents; wear gloves; work in clean areas |
| High salt concentration in sample [1] | Dilute sample in nuclease-free water; desalt or precipitate/resuspend | |
| High protein content [1] | Purify sample; use loading dye with SDS and heat before loading | |
| Gel Conditions | Incorrect gel percentage [12] [2] | Use lower % agarose for large DNA, higher % for small fragments |
| Thick gels (>5mm) [1] | Cast gels 3-4mm thick to prevent diffusion | |
| Poorly formed wells [1] | Use clean combs; don't push comb to bottom; allow proper solidification | |
| Electrophoresis | Excessive voltage [12] [2] | Reduce voltage (recommended: 110-130V); run longer at lower voltage |
| Incorrect run time [1] | Optimize run time - too short causes poor resolution, too long causes diffusion | |
| Incompatible buffer [1] | Use appropriate, freshly prepared running buffer | |
| Staining Method | Dye interference with migration [4] | Use post-staining protocol instead of pre-cast staining |
| Uneven stain distribution [12] | Mix stain thoroughly in agarose; consider post-staining method |
Troubleshooting Faint Bands and Stain-Related Problems
| Problem Category | Specific Issue | Solution |
|---|---|---|
| Sample & Loading | Insufficient DNA quantity [1] | Load 0.1-0.2 μg DNA per mm of well width; use deep, narrow wells |
| Sample degradation [1] | Check DNA quality; re-isolate if necessary; ensure proper storage | |
| Loading dye masking bands [1] | Check dye migration size; ensure sufficient sample volume | |
| Staining Protocol | Low stain sensitivity [1] | Increase stain concentration or staining duration; optimize for gel thickness |
| Heat-degraded stain [57] | Add stain to cooled agarose (50-60°C); use post-staining method | |
| Uneven staining [1] | For in-gel: mix stain thoroughly; For post-staining: ensure full submersion with shaking | |
| Slow dye diffusion [57] | Warm staining solution to 30-37°C for thicker gels or cold environments | |
| Visualization | Incorrect light source [1] | Match light source to dye's excitation wavelength (UV vs. blue light) |
| High background [1] | Destain gel; use stains with low intrinsic fluorescence | |
| Signal saturation [27] | Reduce exposure time; use camera's dynamic range indicator |
Experimental Protocols
Post-Staining Protocol for Optimal Band Sharpness
Post-staining is recommended for high-resolution results, especially with dyes like GelRed [4] [57]:
Run your gel without dye in the gel or running buffer using standard TAE or TBE buffer [57].
Prepare staining solution:
Stain the gel:
Visualize using appropriate light source and filters for your dye.
Optimized Gel Casting for Sharp Bands
Choose appropriate agarose concentration [12] [4]:
- 0.8-1.0% for standard DNA fragments (500-5000 bp)
- 1.5-2.0% for small DNA fragments (<500 bp)
- 0.5-0.7% for large DNA fragments (>5000 bp)
Prevent well damage [1]:
- Use clean, undamaged combs
- Allow complete gel solidification before comb removal
- Remove comb steadily and carefully
Avoid overheating stains [57]:
- Cool molten agarose to 50-60°C before adding sensitive dyes
- Wait until flask is comfortable to touch before adding stain
Electrophoresis Conditions for Optimal Resolution
Voltage and run time [12] [2]:
- Standard runs: 110-130V for sharp bands
- For better separation: lower voltage for longer duration
- Avoid voltages >150V to prevent smearing
-
- Use fresh running buffer for each run, especially for small gels
- For runs longer than 2 hours, use buffer with high buffering capacity (e.g., TBE)
- Ensure consistent buffer levels across the gel tank
Troubleshooting Band Diffusion and Stain Problems
Research Reagent Solutions
| Reagent Category | Specific Products | Function & Application Notes |
|---|---|---|
| Nucleic Acid Stains | Ethidium bromide [12] | Traditional intercalating dye; cost-effective but mutagenic; UV excitation (300-360 nm) |
| GelRed, GelGreen [12] [4] | Safer alternatives; higher molecular weight affects migration; post-staining recommended | |
| SYBR Gold [30] | High sensitivity; excitation at 495 nm (blue light) or 300 nm (UV) | |
| GoldView [12] | Acridine orange-based; stains DNA and RNA different colors; fades quickly under UV | |
| Agarose Types | Standard agarose [12] | Routine nucleic acid electrophoresis (0.5-2.0% concentrations) |
| High sieving agarose [12] | Separates small fragments (20-800 bp); comparable to polyacrylamide | |
| Pre-stained agarose [58] | Ready-to-use cassettes with embedded safe dyes; instant deployment | |
| Running Buffers | TAE (Tris-Acetate-EDTA) [56] [4] | Standard buffer; replace frequently, especially for small gels |
| TBE (Tris-Borate-EDTA) [4] | Higher buffering capacity; better for long runs (>2 hours) | |
| Molecular Weight Markers | 100 bp DNA Ladder [12] | 100-1500 bp range (12 bands); ideal for standard PCR products |
| 1 kb DNA Ladder [12] | 250-12000 bp range (13 bands); suitable for larger fragments | |
| Full-range DNA Ladder [12] | 100-12000 bp range (20 bands); comprehensive size reference |
Troubleshooting Guides
FAQ 1: What causes smeared bands in my agarose gel and how can I fix it?
Smeared bands have a blurry, diffused appearance and are a common issue that hinders accurate analysis. The causes and solutions are multifaceted [1].
Solution:
- Sample-Related Issues: Avoid sample overloading; the general recommendation is to load 0.1–0.2 μg of DNA per millimeter of gel well width [1]. Ensure your sample is not degraded by using nuclease-free reagents and labware, and always wear gloves [1]. If the sample is in a high-salt buffer, dilute, purify, or precipitate it to remove excess salt before loading [1].
- Gel-Related Issues: Keep gel thickness around 3–4 mm when casting horizontal gels [1]. Ensure wells are properly formed by using a clean comb, not pushing it to the very bottom of the gel tray, and allowing sufficient time for the gel to solidify before removing the comb carefully [1].
- Run Condition Issues: Apply voltage as recommended for the nucleic acid size and running buffer. Very low or high voltage can create suboptimal resolution [1]. Run the gel long enough for sufficient resolution, but avoid very long runs that generate excessive heat and cause diffusion [1].
FAQ 2: Why are my DNA bands faint or missing?
Faint, fuzzy bands indicate low signal, which can result from problems at various stages of the process [1].
Solution:
- Insufficient Sample Quantity: Load a minimum of 0.1–0.2 μg of DNA per millimeter of gel well width. For sensitive stains like SYBR Gold, at least 1 ng of DNA per band is recommended [1] [34].
- Sample Degradation: Follow good laboratory practices to prevent nuclease contamination [1].
- Gel Over-run or Incorrect Staining: Monitor run time to prevent small fragments from running off the gel. Check the sensitivity of your stain and allow longer staining periods for thick or high-percentage gels [1].
- Incorrect Electrophoresis Setup: Ensure the electrodes are connected correctly; the gel wells should be on the side of the negative electrode (cathode) [1].
FAQ 3: My DNA ladder is smearing or not separating correctly. What should I do?
A well-resolved DNA ladder is crucial for accurate sizing, and issues often point to problems with the ladder itself or the run conditions [59].
Solution:
- Ladder Degradation or Contamination: Handle the DNA ladder carefully and use DNase-free filter pipette tips to avoid contamination. Do not heat the DNA ladder before loading [59].
- Excessive Ladder Loaded: Load the manufacturer's recommended amount, typically 3-5 μL (around 0.5 μg) for a standard ladder. Overloading causes smearing [59].
- Inadequate Running Conditions: Use an appropriate agarose concentration for the expected fragment sizes (see Table 1) and apply a power supply of 1-5 V/cm between electrodes [59].
FAQ 4: How can I achieve better separation of similarly sized DNA fragments?
Poorly separated, closely stacked bands result from an inability to resolve fragments of similar sizes [1].
Solution:
- Optimize Gel Percentage: Use a higher percentage agarose gel to better resolve smaller fragments [1] [44].
- Avoid Sample Overloading: Do not exceed the recommended sample load of 0.1–0.2 μg of DNA per millimeter of well width [1].
- Choose the Correct Buffer: TBE buffer often gives better resolution and sharper bands for fragments smaller than 1 kb, while TAE is preferred for longer fragments [60].
- Adjust Run Conditions: Run the gel at a lower voltage for a longer period to improve resolution and band crispness [44].
Experimental Protocols
Detailed Methodology for High-Resolution Agarose Gel Electrophoresis
Equipment & Reagents:
- Agarose (molecular biology grade)
- Electrophoresis buffer (TAE or TBE)
- DNA stain (e.g., Ethidium Bromide, SYBR Safe)
- Gel tray, comb, and electrophoresis tank
- Power supply
- DNA molecular weight ladder
Procedure:
- Gel Preparation: Prepare enough 1x electrophoresis buffer for both the gel and the tank [60]. Add an appropriate mass of agarose to the buffer to achieve the desired concentration (see Table 1). Heat the mixture in a microwave until the agarose is completely dissolved, swirling occasionally to avoid superheating. If significant evaporation occurs, replenish with distilled water to maintain the correct agarose percentage and buffer ionic strength [60]. Cool the agarose to 55–60°C [60]. Pour the gel onto a tray with a comb in place to a thickness of 3–5 mm [1] [60]. Allow the gel to set completely (30-40 minutes) [60].
Sample Preparation: Mix your DNA samples with a 6X gel loading dye. The loading dye increases sample density for sinking into wells and provides a visible dye front to track migration [51] [61]. A typical recipe includes 0.25% bromophenol blue, 0.25% xylene cyanol FF, and 40% sucrose or glycerol [60]. Ensure samples are free of high salt or ethanol, which can retard migration or cause samples to float [60].
Gel Electrophoresis: Place the solidified gel in the electrophoresis tank and submerge it completely in the same 1x running buffer used to prepare the gel [60]. The buffer should cover the gel with a depth of about 1 mm of liquid above its surface [60]. Carefully load the DNA ladder and samples into the wells. Avoid puncturing the wells with the pipette tip [1]. Connect the electrodes correctly (DNA migrates to the positive anode, so "Always Run to Red") [44]. Run the gel at 1-10 V/cm (measured as the distance between electrodes) until the dye has migrated an appropriate distance [60]. Avoid very high voltages, which can cause overheating and smearing [60].
Visualization: After electrophoresis, visualize the DNA bands using an appropriate light source. If using a fluorescent stain like Ethidium Bromide, expose the gel to UV light and capture an image with a gel documentation system [51]. For EtBr, wear personal protective equipment as it is a known mutagen [51].
Workflow for Troubleshooting Smeared Bands
The following diagram illustrates a logical workflow for diagnosing and resolving the common issue of smeared bands in agarose gels, based on the troubleshooting guides.
Research Reagent Solutions
The following table details key reagents and materials essential for achieving high-resolution separation in agarose gel electrophoresis.
| Item | Function & Optimal Use | Key Considerations |
|---|---|---|
| Agarose | Forms the gel matrix that separates DNA by size [51]. Concentration must match target DNA size (see Table 1). | Use ultrapure quality to avoid impurities that affect migration [60]. |
| Electrophoresis Buffer (TAE/TBE) | Conducts current and maintains stable pH [61]. TAE is better for longer fragments (>1 kb); TBE offers sharper resolution for smaller fragments (<1 kb) [34] [60]. | TBE has higher buffering capacity for long runs; TAE is preferred if DNA will be extracted from the gel [60]. |
| DNA Stain | Allows visualization of separated DNA bands. | Ethidium Bromide is sensitive and cost-effective but is a mutagen [51]. SYBR Safe/Gold are safer, more sensitive alternatives [34] [51]. |
| Loading Dye | Adds density to sink sample into wells; provides visible dye fronts to track migration [51] [61]. Contains dyes like bromophenol blue and xylene cyanol [60]. | Choose a dye whose migration does not mask your DNA fragments of interest [1] [34]. |
| DNA Ladder | Provides a standard for estimating the size of unknown DNA fragments. | Use a ready-to-use ladder for convenience. Ensure it covers the expected size range and is not degraded or overloaded [34] [59]. |
Table 1: Agarose Concentration Guidelines for DNA Separation [60]
| Agarose Concentration (% w/v) | Optimal DNA Fragment Separation Range (kb) |
|---|---|
| 0.5% | 1.0 – 30.0 |
| 0.7% | 0.8 – 12.0 |
| 1.0% | 0.5 – 10.0 |
| 1.2% | 0.4 – 7.0 |
| 1.5% | 0.2 – 3.0 |
| 2.0% | 0.1 – 1.5 |
Validation and Advanced Techniques: Ensuring Accuracy and Exploring Alternatives
This technical support guide provides troubleshooting advice for using DNA ladders and controls to ensure accurate sizing and interpretation of your agarose gel results, specifically within the context of resolving smeared bands.
DNA Ladder Troubleshooting FAQs
Q1: Why is my DNA ladder smearing?
Smeared DNA ladder bands compromise sizing accuracy. Common causes and solutions are below [62]:
| Possible Cause | Specific Signs | Recommended Solution |
|---|---|---|
| Ladder Degradation | Thin band with a short smeared tail [62] | Use fresh ladder; employ DNase-free pipette tips with filters [62]. |
| Excessive Loading | Wide band with a strong smeared tail [62] | Load manufacturer's recommended volume (e.g., 3-5 μL, ~0.5 μg) [62]. |
| Protein Contamination | Wider, brighter band with a strong smear; may run as high molecular weight [62] | Use a fresh ladder; purify DNA sample if contaminated [62]. |
| High Voltage/Heat | General smearing across lanes [12] | Run gel at 110-130V; use adequate buffer volume to dissipate heat [12]. |
Q2: Why is my DNA ladder faint or missing?
Faint or missing ladders prevent accurate molecular weight determination.
- Faint Bands: This typically indicates an insufficient amount of DNA loaded onto the gel. Solution: Increase the volume of ladder loaded, ensuring it is within the manufacturer's recommended range [62].
- Missing Ladder:
- Not Loaded: Confirm you loaded the ladder by checking for dye in the designated well [62].
- Complete Degradation: Use a fresh aliquot of ladder and ensure nuclease-free practices [62].
- Run Off the Gel: The electrophoresis time was too long, and fragments have migrated off the gel. Solution: Reduce the run time and monitor dye migration [62].
Q3: Why is my DNA ladder not separating properly, showing compressed bands?
Poor separation prevents resolution of individual ladder fragments.
- Incorrect Agarose Concentration: Using a gel percentage inappropriate for the ladder's size range is a common error. See Table 1 for guidance [62].
- Inadequate Electrical Conditions: Very low voltage can lead to poor separation. Solution: Apply 1-5 V/cm between electrodes [62].
- Denatured Ladder: Heating the DNA ladder before loading or running the gel at a high temperature can denature the fragments. Solution: Do not heat the ladder; keep electrophoresis temperature below 30°C [62].
Experimental Protocol for Accurate Gel Analysis
Follow this detailed protocol to obtain reliable results and prevent smearing.
Materials
- Agarose: Standard molecular biology grade [12].
- Running Buffer: 1x TAE or TBE [63].
- DNA Ladder: Ready-to-use ladder containing loading dye (e.g., Blue, Purple, Orange G) [62].
- DNA Stain: Fluorescent stain like SYBR Safe, GelRed, or Ethidium Bromide [12] [63].
- Gel Documentation System: UV or blue light transilluminator with a camera and appropriate emission filters [27].
Procedure
- Prepare Agarose Gel
- Select the appropriate agarose concentration based on your target DNA fragment size (see Table 1).
- Combine agarose powder with running buffer (e.g., 1x TAE) in a flask. Heat in a microwave until the agarose is completely dissolved and the solution is clear [12] [63].
- Cool the agarose solution to 40-50°C before adding the nucleic acid stain, then mix thoroughly to ensure even distribution [12].
- Pour the gel into a tray with a well comb and allow it to solidify completely (~15-20 minutes) [63].
Prepare Loading Samples
Load and Run the Gel
- Place the solidified gel in an electrophoresis chamber filled with fresh running buffer, just enough to cover the gel surface [63].
- Load your DNA ladder and samples into the wells.
- Connect the electrodes correctly (DNA migrates to the positive anode). Run the gel at 100-150V until the loading dye has migrated an adequate distance [63]. Avoid excessive voltage (>150V) to prevent smearing [12].
Visualize and Document
The Scientist's Toolkit: Essential Research Reagents
The following reagents are critical for successful and interpretable agarose gel electrophoresis.
| Item | Function | Key Considerations |
|---|---|---|
| DNA Ladder | Provides molecular weight standards for sizing unknown DNA fragments. | Choose a ladder with a size range that covers your fragments of interest. Ready-to-use formulations simplify loading [62]. |
| Agarose | Forms a porous matrix that separates DNA fragments by size. | Concentration determines resolution range (see Table 1). High-sieving agarose is better for small fragments (<800 bp) [12]. |
| Nucleic Acid Stain | Binds to DNA, allowing visualization under specific light. | Common options: Ethidium Bromide (toxic), SYBR Safe, GelRed/GelGreen (safer alternatives). Match excitation source to dye [12]. |
| Running Buffer (TAE/TBE) | Carries electrical current and maintains stable pH during electrophoresis. | Always use a fresh batch. Reused buffer can have altered pH and poor buffering capacity, leading to smearing [12] [1]. |
| Loading Dye | Adds density for well loading, provides colored tracking, and approximates migration. | Contains reagents like SDS to dissociate proteins and prevent smearing [1]. |
Table 1: Agarose Concentration and DNA Size Resolution [62]
| Agarose Concentration (%) | Effective Range of Separation (bp) |
|---|---|
| 0.5 | 1,000 - 25,000 |
| 0.75 | 800 - 12,000 |
| 1.0 | 500 - 10,000 |
| 1.2 | 400 - 7,500 |
| 1.5 | 200 - 3,000 |
| 2.0 | 50 - 1,500 |
DNA Ladder Troubleshooting Workflow
The diagram below outlines a logical pathway to diagnose and resolve common DNA ladder issues.
By systematically validating your results with well-functioning DNA ladders and controls, you can confidently size your samples and troubleshoot the root causes of smearing in your agarose gel research.
Smeared or poorly resolved bands in agarose gel electrophoresis are a common frustration that can compromise experimental data. Often, this issue is not a simple protocol error but a fundamental mismatch between the gel matrix and the experimental goal. This technical guide provides a structured framework to help researchers diagnose this problem and make an informed decision on when to switch from agarose to polyacrylamide gel electrophoresis (PAGE) to achieve high-resolution separation, particularly for small nucleic acid fragments and proteins.
Gel Selection Guide: A Side-by-Side Comparison
The choice between agarose and polyacrylamide is the most critical factor in determining the resolution of your separation. The table below summarizes their core characteristics.
Table 1: Key Characteristics of Agarose and Polyacrylamide Gels
| Feature | Agarose Gel | Polyacrylamide Gel (PAGE) |
|---|---|---|
| Chemical Composition | Natural polysaccharide from seaweed [64] | Synthetic polymer of acrylamide and bis-acrylamide [64] |
| Pore Size | Large, non-uniform pores [64] | Small, uniform, and tunable pores [64] |
| Optimal Separation Range | DNA: 100 bp to 25 kbp and beyond [64] [65] | Proteins: Wide range (via SDS-PAGE) [64]. Nucleic Acids: < 1 kbp, down to single-base differences [64] [66] |
| Typical Applications | Checking PCR products, plasmid DNA digestion, genotyping [64] | Protein analysis (SDS-PAGE, Western blot), small nucleic acid analysis (sequencing, SNP detection) [64] [65] |
| Resolution | Lower, suitable for larger molecules [64] | High resolution for smaller molecules [64] [66] |
| Ease of Preparation | Simple; dissolved in buffer and poured [64] [66] | Complex; requires chemical polymerization [64] [66] |
| Toxicity | Non-toxic [64] | Unpolymerized acrylamide monomer is a neurotoxin [64] [66] |
The following decision workflow can help you select the appropriate gel type based on your sample and requirements.
Troubleshooting Guide: FAQs for Agarose and Polyacrylamide Gels
Agarose Gel Electrophoresis FAQs
Q: My DNA bands are smeared and blurry. What should I do?
- A: Smeared bands in agarose gels can have several causes and solutions [22] [1]:
- Run the gel at a lower voltage: High voltage causes overheating, leading to band smearing. Run the gel at 50-75V to maintain a cooler temperature and sharper bands [22].
- Check for sample degradation: Ensure your reagents are nuclease-free and use good laboratory practices (e.g., wearing gloves) to prevent DNA degradation [1].
- Avoid overloading the well: Do not load more than 0.1–0.2 μg of DNA per millimeter of well width. Overloading is a common cause of smearing [1].
- Use fresh running buffer: Always use a freshly diluted buffer for the gel and the run. Do not reuse buffer from previous runs [22].
Q: My bands are faint or invisible. How can I fix this?
- A: Faint bands typically indicate issues with sample quantity, integrity, or visualization [1]:
- Increase sample amount: Ensure you are loading a sufficient quantity of DNA/RNA (0.1–0.2 μg/mm well width) [1].
- Verify sample integrity: Degraded nucleic acids will not form clear bands. Check sample quality and preparation methods [1].
- Check the stain sensitivity: Use a fresh, high-sensitivity fluorescent stain. For thick or high-percentage gels, allow a longer staining period for the dye to penetrate [1].
Q: The bands are not well separated. What is the issue?
- A: Poor separation often relates to gel concentration or running conditions [1] [67]:
- Optimize gel concentration: Use a lower agarose percentage (e.g., 0.8%) for large DNA fragments and a higher percentage (e.g., 2.0%) for smaller fragments [67].
- Run the gel longer: Insufficient run time may not allow for proper separation. Monitor the dye front and extend the run if needed [1].
- Choose the right buffer: TBE buffer provides greater resolution for smaller DNA fragments than TAE [22].
Polyacrylamide Gel Electrophoresis (PAGE) FAQs
Q: I see smeared bands in my SDS-PAGE gel. How do I resolve this?
- A: Band smearing in PAGE is often linked to improper running conditions or sample preparation [68] [69]:
- Reduce the voltage: Running the gel at too high a voltage is a primary cause of smearing. Decrease the voltage by 25-50% and run for a longer duration [68] [69].
- Avoid overloading: Reduce the amount of protein loaded on the gel [68].
- Ensure proper sample preparation: Check that the salt concentration in your sample is not too high. If necessary, dialyze the sample or precipitate the protein to remove excess salt [68].
Q: The protein bands are poorly resolved and blurry. What is the cause?
- A: Poor resolution in PAGE can be addressed by optimizing the gel and run [68]:
- Adjust the gel concentration: The acrylamide percentage might not be optimal for your target protein size. Use a gradient gel (e.g., 4%-20%) or a gel with a different %T for better resolution [68].
- Prolong the electrophoresis run: Insufficient running time can lead to poor separation. Ensure the gel is run long enough for proteins to resolve properly [68].
- Check the running buffer: Improperly prepared running buffer with incorrect ion concentration can disrupt current flow and resolution. Remake the buffer according to protocol [69].
Q: My protein samples ran off the gel. What went wrong?
- A: This occurs when the gel is run for too long [69]. Stop the electrophoresis when the dye front is nearing the bottom of the gel. For high molecular weight proteins, a longer run may be needed, but the progress should be monitored carefully to prevent smaller proteins from running off [69].
Experimental Protocols for High-Resolution Gel Electrophoresis
Protocol: High-Resolution Agarose Gel for Small Fragments
This protocol is optimized for separating small DNA fragments (100-500 bp) where agarose is still appropriate.
Gel Preparation:
- Use a high-percentage agarose gel, typically 2-3% in 1X TBE buffer [22] [67]. TBE provides greater buffering capacity and resolution for small fragments compared to TAE [22].
- Add a fluorescent nucleic acid stain (e.g., SYBR Safe, GelRed) directly to the molten agarose before casting or stain after the run.
- Cast a gel with a thickness of 3-4 mm to prevent band diffusion [1].
Sample Preparation:
- Mix DNA sample with 6X loading dye containing a density agent (e.g., glycerol) to help the sample sink into the well.
- Load a maximum of 0.1–0.2 μg of DNA per millimeter of well width to prevent overloading [1].
Electrophoresis Run:
- Submerge the gel in 1X TBE running buffer in the electrophoresis tank.
- Run the gel at a constant, low voltage of 50-75V to prevent overheating and smearing [22]. Running in a cold room can further improve results.
Visualization:
- Image the gel using a UV transilluminator or blue light system with the appropriate filters for the stain used.
Protocol: Denaturing Polyacrylamide Gel Electrophoresis for Nucleic Acids
This protocol is for separating very small nucleic acids (<100 bp) or for achieving single-base-pair resolution.
Gel Preparation (Handling unpolymerized acrylamide requires gloves and other PPE):
- Prepare a polyacrylamide gel solution. For example, an 8% gel is common for sequencing. The percentage can be adjusted based on the target fragment size.
- Add catalysts, Ammonium Persulfate (APS) and TEMED, to initiate polymerization. Pour the solution between two glass plates and insert a comb to form wells.
- For denaturing conditions, use a gel containing Urea (e.g., 7-8 M).
Sample Preparation:
- Mix the nucleic acid sample with a formamide-based loading dye.
- Heat the samples at 95°C for 2-5 minutes before loading to denature secondary structures, then place immediately on ice.
Electrophoresis Run:
- Use a vertical electrophoresis system.
- Pre-run the gel to reach the desired temperature.
- Flush wells with running buffer to remove residual urea and acrylamide before loading samples [1].
- Run the gel at a constant power or voltage as recommended. Using a lower voltage for a longer time often provides superior resolution.
Visualization:
- After electrophoresis, the gel is typically stained with a fluorescent dye (e.g., SYBR Gold) and visualized.
The Scientist's Toolkit: Essential Reagents and Materials
Table 2: Key Research Reagent Solutions for Gel Electrophoresis
| Reagent/Material | Function | Key Considerations |
|---|---|---|
| Agarose | Forms the porous matrix for nucleic acid separation. | Choose the grade and concentration appropriate for the fragment size to be resolved [67]. |
| Acrylamide/Bis-Acrylamide | Monomer and crosslinker for forming polyacrylamide gels. | Neurotoxin in monomer form. Always wear appropriate PPE when handling. The ratio determines pore size [64] [68]. |
| TBE Buffer (Tris-Borate-EDTA) | Running buffer for nucleic acid electrophoresis. | Superior resolution for small DNA fragments and longer runs due to high buffering capacity [22] [67]. |
| TAE Buffer (Tris-Acetate-EDTA) | Running buffer for nucleic acid electrophoresis. | Preferred for larger DNA fragments and if DNA is to be used in downstream enzymatic applications [22]. |
| SDS (Sodium Dodecyl Sulfate) | Anionic detergent used in SDS-PAGE. | Denatures proteins and confers a uniform negative charge, allowing separation by size alone [64] [10]. |
| Loading Dye | Mixed with samples prior to loading. | Contains a density agent (e.g., glycerol) to sink the sample and tracking dyes to monitor migration [1] [10]. |
| APS & TEMED | Polymerization catalysts for polyacrylamide gels. | Initiate and accelerate the cross-linking reaction of acrylamide and bis-acrylamide [68]. |
Your Troubleshooting Guide: Resolving Smeared Bands in Agarose Gels
Smeared bands on an agarose gel can obscure critical results and delay research progress. This guide addresses the specific product choices and experimental techniques that can help you achieve sharp, publication-ready images by systematically eliminating the common causes of smearing.
Diagnostic Flowchart: Troubleshooting Smeared Bands
The diagram below outlines a systematic approach to diagnose the cause of smearing in your agarose gels.
Troubleshooting Guides & FAQs
This section provides direct answers to the specific experimental issues you might encounter.
Why are my DNA bands smeared or fuzzy?
Smearing typically falls into one of three categories: issues with the gel itself, problems with the sample, or suboptimal electrophoresis conditions [12] [2].
Gel-Related Issues:
- Incorrect Agarose Concentration: A gel percentage that is too low for the size of your DNA fragments will not provide adequate sieving, leading to poor resolution and smearing [1] [2]. Refer to the table in Section 2 for appropriate concentrations.
- Incomplete Melting or Setting: Incompletely melted agarose or insufficient gel setting time creates an uneven matrix with varying pore sizes, causing irregular migration and smearing [12].
Sample-Related Issues:
- Sample Overloading: Loading more than 500 ng of DNA per lane can overwhelm the gel's capacity, resulting in smeared, "smiling," or warped bands [12] [1].
- Sample Degradation: Degradation of DNA by nucleases produces a mixture of fragment sizes, which appears as a continuous smear down the lane [1] [2]. This is a primary cause of smearing in restriction enzyme digests [70].
- High Salt Concentration: Samples containing high salt concentrations can alter the local conductivity in the well, leading to band distortion and smearing [12] [2].
- Protein Contamination: Proteins, especially DNA-binding proteins from enzymatic reactions, can contaminate the sample, altering its migration and causing smearing [71] [70].
Electrophoresis Conditions:
- Voltage Too High: Running the gel at an excessively high voltage (e.g., >150V) generates significant heat, which can denature DNA fragments and cause smearing [12] [2]. A voltage of 110-130V is often recommended [12].
- Old or Incorrect Buffer: Reusing running buffer or using a buffer with incorrect ionic strength or pH can compromise resolution and lead to smearing [1] [22].
Staining Issues:
- Dye Interference with Migration: When using high-affinity stains like GelRed or GelGreen in the gel (pre-casting), overloading DNA can cause the dye to interfere with migration, leading to smearing and aberrant band patterns [72].
My DNA ladder is smeared, but my samples look fine. What went wrong?
A smeared ladder indicates a problem with the ladder itself or how it was handled [71].
- Cause: The ladder may be degraded, often due to nuclease contamination from non-sterile tips or improper storage. Alternatively, loading too much ladder can also cause smearing [71].
- Solution: Always use filter tips when handling DNA ladders and aliquots. Load the recommended volume (typically 3-5 μL, or ~0.5 μg). If problems persist, use a fresh aliquot or a new stock [71].
Why are my bands faint and smeary?
Faint smearing often points to a combination of low quantity and degradation or other issues.
- Low Quantity: If the amount of DNA is too low, bands will be faint and may appear smeared if there is also minor degradation [1].
- Degradation: Partially degraded DNA will appear as a faint smear.
- Incorrect Stain: Using an insensitive stain, or one that has precipitated out of solution (e.g., due to cold storage), will result in faint or no bands [1] [72].
Research Reagent Solutions
Selecting the right reagents is fundamental to preventing smearing and achieving clear results.
Table 1: Guide to Agarose Concentration and DNA Fragment Separation
| Agarose Concentration (%) | Optimal DNA Size Separation Range (bp) |
|---|---|
| 0.5% | 1,000 – 25,000 [71] |
| 0.75% | 800 – 12,000 [71] |
| 1.0% | 500 – 10,000 [71] |
| 1.2% | 400 – 7,500 [71] |
| 1.5% | 200 – 3,000 [71] |
| 2.0% | 50 – 1,500 [71] |
Table 2: Essential Reagents for Optimal Agarose Gel Electrophoresis
| Reagent Category | Key Product Considerations | Function & Solution to Smearing |
|---|---|---|
| Agarose | Standard Agarose: For routine analysis of DNA fragments [12].High Sieving Agarose: Superior for resolving small fragments (20-800 bp), comparable to polyacrylamide gels [12]. | Forms the porous matrix that separates DNA by size. Choosing the correct concentration (see Table 1) is critical for resolution. |
| Nucleic Acid Stains | Ethidium Bromide (EB): Traditional, sensitive, but mutagenic [12].GelRed/GelGreen: Safer alternatives with high sensitivity; note that these larger dyes can affect migration if DNA is overloaded [12] [72].SYBR Safe: Another safe alternative compatible with blue-light transilluminators. | Binds to DNA for visualization. To avoid dye-induced smearing, use post-staining or reduce DNA load when using pre-cast gels with GelRed/GelGreen [72]. |
| DNA Ladders | Size-Appropriate Ladders: Use ladders with bands spanning the size of your target fragments (e.g., 100 bp ladder, 1 kb ladder) [12].Ready-to-Use: Pre-mixed with loading dye for convenience and consistency [71]. | Provides a reference for determining the size of unknown DNA fragments. A clean, sharp ladder is the control for a successful run. |
| Running Buffers | TAE (Tris-Acetate-EDTA): Better for larger DNA fragments and gel extraction for downstream applications [22].TBE (Tris-Borate-EDTA): Higher buffering capacity, better for resolving small fragments (<1 kb) and longer runs [22] [72]. | Conducts current and maintains stable pH. Always use freshly prepared, diluted buffer for sharp bands [22]. |
Experimental Protocols
Following optimized, detailed protocols is key to reproducibility and clear data.
Protocol 1: Standard Agarose Gel Electrophoresis (with In-Gel Staining)
This is a standard protocol for quick analytical gels.
- Gel Preparation:
- Choose an agarose concentration based on your expected DNA fragment sizes (refer to Table 1).
- Add the correct amount of agarose to a flask with the appropriate volume of fresh, diluted running buffer (TAE or TBE). Do not fill the flask more than 50% capacity to prevent boiling over [12].
- Heat the mixture in a microwave until the agarose is completely dissolved and the solution is clear. Swirl intermittently. Cover with loose sealing film to reduce evaporation [12].
- Casting the Gel:
- Cool the molten agarose to 50-60°C before adding stain. Adding stain when the gel is too hot can damage the dye [12].
- If using in-gel staining, add the nucleic acid stain (e.g., GelRed) and mix thoroughly to ensure even distribution [12] [72].
- Pour the gel into a casting tray with a well comb in place. Allow it to solidify completely at room temperature.
- Sample and Load:
- Electrophoresis:
- Place the gel in an electrophoresis tank filled with fresh running buffer, ensuring the gel is submerged.
- Connect the electrodes correctly (DNA migrates to the anode/red).
- Run the gel at a constant voltage of 5-8 V/cm (e.g., 50-100V for a standard mini-gel) [22]. High voltage causes smearing, so "do not rush an agarose gel" [22].
- Visualization:
- Once the dye front has migrated sufficiently, visualize the gel under the appropriate UV or blue-light transilluminator.
Protocol 2: Post-Staining Method for Superior Resolution
This method is highly recommended to eliminate any interference of the dye with DNA migration, a common cause of smearing with dyes like GelRed and GelGreen [72].
- Prepare and Run the Gel:
- Prepare and run the agarose gel as described in Protocol 1, but DO NOT add any stain to the molten agarose.
- Use fresh running buffer for the electrophoresis run.
- Staining:
- After electrophoresis, carefully transfer the gel to a small container.
- Submerge the gel in a staining solution containing the nucleic acid dye (e.g., a dilution of GelRed or GelGreen in water or buffer).
- Gently agitate for 15-30 minutes. For thick gels, a longer staining time may be required for the dye to penetrate fully [1] [72].
- Destaining (Optional):
- For some stains, transferring the gel to clean water for a brief destaining period (5-15 minutes) can reduce background fluorescence.
- Visualize: Proceed with visualization as usual. Post-staining ensures the dye does not affect the electrophoretic mobility of the DNA, resulting in sharper bands [72].
Protocol 3: Troubleshooting a Smeared DNA Ladder
If your DNA ladder is smeared, follow this quick protocol to diagnose and resolve the issue [71].
- Assess Degradation: Check the expiration date of the ladder. Use a fresh aliquot and always handle with DNase-free, filter tips.
- Check Load Volume: Confirm you are not loading more than the manufacturer's recommendation (typically 3-5 μL).
- Run with New Buffer: Prepare a new agarose gel with a concentration appropriate for the ladder's size range and use freshly diluted running buffer.
- Control Conditions: Ensure the gel is run at a moderate voltage (1-5 V/cm distance between electrodes) and that the apparatus does not overheat [71].
Technical Support Center: Troubleshooting Guide
Why Are My PCR Bands Smeared on the Agarose Gel?
Answer: Band smearing during PCR product analysis is a common issue that compromises data interpretation. It typically indicates a heterogeneous mixture of DNA fragments instead of a single, specific product. The causes can be grouped into issues related to your sample, the gel itself, or the electrophoresis conditions [1] [2]. A systematic approach to troubleshooting is key to resolving this problem.
The following workflow outlines a logical path for diagnosing and resolving the causes of smeared bands.
Detailed Troubleshooting: Causes and Solutions
The table below expands on the specific causes and corrective actions for each category of problem.
| Problem Category | Specific Cause | Recommended Solution |
|---|---|---|
| Sample & PCR Process | Too much DNA template [73] [9] | Serial dilute template; load 0.1–0.2 µg DNA per mm of well width [1]. |
| Degraded DNA/RNA template [1] [74] | Check template integrity on gel; use fresh, nuclease-free reagents and labware [1]. | |
| Too many PCR cycles [73] [9] | Reduce number of cycles (keep within 20-35 cycles) [73]. | |
| Suboptimal PCR conditions [74] | Increase annealing temperature; reduce extension time; optimize Mg²⁺ concentration [73] [74]. | |
| Gel Preparation & Staining | Gel concentration is incorrect [1] [2] | Use appropriate gel % for your fragment size (e.g., 1.5-2% for standard PCR products) [75]. |
| Poorly formed wells [1] | Use clean comb; don't push comb to bottom of gel; remove comb carefully after solidification [1]. | |
| Uneven stain distribution [12] | Mix stain thoroughly in agarose; or use post-electrophoresis staining method [12]. | |
| Electrophoresis Run | Voltage too high [12] [2] | Run gel at lower voltage (e.g., 110-130V [12]; 50-75V [22]). |
| Running buffer is old or depleted [22] [12] | Always use freshly diluted buffer for each run; do not reuse buffer from old runs [22]. | |
| Buffer type is suboptimal [22] | Use TBE for better resolution of small fragments (<1 kb); use TAE for larger fragments or downstream applications [22]. |
Optimizing Key Experimental Parameters
For precise experimental setup, refer to the following quantitative guidelines.
Table 1: Agarose Gel Concentration Guidelines [75]
| Agarose Concentration (%) | Optimal DNA Size Separation Range (bp) |
|---|---|
| 0.5% | 1,000 – 25,000 |
| 0.7% | 800 – 12,000 |
| 1.0% | 500 – 10,000 |
| 1.2% | 400 – 7,500 |
| 1.5% | 200 – 3,000 |
| 2.0% | 50 – 1,500 |
Table 2: PCR Optimization to Prevent Smearing
| Parameter | Problem | Solution |
|---|---|---|
| Template Quantity | Too much causes smearing [73] [9] | Use 0.1-0.2 µg DNA per mm well width; try serial dilutions [1]. |
| Cycle Number | Excessive cycles cause smearing [73] | Keep between 20-35 cycles [73]. |
| Mg²⁺ Concentration | Incorrect Mg²⁺ causes nonspecific products [9] [74] | Optimize with a gradient from 1.5–5.0 mM (in 0.5 mM steps) [9]. |
| Annealing Temperature | Too low causes nonspecific binding [73] [74] | Increase temperature; use gradient PCR to find optimum [74]. |
The Scientist's Toolkit: Essential Research Reagents
This table lists key reagents and their critical functions in preventing smearing and ensuring successful electrophoresis.
| Reagent / Material | Function & Importance in Preventing Smearing |
|---|---|
| Hot-Start DNA Polymerase | Reduces nonspecific amplification and primer-dimer formation by remaining inactive until initial high-temperature denaturation step [74]. |
| Molecular Biology Grade Water | Free of nucleases that can degrade DNA/RNA samples, preventing the fuzzy smears caused by sample breakdown [1]. |
| Fresh Electrophoresis Buffer (TAE/TBE) | Provides consistent pH and ionic strength. Old or reused buffer has reduced buffering capacity, leading to band distortion and smearing [22] [12]. |
| Appropriative Nucleic Acid Stain | Allows clear visualization. Must be added evenly and be appropriate for your fragment size (e.g., some stains are less efficient with small fragments) [12]. |
| Ready-to-Use DNA Ladder | Contains a loading dye for easy visualization during loading and provides standardized size references to confirm your gel ran correctly [75]. |
Frequently Asked Questions (FAQs)
Q1: My DNA ladder is also smeared. What does this mean? A1: If your DNA ladder is smeared, the problem is almost certainly with your gel or the electrophoresis conditions, not your PCR sample. The most common causes are degradation of the ladder itself (use a fresh aliquot), running the gel at too high a voltage, or using old/contaminated running buffer [75]. Always start troubleshooting by inspecting your ladder.
Q2: I've checked everything, but my bands are still fuzzy. What am I missing? A2: Consider these often-overlooked factors:
- Voltage and Heat: Running at high voltage generates excessive heat (Joule heating), which can denature DNA and cause smearing. Always run gels at a moderate voltage (e.g., 5 V/cm of gel length) [2].
- Gel Thickness: Casting gels thicker than 5 mm can lead to band diffusion and smearing during the run. Aim for a thickness of 3–4 mm [1].
- Post-Run Delay: Avoid storing the gel or delaying visualization after electrophoresis, as bands, especially small ones, can diffuse into the gel [1].
Q3: What is the difference between a "smear" and "poorly separated bands"? A3: A smear appears as a continuous, blurry trail of DNA with no distinct bands, indicating a wide range of fragment sizes, often due to degradation or nonspecific amplification [1] [2]. Poorly separated bands are discrete bands that are too close together to be distinguished, which is typically resolved by using a different gel percentage or running the gel longer [1].
This guide provides a definitive quality control checklist to ensure your agarose gel data is robust, reproducible, and ready for publication. A critical issue like smeared bands can compromise data integrity. This document frames the quality control process within the essential context of troubleshooting and resolving band smearing, providing researchers with a final verification step before submitting their work.
Pre-Electrophoresis Quality Control Checklist
Thorough preparation is the first and most crucial defense against artifacts like smeared bands. Verify these points before running your gel.
| Checklist Item | Optimal Specification | Common Pitfalls Leading to Smearing |
|---|---|---|
| Gel Concentration | Tailored to fragment size (e.g., 0.8% for 1-10 kb, 2% for 100-500 bp) [76]. | Incorrect pore size causes poor separation and diffusion [2]. |
| Buffer Integrity | Freshly prepared TAE or TBE at correct pH and concentration [76]. | Old or depleted buffer alters pH/ions, causing poor resolution and smearing [12] [2]. |
| Sample Purity | Absence of nucleases, excess salt, or protein contamination [1]. | Contaminants cause degradation or field distortion, leading to smears [1] [2]. |
| Sample Load Quantity | 0.1–0.2 μg of DNA per mm of well width [1]. | Overloading is a primary cause of trailing smears [1] [12]. |
| Loading Dye & Denaturants | Appropriate dye; denaturants for RNA/native gels [1]. | Lack of denaturant for single-stranded nucleic acids causes fuzzy bands [1]. |
In-Run Quality Control Checklist
Monitoring conditions during electrophoresis is vital to prevent run-time artifacts. The following workflow outlines the key decisions and checks during the gel run to achieve sharp, well-resolved bands.
Adherence to the workflow above ensures you avoid these common in-run problems that cause smearing [1] [12] [77]:
- Voltage and Heat Management: Running at excessively high voltage generates excessive Joule heating, which can denature DNA fragments and cause band diffusion and smearing. Always use recommended voltages (e.g., 80-120V for agarose gels) and employ a cooling system if necessary [2] [76].
- Run Time: An insufficient run time will not resolve fragments of similar sizes, while an over-long run can cause bands to diffuse and smear. Stop the run when the dye front is near the bottom of the gel [1] [77].
- Electrical Connections: Ensure electrodes are correctly connected (negative electrode at the well side) and the power supply is functioning properly to prevent irregular migration [1].
Post-Electrophoresis & Documentation Checklist
Proper staining, imaging, and documentation are the final steps to ensure your data is publication-quality and its integrity is verifiable.
| Checklist Item | Publication-Ready Standard | Troubleshooting Link to Smearing |
|---|---|---|
| Staining Specificity | Correct stain used; sufficient duration for gel penetration [1]. | Uneven staining can mask true band morphology and smearing causes [1]. |
| Image Fidelity | Resolution: ≥300 DPI [78].Width: ≥190 mm [78].Format: TIFF preferred [78]. | High background or low contrast can obscure subtle smearing or degradation [1]. |
| Data Integrity | Raw, unprocessed image is saved and archived [78]. | Allows reviewers to distinguish true smearing from image manipulation. |
| Manipulation Log | All adjustments (brightness, contrast) are even across the entire image and documented [78]. | Non-linear adjustments that hide background can also mask smearing evidence and are often forbidden [78]. |
Frequently Asked Questions (FAQs)
What is the single most critical step to prevent smeared bands in agarose gels?
Sample integrity is paramount. Degradation of nucleic acids by nucleases is a leading cause of smearing. Always use nuclease-free reagents and labware, wear gloves, and work in a clean, designated area, especially when handling RNA [1] [2]. Proper sample preparation, including ensuring the sample is free of excess salt and protein, is equally critical [1].
My gel has "smiling" or curved bands. How does this relate to smearing and how can I fix it?
"Smiling" bands are primarily caused by uneven heat distribution (Joule heating) across the gel, where the center becomes hotter than the edges [77] [2]. While distinct from the degradation-based smearing, excessive heat can also contribute to band diffusion. To fix this, run the gel at a lower voltage, use a power supply with constant current mode, or ensure the buffer level is adequate and consistent across the tank [2] [76].
I've verified my sample quality, but I still get smearing. What should I check next?
The problem likely lies with the gel run conditions or the gel itself.
- Voltage: Running at too high a voltage is a common cause. Lower the voltage and increase the run time [12] [2].
- Gel Concentration: An incorrect gel percentage for your fragment size range will not resolve bands properly. Use a higher percentage agarose for smaller fragments [2] [76].
- Buffer: Always use fresh running buffer. Contaminated or chemically depleted buffer can cause severe smearing and poor resolution [2] [76].
What are the journal requirements for submitting gel images, particularly if bands required troubleshooting?
Journal requirements vary, but core principles are consistent [78]:
- Provide high-resolution images (at least 300 DPI) at the final print size [78].
- Submit the raw, unprocessed image file as supplementary information upon request. Some journals, like those in the Nature portfolio, require this [78].
- Any adjustments to brightness or contrast must be applied evenly to the entire image and must not obscure, enhance, or misrepresent any data. Never use non-linear adjustments to hide background or faint bands [78].
- Always check the specific "Author Guidelines" of your target journal for detailed instructions [78] [79].
The Scientist's Toolkit: Essential Reagent Solutions
| Reagent / Material | Critical Function in Preventing Smearing |
|---|---|
| Molecular Biology Grade Water | Used to dilute samples and prepare buffers; ensures the absence of nucleases that degrade samples [1]. |
| Protease or DNase/RNase Inhibitors | Added to sample lysis buffers to prevent protein or nucleic acid degradation during sample preparation [80] [81]. |
| Agarose (High Sieving) | Specialized agarose forms a uniform matrix for superior separation of small DNA fragments (20-800 bp), reducing diffusion and smearing [12]. |
| Denaturing Loading Dye | Contains agents (e.g., SDS) that denature proteins and prevent formation of secondary structures in RNA, ensuring linear migration and sharp bands [1]. |
| Fresh Electrophoresis Buffer (TAE/TBE) | Maintains stable pH and ionic strength during the run; old buffer has poor buffering capacity, leading to band distortion and smearing [12] [76]. |
Experimental Protocol: Diagnostic Gel to Troubleshoot Smearing
This protocol is designed to systematically diagnose the root cause of persistent smearing.
1. Title: Diagnostic Agarose Gel Run for Smearing Troubleshooting.
2. Objective: To identify whether smearing originates from sample degradation, overloading, or suboptimal electrophoresis conditions by comparing test samples against controls under varied parameters.
3. Materials:
- Freshly prepared agarose gel (concentration appropriate for your target fragment size).
- Freshly prepared TAE or TBE running buffer.
- Test DNA samples.
- Control DNA (e.g., a known intact plasmid digest or PCR product).
- DNA ladder/marker.
- Standard gel electrophoresis equipment and power supply.
4. Methodology:
- Step 1: Prepare a multi-well agarose gel. You will load the same samples in different lanes for direct comparison.
- Step 2: Load the gel as follows:
- Lane 1: DNA ladder.
- Lane 2: Control DNA (undiluted).
- Lane 3: Test DNA Sample A (undiluted).
- Lane 4: Test DNA Sample A (diluted 1:5 with nuclease-free water).
- Lane 5: A fresh aliquot of Test DNA Sample A, if available.
- Lane 6: Control DNA (diluted, to check for overloading effects).
- Step 3: Run the gel.
- Conduct the first half of the run at a standard voltage (e.g., 100V).
- For the second half, reduce the voltage to 80V to minimize heating effects.
- Step 4: Stain and image the gel according to standard protocols, ensuring you save the raw image file.
5. Data Interpretation:
- If smearing is present in all lanes: The issue is likely with the running conditions (e.g., old buffer, voltage too high).
- If smearing is only in undiluted test sample lanes (Lane 3) but not in diluted ones (Lane 4): The issue is sample overloading.
- If smearing is present in a specific sample (Lane 3 & 5) but not the control (Lane 2): The issue is specific to that sample's integrity (e.g., degradation during extraction).
- If bands are sharp at lower voltage but smear at higher voltage: The issue is excessive Joule heating.
Conclusion
Achieving sharp, well-defined bands in agarose gel electrophoresis is fundamental to generating reliable data in biomedical research and drug development. By systematically applying the principles outlined—from understanding root causes and implementing rigorous methodological practices to executing a structured troubleshooting protocol—researchers can effectively eliminate smearing. Mastering these techniques not only saves valuable time and resources but also ensures the integrity of downstream applications, from cloning to diagnostic assay development. Future advancements in gel matrix formulations and integrated digital analysis tools promise to further simplify this critical workflow, enhancing reproducibility and accelerating scientific discovery.
References
- 1. Nucleic Acid Gel Electrophoresis Troubleshooting [https://www.thermofisher.com/us/en/home/life-science/cloning/cloning-learning-center/invitrogen-school-of-molecular-biology/na-electrophoresis-education/na-electrophoresis-troubleshooting.html]
- 2. Troubleshooting Common Electrophoresis Problems and ... [https://www.labx.com/resources/troubleshooting-common-electrophoresis-problems-and-artifacts/5539]
- 3. Weak PCR Band Results or Smearing - What To Do [https://www.goldbio.com/blogs/articles/troubleshooting-pcr-part-three-solutions-for-weak-bands-and-smearing?srsltid=AfmBOorx3SzXUhVO0goBsreIYGbsGF42q9yDU99GKqYl0irf_eRmfC4A]
- 4. Why am I seeing smeared or smiling DNA band(s) or ... [https://biotium.com/faqs/smeared_bands_dna_migration_issues/]
- 5. Running agarose and polyacrylamide gels [https://eu.idtdna.com/page/support-and-education/decoded-plus/running-agarose-and-polyacrylamide-gels/]
- 6. Secrets to a Perfect Agarose Gel: Your A1705 Troubleshooting [https://knowhowspot.blog/perfect-agarose-gel-a1705-troubleshooting]
- 7. Mastering Gel Electrophoresis: 10 Tips and Tricks for ... [https://americanlaboratorytrading.com/mastering-gel-electrophoresis-10-tips-and-tricks-for-successful-results/?srsltid=AfmBOorxbxR4VWyoVd0fE_BD8iQF7PBv9D7ZfR3txJm1AwPv6uCRfZxN]
- 8. Smeared Bands Troubleshooting in Western Blots [https://www.sinobiological.com/category/wb-troubleshooting-smeared-bands]
- 9. Why do I get smeared PCR products? [https://www.qiagen.com/us/resources/faq/87]
- 10. Mastering Electrophoresis: Techniques, Equipment, and ... [https://www.labx.com/resources/mastering-electrophoresis-techniques-equipment-and-applications-in-dna-rna-and-protei/5535]
- 11. Agarose Gel FAQs [https://www.goldbio.com/blogs/articles/agarosegelfaqs?srsltid=AfmBOoqzSjyvqxJS1VZHaQs0LyhYfSa52McjuTAk5WAEklYBJmS12KJa]
- 12. Troubleshooting Nucleic Acid Gel Electrophoresis—Solved in ... [https://www.yeasenbio.com/blogs/molecular-biology/troubleshooting-nucleic-acid-gel-electrophoresis-solved-in-one-go]
- 13. Restriction Enzyme Digestion Problem: DNA Smear on ... [https://www.neb.com/en-us/tools-and-resources/video-library/restriction-enzyme-digestion-problem-dna-smear-on-agarose-gel?srsltid=AfmBOorKTwgGawvrWHikG79utVmAebTCpijEcgn3LAp2muiZMkT8e1ZY]
- 14. Weak PCR Band Results or Smearing - What To Do [https://www.goldbio.com/blogs/articles/troubleshooting-pcr-part-three-solutions-for-weak-bands-and-smearing?srsltid=AfmBOopVqokzwckQ7RfImmTOvvE1jMieWwjcb430U7PnQoTyH493_mt5]
- 15. Supercoiled Plasmid DNA on Agarose Gel: Secret of 3 Bands [https://bitesizebio.com/13524/how-to-identify-supercoils-nicks-and-circles-in-plasmid-preps/]
- 16. DNA Markers & Ladders [https://www.neb.com/en-us/products/markers-and-ladders/dna-markers-and-ladders?srsltid=AfmBOoo3WZlAvuoL4kOqeT36mmsGjLB7VWENg0kDkjYJfrhPw6J_RLOQ]
- 17. The pPSU Plasmids for Generating DNA Molecular Weight ... [https://www.nature.com/articles/s41598-017-02693-1]
- 18. Mastering Gel Electrophoresis: 10 Tips and Tricks for ... [https://americanlaboratorytrading.com/mastering-gel-electrophoresis-10-tips-and-tricks-for-successful-results/?srsltid=AfmBOoo7J6TBDhBmrEtJ6ZD0uQehxNiHMNOIlI4zd17iVBpqG7nwLFCF]
- 19. Weak PCR Band Results or Smearing - What To Do [https://www.goldbio.com/blogs/articles/troubleshooting-pcr-part-three-solutions-for-weak-bands-and-smearing?srsltid=AfmBOopJ5QZeX9K-LpWkZ3D0cundmfS4JWwJsPeiNOcRknWJ3mDnK0D8]
- 20. 5 Ways to Destroy your Agarose Gel and How to Avoid Them! [https://bitesizebio.com/10199/5-ways-to-destroy-your-agarose-gel/]
- 21. Troubleshooting SDS-PAGE Sample Preparation Issues [https://www.goldbio.com/blogs/articles/troubleshooting-sds-page-sample-preparation-issues?srsltid=AfmBOooPjPPXd-B3wTzp8XxZaVVJiJftz4_tUIAooPpi0rRfCCaYeLuz]
- 22. Troubleshooting Agarose Gels: Top Tips for Perfect Images [https://bitesizebio.com/50016/troubleshooting-agarose-gel/]
- 23. Weak PCR Band Results or Smearing - What To Do [https://www.goldbio.com/blogs/articles/troubleshooting-pcr-part-three-solutions-for-weak-bands-and-smearing?srsltid=AfmBOorDzmlCS0nD0VunzXRmstyXA2FR2lXWVNgw3w7NWTNwqLA0ns_D]
- 24. Troubleshooting your PCR [https://www.takarabio.com/learning-centers/pcr/faq/troubleshooting?srsltid=AfmBOoph5YDJdn98xH92XpOunlYxUeoUhKFlaVQROEzzYnsRXuWzibKZ]
- 25. Troubleshooting DNA Ladders [https://www.goldbio.com/blogs/articles/troubleshooting-dna-ladders?srsltid=AfmBOoqXYp1L9cVCBKkgGap90Irjm7XTTjLW5kQ0dQPjxbrK5zPY4M6z]
- 26. 7 Common Gel Electrophoresis Mistakes & How to Avoid ... [https://www.igenels.com/7-common-mistakes-to-avoid-for-optimizing-gel-electrophoresis/]
- 27. Gel Documentation: Best Practices for Nucleic Acid Imaging [https://www.labx.com/resources/gel-documentation-best-practices-for-nucleic-acid-imaging/5570]
- 28. How to Minimize Errors in Gel Electrophoresis? [https://eureka.patsnap.com/report-how-to-minimize-errors-in-gel-electrophoresis]
- 29. Common artifacts and mistakes made in electrophoresis [https://pmc.ncbi.nlm.nih.gov/articles/PMC7295095/]
- 30. Sustainable and Cost-Effective Gel Documentation - PMC [https://pmc.ncbi.nlm.nih.gov/articles/PMC10037652/]
- 31. Optimization of Electrophoresis Gel Concentration [https://www.aatbio.com/resources/application-notes/optimization-of-electrophoresis-gel-concentration]
- 32. Mastering Gel Electrophoresis: 10 Tips and Tricks for ... [https://americanlaboratorytrading.com/mastering-gel-electrophoresis-10-tips-and-tricks-for-successful-results/?srsltid=AfmBOoorKm5GyFZABhPqnBNI0TF9xPcs37vgVqcpRaIVf2QTTdB_GeXQ]
- 33. Agarose Gel Percentage Guide: Choosing the Right Matrix ... [https://synapse.patsnap.com/article/agarose-gel-percentage-guide-choosing-the-right-matrix-for-your-dna]
- 34. Eight Tips to Improve Gel Electrophoresis Results [https://www.thermofisher.com/us/en/home/brands/thermo-scientific/molecular-biology/molecular-biology-learning-center/molecular-biology-resource-library/spotlight-articles/8-DNA-ladder-tips.html]
- 35. Weak PCR Band Results or Smearing - What To Do [https://www.goldbio.com/blogs/articles/troubleshooting-pcr-part-three-solutions-for-weak-bands-and-smearing?srsltid=AfmBOor_ZCZHUESHpr3ZskCA4vH7N0a6q4vTzq3tdUKKTXe64-RWVUZj]
- 36. Choosing Between TAE buffer and TBE Buffer for Agarose ... [https://www.goldbio.com/blogs/articles/choosing-between-tae-and-tbe-buffer-agarose-gel-electrophoresis?srsltid=AfmBOordly9XDmlo5mMmIdmDIIkBWC6n0MwNxZGyiviegAxyMdDcFfnV]
- 37. Comparing gel electrophoresis buffers [https://www.minipcr.com/comparing-buffers/]
- 38. Troubleshooting DNA Ladders [https://www.goldbio.com/blogs/articles/troubleshooting-dna-ladders?srsltid=AfmBOoocW_XH0Ic2hx2tnP5Mrt_HvOwmYW1_mW0EtF8lNOKHepJawopG]
- 39. Steps in Nucleic Acid Gel Electrophoresis [https://www.thermofisher.com/us/en/home/life-science/cloning/cloning-learning-center/invitrogen-school-of-molecular-biology/na-electrophoresis-education/na-electrophoresis-workflow.html]
- 40. Agarose gel electrophoresis [https://en.wikipedia.org/wiki/Agarose_gel_electrophoresis]
- 41. Eight Tips to Improve Gel Results Electrophoresis [https://www.thermofisher.com/ie/en/home/brands/thermo-scientific/molecular-biology/molecular-biology-learning-center/molecular-biology-resource-library/spotlight-articles/8-DNA-ladder-tips.html]
- 42. My results contain a high background of non-specific ... [https://pcrbio.com/resources/faqs/pcrbio-hs-taq-dna-polymerase-mixes/my-results-contain-a-high-background-of-non-specific-amplicons-or-smears-what-trouble-shooting-suggestions-do-you-have-4/]
- 43. Weak PCR Band Results or Smearing - What To Do [https://www.goldbio.com/blogs/articles/troubleshooting-pcr-part-three-solutions-for-weak-bands-and-smearing?srsltid=AfmBOopBaH9PXsPGO35ZSlqcOvLl477YNqAPOWs71g0mihF8G7j87O0P]
- 44. Addgene: Protocol - How to Run an Agarose Gel [https://www.addgene.org/protocols/gel-electrophoresis/]
- 45. If PCR generates a smear after running the products on a ... [https://help.takarabio.com/36168/kb/article/110038/if-pcr-generates-a-smear-after-running-the-products-on-a-gel-what-can-be-done-to-improve-the-results]
- 46. SURE gel electrophoresis: A method for improved ... [https://pmc.ncbi.nlm.nih.gov/articles/PMC11733979/]
- 47. An affordable and simple method for DNA extraction from ... [https://www.nature.com/articles/s41598-025-87572-w]
- 48. Troubleshooting DNA Ladders [https://www.goldbio.com/blogs/articles/troubleshooting-dna-ladders?srsltid=AfmBOoorH6cdbeLKBStJxQy6TpHvle85-bCwDhvo2HrgOKIqaR8SErhA]
- 49. Preventing Samples from Remaining in the Wells of Your ... [https://www.thermofisher.com/us/en/home/references/ambion-tech-support/ribonuclease-protection-assays/general-articles/preventing-samples-from-remaining-in-the-wells-of-your-gels.html]
- 50. Weird bands on agarose gel - Unresolved problem with the ... [https://biology.stackexchange.com/questions/117693/weird-bands-on-agarose-gel-unresolved-problem-with-the-wells]
- 51. Agarose Gel Electrophoresis for the Separation of DNA ... [https://pmc.ncbi.nlm.nih.gov/articles/PMC4846332/]
- 52. Troubleshooting DNA Ladders [https://www.goldbio.com/blogs/articles/troubleshooting-dna-ladders?srsltid=AfmBOoq0gWtKXjSPrFnoM9D428-Gn-zcgfC4c924CnegDb6nRIR2SKMV]
- 53. Agarose Gel Electrophoresis for DNA Analysis [https://www.protocols.io/view/agarose-gel-electrophoresis-for-dna-analysis-d5yn87ve.html]
- 54. Agarose gel electrophoresis - QB3 Berkeley [https://qb3.berkeley.edu/education/lab-fundamentals-bootcamp/manual/cloning/gel-electrophoresis/]
- 55. Agarose Gel Electrophoresis: Step-by-Step Protocol with ... [https://genecommons.com/agarose-gel-electrophoresis-step-by-step-protocol-with-troubleshooting-tips/]
- 56. Weak PCR Band Results or Smearing - What To Do [https://www.goldbio.com/blogs/articles/troubleshooting-pcr-part-three-solutions-for-weak-bands-and-smearing?srsltid=AfmBOoo_9IoqmH_dUXTZfGnOyRe0ZpTV7dQn8l54I2e1Y6QXOfh-iti_]
- 57. 5 Ways to Get Better GelRed Results [https://www.goldbio.com/blogs/articles/5-ways-to-get-better-gelred-results?srsltid=AfmBOoqRW-nq_OajeqPTv_h7cLzv81HQ7ijHKoVx0fxDuFIRkCj_8UHd]
- 58. Pre-Stained Agarose Gel Solves Visibility Issues in ... - Longlight [https://www.longlight.com/pre-stained-agarose-electrophoresis-gel/]
- 59. Troubleshooting DNA Ladders [https://www.goldbio.com/blogs/articles/troubleshooting-dna-ladders?srsltid=AfmBOoouT9kL52f0lXspQbgpAvA_s2mJYSYADFqcilKuImNuuJhT5Uzt]
- 60. DNA analysis using analytical gels [https://www.qiagen.com/us/knowledge-and-support/knowledge-hub/bench-guide/dna/analysing-dna/dna-analysis-using-analytical-gels]
- 61. 13.3: Lab Technique - Agarose Gel Electrophoresis of DNA [https://bio.libretexts.org/Courses/West_Los_Angeles_College/Biotechnology/13%3A_Biotechnology_Lab_Protocols/13.03%3A_Lab_Technique_-_Agarose_Gel_Electrophoresis_of_DNA]
- 62. Troubleshooting DNA Ladders [https://www.goldbio.com/blogs/articles/troubleshooting-dna-ladders?srsltid=AfmBOorgGmN85KVv7k5ka80ymsRETIg43fIg7S5Z_J3h7SNGnSJENW7U]
- 63. Agarose Gel Electrophoresis - 2025 UBC iGEM Wiki [https://2025.igem.wiki/ubc-vancouver/protocols/agarose-gel-electrophoresis]
- 64. Choosing Between Agarose and Polyacrylamide Gels [https://www.labx.com/resources/choosing-between-agarose-and-polyacrylamide-gels-a-comparative-guide/5537]
- 65. Agarose vs Polyacrylamide: A Comparative Analysis [https://www.assaygenie.com/blog/agarose-vs-polyacrylamide?srsltid=AfmBOoq1Nqtt5KpzuMySGQia1M6h36g4KahAexizFuWe7d9Hzliq4nL0]
- 66. Gel Electrophoresis 101: How to Choose Between Agarose ... [https://synapse.patsnap.com/article/gel-electrophoresis-101-how-to-choose-between-agarose-and-polyacrylamide]
- 67. Mastering Gel Electrophoresis: 10 Tips and Tricks for ... [https://americanlaboratorytrading.com/mastering-gel-electrophoresis-10-tips-and-tricks-for-successful-results/?srsltid=AfmBOoqhBGHfpu2rOP_BFBL6BwgorEzi9kIVO3pvgK0gx-9fAPI-NlFy]
- 68. Troubleshooting Sodium Dodecyl Sulfate- Polyacrylamide ... [https://www.hycultbiotech.com/sds-page/troubleshooting/]
- 69. Troubleshooting SDS-PAGE Gel Running Issues [https://www.goldbio.com/blogs/articles/troubleshooting-sds-page-gel-running-issues?srsltid=AfmBOopURKVmR6wyI1oTJlyShBdf35GVgLGb3fMtpwVSaELMBbxf74zJ]
- 70. Restriction Enzyme Digestion Problem: DNA Smear on ... [https://www.neb.com/en-us/tools-and-resources/video-library/restriction-enzyme-digestion-problem-dna-smear-on-agarose-gel?srsltid=AfmBOor8AAcwEbHa_82k89QH1k5tlAlteb-QUwuupMWQcQoWfPytXGiZ]
- 71. Troubleshooting DNA Ladders [https://www.goldbio.com/blogs/articles/troubleshooting-dna-ladders?srsltid=AfmBOorDrM-ZF5X_mOulqieJyIieGz0-htfwK3lPZOFuJW_SirHqSKaB]
- 72. Tech Tip: Eight things to keep in mind for optimal gel ... [https://biotium.com/tech-tips-protocols/eight-things-to-keep-in-mind-for-optimal-gel-staining-with-gelred-and-gelgreen/]
- 73. Weak PCR Band Results or Smearing - What To Do [https://www.goldbio.com/blogs/articles/troubleshooting-pcr-part-three-solutions-for-weak-bands-and-smearing?srsltid=AfmBOor5wA1YujAYoib5zSi29wgcfB8OzmwIv0rYbNJ8oHhRFAZLAbaN]
- 74. PCR Troubleshooting Guide | Thermo Fisher Scientific - US [https://www.thermofisher.com/us/en/home/life-science/cloning/cloning-learning-center/invitrogen-school-of-molecular-biology/pcr-education/pcr-reagents-enzymes/pcr-troubleshooting.html]
- 75. Troubleshooting DNA Ladders [https://www.goldbio.com/blogs/articles/troubleshooting-dna-ladders?srsltid=AfmBOoqP2_VtJHs1AgEbGHZnKkRXz6iY3nQCQYZsycTocHvNrQG131hD]
- 76. Mastering Gel Electrophoresis: 10 Tips and Tricks for ... [https://americanlaboratorytrading.com/mastering-gel-electrophoresis-10-tips-and-tricks-for-successful-results/?srsltid=AfmBOoo-D3D1L6nSWBK-ByKdLhT3Lz7ZdptKD34zSshE4aj2zUNmKzq4]
- 77. Troubleshooting SDS-PAGE Gel Running Issues [https://www.goldbio.com/blogs/articles/troubleshooting-sds-page-gel-running-issues?srsltid=AfmBOor188wOM_fyaZDMg9QAMSxzmH_nYyfSbqlv-BLZs7h7wcT9fylm]
- 78. 2024 Scientific Publication Requirements for Western Blots ... [https://azurebiosystems.com/blog/publication-requirements-for-western-blots-and-gels/]
- 79. ACS Catalysis - Author Guidelines [https://researcher-resources.acs.org/publish/author_guidelines?coden=accacs]
- 80. Western Blotting Troubleshooting [https://www.southernbiotech.com/troubleshooting-tips-for-western-blotting/]
- 81. Western Blotting Troubleshooting Guide [https://www.cellsignal.com/learn-and-support/troubleshooting/western-blot-troubleshooting-guide?srsltid=AfmBOoo6T9uIvSM0VkjAbF8Y4feruNutDFJhlWmiCTMl2JFUnrZtKwTo]