Culture vs. Non-Culture Microbiological Tests: A Strategic Guide for Research and Diagnostic Applications
This article provides a comprehensive analysis of culture-based and culture-independent microbiological test methods for researchers, scientists, and drug development professionals.
Culture vs. Non-Culture Microbiological Tests: A Strategic Guide for Research and Diagnostic Applications
Abstract
This article provides a comprehensive analysis of culture-based and culture-independent microbiological test methods for researchers, scientists, and drug development professionals. It explores the foundational principles of both approaches, examines specific methodological applications across various infection types, addresses key challenges in implementation and data interpretation, and outlines rigorous validation and comparative assessment frameworks. The content synthesizes current evidence to guide optimal test selection, highlighting how non-culture methods are transforming diagnostic paradigms while acknowledging the enduring role of culture for antimicrobial susceptibility testing and public health surveillance.
The Evolving Landscape of Microbiological Testing: From Traditional Culture to Modern Diagnostics
Historical Context and Limitations of Culture-Based Methods
For over a century, microbial culture has served as the foundational cornerstone of clinical microbiology, enabling the isolation and identification of pathogenic organisms responsible for infectious diseases [1]. Robert Koch's pioneering work in establishing pure culture techniques created the paradigm that has guided laboratory diagnosis for generations [1]. This methodology relies on the fundamental principle of cultivating microorganisms under controlled laboratory conditions using various nutrient media, atmospheric conditions, and temperature parameters to support microbial growth [1]. However, the early 21st century has witnessed a remarkable transformation in diagnostic approaches, with non-culture-based techniques increasingly challenging traditional culture-based methods across numerous clinical scenarios [2] [3]. This shift reflects growing recognition of the inherent limitations of culture techniques alongside the emergence of sophisticated molecular diagnostics that offer improved sensitivity, speed, and diagnostic accuracy [4] [3]. This comprehensive analysis examines both historical and contemporary aspects of culture-based methods, objectively evaluating their performance against non-culture alternatives through experimental data and clinical evidence.
Historical Context and Development of Culture Methods
The evolution of culture-based methodologies represents a fascinating journey of scientific innovation. Early strategies employed simple meat infusions or heart and brain extracts as nutrient sources, with subsequent refinement through the addition of peptones, yeast extracts, and various vegetable components [1]. The invention of the petri dish revolutionized the field by enabling observation of colonial morphology while minimizing contamination [1]. The development of solid culture media using kitchen components like gelatin and agar allowed for pure culture isolation and detailed bacterial characterization [1].
Key Historical Developments in Culture Methodology
- Early Culture Media: Initial substrates included meat infusions, heart/brain extracts, and vegetable components; peptones became widely used as carbohydrate-free nutrient additives [1]
- Solid Media Revolution: Addition of gelatin or agar created solid culture media, enabling pure culture isolation and colonial morphology study [1]
- Enriched Media: Blood addition provided hemin and other nutrients, particularly benefiting fastidious microorganisms and anaerobic species [1]
- Selective Media: Incorporation of inhibitors like deoxycholic acids, bile salts, crystal violet, and antibiotics allowed isolation of pathogens from complex microbiota [1]
- Atmosphere Control: Development of anaerobic, microaerophilic, and specialized atmospheric conditions expanded the range of culturable organisms [1]
The progressive refinement of culture conditions—including optimized nutrients, atmosphere control, temperature modulation, and incubation times—enabled the cultivation of increasingly fastidious microorganisms [1]. This methodological evolution fundamentally advanced our understanding of infectious diseases and established culture as the "gold standard" against which new diagnostic techniques would be measured [3].
Fundamental Limitations of Culture-Based Methods
Despite their historical importance, culture-based methods possess significant limitations that impact their utility in modern clinical practice. The core constraints include prolonged turnaround times, limited sensitivity, inability to culture certain pathogens, and substantial resource requirements.
Time Constraints and Turnaround Limitations
Culture methods typically require 24-48 hours for initial growth of common bacterial pathogens, with fastidious organisms necessitating considerably longer incubation periods [1]. For example, Bordetella pertussis colonies become visible in 3-4 days, Legionella pneumophila requires approximately 3 days, and Bartonella species may need 12-14 days on blood agar, with some isolates requiring over 45 days for growth detection [1]. This extended time to result delays critical treatment decisions and impacts patient outcomes.
Sensitivity and Detectability Challenges
Culture methods demonstrate variable and often suboptimal sensitivity for many pathogens. In comparative studies of chronic obstructive pulmonary disease (COPD) patients, real-time PCR showed significantly higher detection rates for key respiratory pathogens compared to culture: Haemophilus influenzae (43.4% vs 26.2%), Moraxella catarrhalis (12.9% vs 6.3%), and Streptococcus pneumoniae (11.0% vs 17.4% in one study, with higher PCR detection in others) [4]. Similarly, for Campylobacter enteritis, molecular tests demonstrated 51.2% higher sensitivity than culture methods (41 PCR-positive specimens vs 21 culture-positive) [3].
Fastidious and Non-culturable Organisms
Many clinically significant pathogens either grow poorly under routine culture conditions or cannot be cultured altogether. Examples include Talaromyces marneffei (requiring prolonged incubation and specific dimorphic transition) [5], Mycobacterium tuberculosis (weeks for culture) [2], Chlamydia pneumoniae, Mycoplasma pneumoniae [2], and numerous viruses [2]. This limitation has driven the development of specialized culture techniques including shell vial procedures, axenic media, and amoebal coculture systems [1].
Technical and Interpretation Challenges
Culture-based assessment requires significant technical expertise for optimal performance. Microscopy, while rapid and inexpensive, is labor-intensive and requires highly skilled scientists [2]. Even with optimal technique, microscopy demonstrates poor sensitivity for most common bacterial and fungal infections [2]. Additionally, culture methods struggle with polymicrobial infections; in urinary tract infection evaluation, PCR detected polymicrobial infections in 95% of cases compared to only 22% with culture [3].
Table 1: Fundamental Limitations of Culture-Based Diagnostic Methods
| Limitation Category | Specific Challenge | Clinical Impact |
|---|---|---|
| Time Constraints | 24-48 hours for common pathogens; weeks for slow-growing organisms | Delayed diagnosis and treatment initiation |
| Sensitivity Issues | Lower detection rates for multiple pathogens including H. influenzae, Campylobacter | Missed diagnoses and false negatives |
| Fastidious Organisms | Difficult or impossible to culture organisms (T. marneffei, M. pneumoniae) | Incomplete diagnostic assessment |
| Technical Demands | Requires skilled personnel; labor-intensive processing | Limited availability and standardization |
| Sample Viability | Affected by transport conditions, prior antibiotic exposure | Reduced diagnostic yield |
| Antimicrobial Testing | Additional 24-48 hours beyond identification | Further delays in targeted therapy |
Comparative Performance Data: Culture vs. Non-Culture Methods
Robust experimental and clinical studies provide quantitative data demonstrating the performance differences between culture and non-culture methods across various specimen types and pathogen categories.
Respiratory Pathogen Detection
In comprehensive studies of COPD patients, significant disparities emerged between culture and molecular methods. Analysis of 2,293 samples from the AERIS study revealed PCR detection rates for H. influenzae were 65.6% higher than culture (43.4% vs 26.2%) [4]. Similarly, for M. catarrhalis, PCR detection (12.9%) doubled the culture rate (6.3%) [4]. The NTHI-004 and NTHI-MCAT-002 studies confirmed this pattern, with PCR identifying substantially more positive samples for all major respiratory pathogens [4]. Bacterial load analysis further demonstrated that many culture-negative samples showed pathogen loads by PCR equivalent to culture-positive samples, confirming the sensitivity limitation rather than clinical irrelevance of PCR-positive results [4].
Gastrointestinal Pathogen Detection
The Global Enteric Multicenter Study (GEMS) investigating 32 enteropathogens found substantially higher attributable incidences using quantitative PCR compared to traditional microbiological methods [3]. The qPCR-derived incidence rates were approximately twice as high for Campylobacter, five times higher for adenovirus, two times higher for Shigella spp./EIEC, and 1.5 times higher for heat-stable enterotoxin-producing E. coli [3]. This enhanced detection capability has led to marked increases in the use of culture-independent diagnostic tests (CIDTs) for detecting gastrointestinal pathogens including Campylobacter, Salmonella, and Shigella over the last decade [3].
Environmental Sampling and MDRO Recovery
Recent methodological comparisons of environmental sampling techniques for multidrug-resistant organisms (MDROs) demonstrate significant variability in culture-based recovery efficiency [6]. In controlled experiments comparing sponge-sticks (SS) and ESwabs, culture-based recovery varied substantially across MDRO taxa, being highest for vancomycin-resistant Enterococcus and lowest for carbapenem-resistant Pseudomonas aeruginosa (CRPA) [6]. Sponge-stick methods generally showed superior culture-based recovery compared to ESwabs, except for CRPA where all methods performed poorly [6]. These findings highlight how methodological choices significantly impact culture-based detection efficiency.
Table 2: Quantitative Comparison of Detection Rates: Culture vs. PCR
| Pathogen | Sample Type | Culture Positive (%) | PCR Positive (%) | Relative Improvement |
|---|---|---|---|---|
| H. influenzae | Sputum (AERIS study) | 26.2% | 43.4% | 65.6% higher |
| M. catarrhalis | Sputum (AERIS study) | 6.3% | 12.9% | 104.8% higher |
| S. pneumoniae | Sputum (AERIS study) | 17.4% | 11.0% | Culture higher* |
| Campylobacter | Stool | 51.2% sensitivity | 100% sensitivity | 95.3% higher sensitivity |
| Bordetella pertussis | Respiratory | Culture-negative | 170/368 detected | PCR detected culture-negative infections |
Note: Lower PCR detection for *S. pneumoniae in AERIS study attributed to misidentification of S. pseudopneumoniae/mitis isolates by conventional methods [4]*
Experimental Protocols and Methodological Comparisons
Culture-Based Method Evaluation Protocol
Recent investigations into culture-based detection of Enterobacterales in donor human milk provide insightful methodological comparisons [7]. This study systematically evaluated four culture-based approaches with varying sensitivity:
- Method 1 (Reference): Direct plating of 20 µL of sample onto selective media
- Method 2 (Volume Enhancement): Increased plating volume to 100 µL of sample
- Method 3 (Concentration): Centrifugation of 1 mL sample to concentrate bacterial cells before plating
- Method 4 (Enrichment): 24-hour pre-incubation in liquid enrichment medium before plating [7]
Detection limits varied by several orders of magnitude (2.86 × 10² CFU/mL to 4.90 × 10⁰ CFU/mL) across methods, with enrichment-based techniques demonstrating superior sensitivity [7]. In real-world testing of 93 raw donor milk samples, enrichment-based methods detected Gram-negative pathogens in four samples while direct plating detected none [7].
Environmental Sampling Protocol for MDRO Detection
Standardized sampling methodologies are critical for reliable culture-based detection. Recent comparative studies employed the following protocol:
- Surface Contamination: Known quantities of each MDRO were pipetted onto stainless-steel surfaces and allowed to dry for 1 hour
- Sampling Methods: Parallel testing of ESwabs (moistened with ESwab solution), cellulose-containing sponge-sticks (CS), and polyurethane-containing sponge-sticks (PCS)
- Processing: Sponge-sticks expressed in PBS containing 0.02% Tween 80 using a stomacher, centrifuged, and resuspended; ESwabs vortexed
- Culture: Serial dilutions plated on selective and nonselective media, incubated at 37°C for 24 hours
- Analysis: Viable colony counting and nucleic acid recovery assessment [6]
This protocol revealed that culture-based recovery was significantly higher for sponge-sticks compared to ESwabs for most MDROs, except CRPA where all methods performed poorly [6].
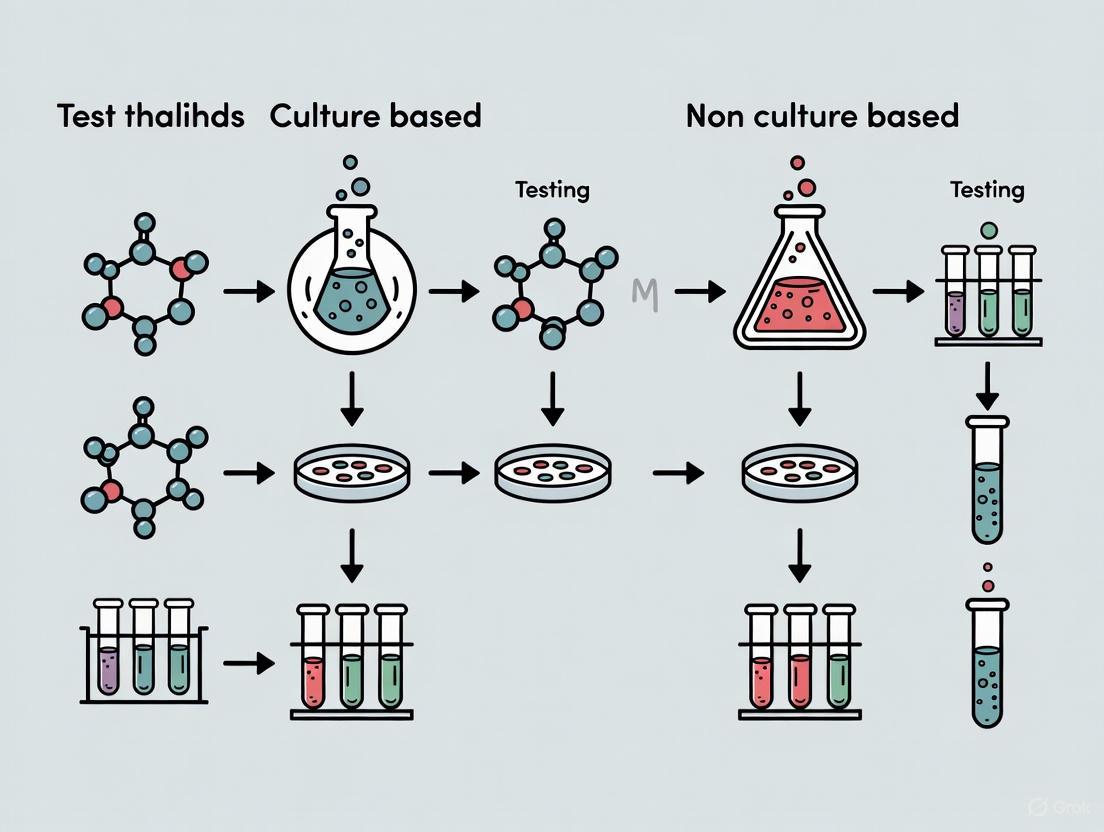
Diagram 1: Comparative Workflow: Culture vs. Non-Culture Methods. Culture-based pathways require multiple processing steps and extended incubation periods, while molecular methods provide more rapid results through nucleic acid-based detection.
The Scientist's Toolkit: Essential Research Reagents and Materials
Table 3: Key Research Reagent Solutions for Culture and Non-Culture Methods
| Reagent/Material | Primary Function | Application Context | Performance Considerations |
|---|---|---|---|
| Selective Agar Media (e.g., VRBD, Drigalski) | Selective growth of target microorganisms | Enterobacterales detection in complex samples | Variable detection limits (10²-10⁰ CFU/mL) [7] |
| Enrichment Broths | Enhancement of low bacterial concentrations | Pathogen detection in paucibacillary samples | Improves sensitivity; adds 18-24 hours to protocol [7] |
| ESwab & Sponge-Stick Systems | Environmental surface sampling | MDRO recovery from healthcare surfaces | Sponge-sticks generally superior culture recovery to ESwabs [6] |
| Nucleic Acid Extraction Kits | Isolation of DNA/RNA from clinical samples | Molecular detection methods (PCR, mNGS) | Critical step influencing sensitivity/specificity of molecular assays [6] |
| PCR Master Mixes | Amplification of target sequences | Pathogen detection and identification | Enables quantification and multiplex detection capabilities [4] |
| Whole Genome Sequencing Kits | Comprehensive genomic analysis | Pathogen identification and AMR gene detection | Allows culture-independent resistance prediction [6] [8] |
Antimicrobial Resistance Detection: Critical Limitations
The emergence and spread of antimicrobial resistance represents one of the most significant challenges in modern infectious disease management, and culture methods exhibit particular limitations in this domain.
Phenotypic vs Genotypic Resistance Detection
Culture-based antimicrobial susceptibility testing (AST) remains the reference standard for determining minimum inhibitory concentrations (MICs) and establishing resistance profiles [8]. However, this approach requires isolated pure cultures, adding 24-48 hours to the diagnostic timeline after initial growth detection [8]. This delay significantly impacts clinical decision-making, particularly for critically ill patients requiring immediate appropriate antibiotic therapy.
Molecular methods offer rapid detection of resistance mechanisms but face different limitations. Techniques including PCR, whole genome sequencing (WGS), and metagenomic next-generation sequencing (mNGS) can identify resistance genes within hours [6] [8]. However, the presence of resistance genes does not necessarily correlate with phenotypic expression, potentially leading to false-positive resistance predictions [8]. Additionally, resistance mediated by novel mechanisms or undefined genetic markers may escape detection by targeted molecular approaches [8].
Methodological Challenges in Resistance Detection
Recent evaluations highlight specific limitations in resistance detection methodologies:
- Culture-Based Limitations: Labor-intensive, slow turnaround, inability to test unculturable organisms, affected by prior antibiotic exposure [8]
- Molecular Method Limitations: Detects resistance potential rather than expression, may miss novel resistance mechanisms, requires prior knowledge of resistance markers for targeted approaches [8]
- Sequencing Limitations: WGS predictions may not correlate with phenotypic expression; false negatives documented in specific pathogens like Salmonella enterica [8]
The European Committee on Antimicrobial Susceptibility Testing (EUCAST) has highlighted critical issues requiring resolution before widespread implementation of genotypic resistance prediction, including insufficient evidence for prediction accuracy across many bacteria and the non-trivial bioinformatic processes required for proper interpretation [8].
Culture-based methods retain important roles in clinical microbiology, particularly for antimicrobial susceptibility testing and outbreak investigation where isolate availability remains essential [3]. However, substantial evidence demonstrates significant limitations in sensitivity, turnaround time, and applicability to fastidious microorganisms. Non-culture methods, particularly nucleic acid amplification techniques and sequencing-based approaches, offer demonstrably superior sensitivity and faster detection for many clinically important pathogens [2] [4] [3]. The optimal diagnostic approach increasingly involves strategic integration of both methodologies, leveraging the respective strengths of each technique while mitigating their limitations through complementary application. Future directions will likely see continued refinement of molecular methods alongside development of sophisticated algorithms integrating genotypic and phenotypic data to optimize patient management and antimicrobial stewardship.
The field of microbial diagnostics is undergoing a significant transformation, moving from traditional culture-based techniques toward rapid, non-culture methods. Culture test procedures such as the heterotrophic plate count, the most probable number (MPN) method, and the spread plate count have long been widely cited and accepted for the enumeration of microorganisms. However, these methods have inherent limitations, most notably extended performance time. Furthermore, any given culture test method typically recovers only a portion of the total viable microbes present in a sample. It is these limitations that have recently led to the marketing and adoption of a variety of non-culture procedures, test kits, and instruments [9] [10].
Non-culture microbiological tests attempt to provide the same or complementary information as culture methods through the measurement of different parameters. Culture test methods estimate microbial population densities based on the ability of microorganisms in a sample to proliferate in or on a specified growth medium under specified growth conditions. In contrast, non-culture test methods bypass the need for cellular proliferation, instead detecting microorganisms through alternative means such as genetic analysis, antigen detection, or enzymatic activity [9]. This guide provides a comprehensive comparison of these methodologies, focusing on their technological foundations, performance characteristics, and practical applications in modern research and diagnostic settings.
Scope and Definition of Non-Culture Methods
Fundamental Principles and Classifications
Non-culture methods encompass a broad range of techniques designed to detect, identify, or quantify microorganisms without relying on their ability to grow in artificial culture media. According to ASTM E1326, a standard guide for evaluating these tests, their purpose is to assist users and producers "in determining the applicability of the test for processing different types of samples and evaluating the accuracy of the results" [9] [10]. The scope of these methods is vast, covering applications from clinical diagnostics to environmental monitoring and food safety.
The fundamental principle underlying non-culture methods is that microbial presence can be established through indicators other than growth. These indicators include:
- Genetic material: Detection of microbial DNA or RNA sequences specific to target organisms
- Antigens: Recognition of microbial surface structures or secreted proteins
- Enzymatic activity: Measurement of specific biochemical reactions
- Cell components: Identification of unique microbial structural elements
It is recognized that the heterotrophic plate count (HPC) does not recover all microorganisms present in a product or a system. When this problem occurs during the characterization of a microbiological population, alternative standard enumeration procedures are necessary [9]. Non-culture methods fill this critical gap, offering solutions when traditional culture fails to detect viable but non-culturable organisms or when rapid results are essential for time-sensitive decisions.
Technological Categories of Non-Culture Methods
Non-culture methods can be broadly categorized into several technological domains, each with distinct mechanisms and applications. The following diagram illustrates the major categories and their relationships:
Technological Foundations of Major Non-Culture Platforms
Molecular Detection Methods
Molecular techniques represent one of the most significant advances in non-culture diagnostics, offering unprecedented specificity and sensitivity. These methods detect microbial nucleic acids (DNA or RNA) through various amplification and detection strategies.
Polymerase Chain Reaction (PCR) and Quantitative PCR (qPCR) techniques amplify specific genetic targets to detectable levels. In clinical applications for invasive pulmonary aspergillosis, PCR enables detection of Aspergillus DNA from bronchoalveolar lavage (BAL) samples with high sensitivity [11]. Modern implementations have expanded to viability PCR using propidium monoazide, a photoreactive DNA-binding dye that preferentially binds to double-stranded DNA of dead cells, ensuring only DNA from live microbial cells is detected [12].
Isothermal amplification methods represent another frontier, with techniques like electropulse isothermal amplification enabling rapid (20 cycles/min) target amplification without thermal cycling. This approach has been integrated into novel diagnostic systems where captured DNA and/or RNA is subjected to rapid amplification, with products hybridized to thousands of target probes on polymer-coated grids [13].
Metagenomic Next-Generation Sequencing (mNGS) provides culture-independent detection of pathogens by sequencing all nucleic acids in a sample and comparing them against extensive databases. This method is particularly valuable for detecting unculturable or unexpected pathogens in invasive samples like bronchoalveolar lavage fluid or cerebrospinal fluid [5].
Immunological and Biosensor Approaches
Immunological methods detect microbial antigens or host antibody responses to infection, providing complementary information to molecular techniques.
Enzyme-Linked Immunosorbent Assay (ELISA) formats detect circulating antigens or antibodies with quantifiable sensitivity. For melioidosis diagnosis, indirect ELISA demonstrates a pooled sensitivity of 0.86 [95% CI (0.80-0.90)] and specificity of 0.85 [95% CI (0.80-0.89)] according to a recent meta-analysis [14].
Lateral Flow Immunoassays (LFI) provide rapid, point-of-care detection of specific pathogens. For melioidosis, LFIs targeting CPS show a pooled sensitivity of 0.52 [95% CI (0.33-0.70)] and specificity of 0.96 [95% CI (0.93-0.98)] [14]. These assays are particularly valuable in resource-limited settings where complex laboratory infrastructure is unavailable.
MALDI-TOF Mass Spectrometry has revolutionized microbial identification by creating unique spectral fingerprints based on protein profiles. The technology works by crystallizing the organism in an organic acid matrix. A laser ionizes the sample within the matrix, producing singly protonated sample ions that are accelerated through a vacuum. The speed at which the ions travel creates a pattern unique to a given organism [12]. Artificial intelligence is now being applied to interpret MALDI-TOF MS spectra, using machine learning approaches like support vector machines, genetic algorithms, and artificial neural networks to improve identification accuracy [12].
Innovative Detection Platforms
Emerging technologies are pushing the boundaries of non-culture methods, with several innovative platforms showing significant promise.
Integrated Cassette Systems represent a futuristic approach to comprehensive pathogen detection. These systems, such as the conceptual MyCrobe system, incorporate multiple detection modalities in a single device. The system uses a collection device with a porous, bristled tip that expresses sterile processing buffer and creates gentle sonication during sample collection. The sample is then applied to a cassette with separate chambers for nucleic acid processing and antigen detection [13].
Microfluidic Separation with AI Detection enables rapid, culture-free detection of bacteria from whole blood for sepsis diagnosis. This approach concatenates five steps: smart centrifugation, selective blood cell lysis, volume reduction, microfluidic trapping combined with microscopy imaging, and deep-learning based detection of bacterial cells. The entire assay takes less than a few hours, significantly faster than traditional culture methods [15].
Biosensors are being developed for continuous monitoring of pathogens in various environments. Municipal water providers have experimented with biosensors in water supplies to detect specific pathogens. While the pharmaceutical sector has used flow cytometry to detect microbial numbers in circulating water systems, newer approaches combine ultrafiltration membrane modules with viability quantitative PCR for improved sensitivity and specificity [12].
Experimental Protocols and Methodologies
Protocol for Culture-Free Sepsis Detection
The detection of bloodstream infections represents one of the most challenging applications in microbiology due to low microbial loads and the critical need for rapid results. The following workflow illustrates the protocol for culture-free sepsis detection using microfluidic separation and AI-based detection:
Step 1: Smart Centrifugation – Layer 3 ml of blood culture medium-diluted spiked blood on top of 1 ml density medium (2:1 volumetric mixture of Lymphoprep and BCM with density of 1.051 g/ml). Centrifuge for 5 minutes at 600 × g in a hanging bucket centrifuge. This step removes 99.82% ± 0.04% of RBCs, 95% ± 4% of WBCs, and 63% ± 2% of platelets while recovering 65% ± 16% of E. coli, 95% ± 17% of K. pneumoniae, 64% ± 24% of E. faecalis, or 8% ± 7% of S. aureus [15].
Step 2: Selective Blood Cell Lysis – Mix approximately 2.5 ml supernatant from the smart centrifugation step with 1 ml of selective lysing solution (sodium cholate hydrate and saponin mixture). Keep in a shaking incubator at 37°C for 10 minutes to completely lyse remaining RBCs, WBCs, and platelets [15].
Step 3: Volume Reduction – Enrich the sample and remove excess lysing buffer in a second centrifugation step to concentrate bacterial cells for downstream processing [15].
Step 4: Microfluidic Trapping – Load the concentrated sample into a microfluidic chip designed to trap bacterial cells while allowing debris to pass through. Perform microscopy imaging of trapped cells [15].
Step 5: Deep Learning Detection – Apply trained convolutional neural networks to analyze microscopy images and identify bacterial cells based on morphological features. This approach has detected E. coli, K. pneumoniae, or E. faecalis from spiked samples of healthy human donor blood at clinically relevant concentrations as low as 9, 7, and 32 colony-forming units per ml of blood, respectively, within 2 hours [15].
Protocol for Antigen Detection in Fungal Diagnostics
For Talaromyces marneffei infection, a thermally dimorphic fungus that primarily affects immunocompromised individuals, antigen detection serves as an important diagnostic tool:
Sample Preparation – Collect blood, urine, or respiratory samples according to standardized procedures. For blood samples, serum separation is required before testing.
Galactomannan ELISA – Use Platelia Aspergillus Ag ELISA (Bio-Rad) according to manufacturer instructions. Add sample to microplate wells coated with monoclonal antibody EB-A2 specific to Aspergillus galactomannan. After incubation and washing, add rat monoclonal antibody EB-A2 peroxidase conjugate. Following second incubation and wash, add substrate solution and measure optical density. The test is recommended for both serum and BAL samples with cutoff indices established for each sample type [11].
(1→3)-β-D-Glucan Detection – Use Fungitell assay (Associated Cape-Cod, Inc.) following manufacturer protocol. The assay is based on the activation of a proenzyme factor in the horseshoe crab coagulation cascade. Dilute serum or BAL samples and mix with the reagent. Measure the reaction kinetics spectrophotometrically. A positive result is defined as >80 pg/mL, though some studies recommend increasing the cutoff to >200 pg/mL for BAL samples to improve specificity [11].
Lateral Flow Assay – For rapid detection, use the OLM Diagnostics or IMMY lateral flow device. Apply sample to the sample pad and allow it to migrate across the test strip. Results are typically available within 15-30 minutes. These assays demonstrate high specificity but variable sensitivity across different patient populations [11].
Performance Comparison: Quantitative Data Analysis
Diagnostic Accuracy Across Pathogens and Sample Types
The performance characteristics of non-culture methods vary significantly depending on the target pathogen, sample matrix, and specific technology employed. The following table summarizes the diagnostic accuracy of various non-culture methods for different infectious diseases:
Table 1: Diagnostic Accuracy of Non-Culture Methods for Various Infectious Diseases
| Infectious Disease | Detection Method | Sample Type | Sensitivity (Pooled) | Specificity (Pooled) | Time to Result |
|---|---|---|---|---|---|
| Melioidosis | Indirect ELISA | Serum | 0.86 [0.80-0.90] | 0.85 [0.80-0.89] | 2-4 hours |
| Melioidosis | IHA (1:160 threshold) | Serum | 0.60 [0.46-0.72] | 0.70 [0.58-0.79] | 1-2 hours |
| Melioidosis | LFI (CPS target) | Serum | 0.52 [0.33-0.70] | 0.96 [0.93-0.98] | 15-30 minutes |
| Melioidosis | IFA (polyclonal) | Serum | 0.60 [0.44-0.75] | 0.99 [0.97-1.00] | 2-3 hours |
| Melioidosis | RT-PCR (T3SS target) | Blood/Tissue | 0.72 [0.41-0.91] | 1.00 [0.97-0.99] | 2-4 hours |
| Invasive Pulmonary Aspergillosis | Galactomannan EIA | BAL | 0.82-0.92* | 0.85-0.96* | 2-4 hours |
| Invasive Pulmonary Aspergillosis | (1→3)-β-D-Glucan | BAL | 0.52-0.89* | 0.31-0.62* | 1-2 hours |
| Talaromyces marneffei infection | Metagenomic NGS | BAL/CSF | 0.85-0.95* | 0.90-0.98* | 24-48 hours |
Ranges represent variation across multiple studies with different patient populations and cutoff values [11] [14].
Method Comparison: Sepsis Diagnosis
The performance of novel non-culture methods for sepsis diagnosis demonstrates significant advantages over traditional blood culture, particularly in time-to-result:
Table 2: Comparison of Sepsis Diagnostic Methods
| Method | Principle | Detection Limit (CFU/ml) | Time to Result | Key Advantages | Key Limitations |
|---|---|---|---|---|---|
| Traditional Blood Culture | Microbial growth in liquid media | 1-10 CFU/ml | 2-5 days | Gold standard, provides isolate for AST | Slow, affected by prior antibiotics |
| Automated Blood Culture | Microbial growth with automated detection | 1-10 CFU/ml | 1-3 days | Faster than manual culture, continuous monitoring | Still requires growth, moderate speed |
| PCR-based Direct Detection | Nucleic acid amplification | 10-100 CFU/ml | 4-8 hours | Rapid, can detect non-viable organisms | Limited resistance information, may miss mixed infections |
| Microfluidic/AI Detection | Physical separation + microscopic identification | 7-32 CFU/ml* | 2 hours | Very rapid, phenotypic information | Limited clinical validation, challenging for S. aureus |
| Integrated Cassette Systems | Multiplex nucleic acid and antigen detection | Varies by target | 15-90 minutes | Comprehensive pathogen and resistance profiling | Limited availability, high cost |
Varies by organism: E. coli: 9 CFU/ml, K. pneumoniae: 7 CFU/ml, E. faecalis: 32 CFU/ml [15].
Essential Research Reagent Solutions
The implementation of non-culture methods requires specific reagents and materials designed to optimize recovery, detection, and analysis of microorganisms. The following table details key research reagent solutions essential for executing non-culture microbiological tests:
Table 3: Essential Research Reagents for Non-Culture Methods
| Reagent/Material | Composition/Type | Function | Application Examples |
|---|---|---|---|
| Selective Lysis Solution | Sodium cholate hydrate and saponin mixture | Selective lysis of human blood cells while preserving bacterial integrity | Sepsis diagnostics from whole blood [15] |
| Density Gradient Media | 2:1 volumetric mixture of Lymphoprep and blood culture medium (density 1.051 g/ml) | Separation of bacteria from blood components based on density differences | Smart centrifugation step in sepsis diagnostics [15] |
| Nucleic Acid Preservation Buffer | Detergents and enzymes that promote nucleic acid release while preventing degradation | Stabilizes genetic material during sample storage and transport | MyCrobe collection system [13] |
| Viability Dyes | Propidium monoazide (PMA) or similar compounds | Penetrates compromised membranes of dead cells, binding DNA and preventing amplification | Viability PCR to distinguish live vs. dead microorganisms [12] |
| MALDI-TOF Matrix | Organic acid crystals (e.g., α-cyano-4-hydroxycinnamic acid) | Facilitates ionization of microbial proteins for mass spectrometric analysis | Microbial identification via MALDI-TOF MS [12] |
| Hybridization Buffers | Salt solutions with detergents and blocking agents | Optimizes binding of nucleic acid probes to complementary targets | Microarray-based pathogen detection [13] |
| Enzyme Substrates | Chromogenic or fluorogenic compounds | Produces detectable signal upon enzymatic cleavage by microbial enzymes | Detection of microbial enzyme activity in biosensors |
| Microfluidic Coatings | PEGylated surfaces or specific chemical treatments | Prevents non-specific binding in microfluidic channels | Microfluidic bacterial capture devices [15] |
Non-culture methods represent a fundamental shift in microbiological detection, offering solutions to the inherent limitations of traditional culture-based techniques. These methods leverage diverse technological foundations—from genetic detection to immunological recognition and AI-enhanced microscopy—to provide faster, often more sensitive alternatives to culture. While the diagnostic accuracy of these methods varies by target organism and sample type, their collective advancement points toward a future where comprehensive pathogen detection and characterization can occur within hours rather than days.
The appropriate application of these technologies requires understanding their respective strengths, limitations, and implementation requirements. As standardization improves and technologies mature, non-culture methods are poised to become increasingly central to microbiological analysis across clinical, industrial, and research settings, ultimately enhancing our ability to detect and respond to microbial threats with unprecedented speed and precision.
Key Advantages and Inherent Limitations of Each Paradigm
Microbiological testing represents a critical foundation for diagnosing infections, guiding antimicrobial therapy, and advancing pharmaceutical research. For over a century, culture-based methods have served as the cornerstone of microbial identification, relying on the propagation of microorganisms in artificial media to obtain visible growth for analysis [16]. However, the emergence of non-culture-based techniques—including molecular, antigen detection, and sequencing methods—has fundamentally transformed diagnostic paradigms, offering alternative pathways for pathogen detection. Within clinical and research settings, understanding the comparative advantages and limitations of these approaches becomes paramount for selecting appropriate methodologies based on specific diagnostic needs, timeframe constraints, and required sensitivity [17].
This comprehensive analysis examines the technical performance, operational characteristics, and clinical applications of both culture and non-culture paradigms. By synthesizing experimental data and comparative studies, we provide an evidence-based framework to guide researchers, scientists, and drug development professionals in methodological selection for diverse laboratory contexts, from routine clinical diagnostics to cutting-edge research applications.
Performance Comparison: Quantitative Data Analysis
The comparative effectiveness of culture versus non-culture methods varies significantly across performance metrics, as evidenced by multiple clinical studies. The table below summarizes key quantitative comparisons between these methodological paradigms.
Table 1: Performance Metrics of Culture vs. Non-Culture Methods
| Performance Metric | Culture Methods | Non-Culture Methods | Experimental Context |
|---|---|---|---|
| Time to Result | 24-48 hours (routine); up to 7 days (slow-growing pathogens) [18] | 2-8 hours (PCR); <2 hours (rapid antigen tests) [15] [18] | Bacterial and fungal infection diagnostics [15] [18] |
| Analytical Sensitivity | 10-100 CFU/mL (for viable organisms) [15] | 1-10 gene copies (PCR); variable for antigen detection [15] | Sepsis diagnostics using blood samples [15] |
| Pathogen Detection Range | Limited to viable, cultivable organisms [19] | Viable/non-viable pathogens; uncultivable organisms; antimicrobial resistance markers [17] [18] | Broad-spectrum pathogen detection [17] [19] |
| Additional Characterization | Provides antibiotic susceptibility profiles [18] | Limited susceptibility data (except for specialized molecular assays) [15] | Guidance for antimicrobial therapy [18] |
| Automation Potential | Moderate (automated blood culture systems) [20] | High (molecular platforms; AI-integrated systems) [12] | High-throughput laboratory settings [12] |
A landmark study comparing automated blood culture systems (ABCS) with conventional culture methods for pleural infection diagnosis demonstrated the superior sensitivity of non-culture approaches. In 9,020 patients, ABCS detected pathogens in 632 cases, while conventional culture identified only 302 (47.8%) of these, with 330 (52.2%) patients having isolates detected exclusively by ABCS [20]. This substantial difference in detection capability highlights the sensitivity advantage of automated non-culture systems, particularly for challenging sample types like pleural fluid.
Non-Culture Methodologies: Technical Approaches and Applications
Non-culture techniques encompass diverse technological platforms, each with distinct mechanisms and applications. The table below outlines major non-culture categories with their specific implementations and performance characteristics.
Table 2: Non-Culture Method Categories and Characteristics
| Method Category | Examples | Mechanism | Clinical/Research Applications | Limitations |
|---|---|---|---|---|
| Molecular Detection | PCR, multiplex PCR, viability qPCR [15] [18] | Amplification of pathogen-specific DNA/RNA sequences | Sepsis diagnosis [15]; infectious disease identification [18]; pharmacogenomics [18] | Cannot distinguish viable/non-viable pathogens (without viability dyes) [18] |
| Antigen Detection | Galactomannan EIA, CLIA, LFA [11] | Immunoassay detection of microbial antigens | Invasive pulmonary aspergillosis diagnosis [11] | Variable specificity; cross-reactivity issues [11] |
| Metagenomic Sequencing | Shotgun metagenomics, 16S rRNA sequencing [17] | Sequencing all genetic material in sample; bioinformatics analysis | Microbial community profiling [17]; uncultivable pathogen discovery [19] | High cost; complex data interpretation; database limitations [17] |
| Proteomic Identification | MALDI-TOF MS [12] | Mass spectrometry analysis of microbial protein profiles | Microbial identification [12] | Limited database coverage; equipment cost [12] |
Molecular methods like PCR provide exceptional speed and sensitivity, detecting pathogens within hours—crucial for sepsis management where mortality increases approximately 8% per hour of delayed effective treatment [15]. Advanced approaches integrate viability markers like propidium monoazide in qPCR assays to distinguish live from dead microorganisms, addressing a key limitation of molecular detection [12].
For fungal infections such as invasive pulmonary aspergillosis, non-culture biomarkers like galactomannan and (1→3)-β-D-glucan offer improved sensitivity over culture, particularly in immunocompromised patients [11]. Metagenomic sequencing enables comprehensive microbiome analysis, with studies demonstrating that culture-enriched metagenomic sequencing (CEMS) and culture-independent metagenomic sequencing (CIMS) identify largely non-overlapping microbial species (only 18% overlap), suggesting complementary roles in revealing full microbial diversity [19].
Experimental Protocols: Methodological Details
Automated Blood Culture System (ABCS) Protocol for Pleural Fluid
A substantial comparative study evaluated ABCS versus conventional culture using pleural fluid samples from 9,020 patients [20]. The methodology provides a robust template for comparative performance assessment:
Sample Collection and Preparation: Fresh pleural fluid samples were collected via thoracentesis or percutaneous drainage. At bedside, 5-10 mL of fluid was inoculated into each aerobic and anaerobic blood culture bottle (for ABCS), while 5-10 mL was placed in a sterile tube for conventional culture [20].
Transport and Processing: All samples were promptly transported to the microbiology laboratory. The non-centrifuged portion of the conventional sample was aspirated and inoculated onto culture media [20].
Culture Conditions:
- Conventional culture: Inoculation onto blood agar, MacConkey agar, and Brucella agar; incubation at 37°C for up to 7 days under aerobic and anaerobic conditions [20].
- ABCS: Use of BACT/ALERT 3D and VIRTUO systems with aerobic and anaerobic bottles; incubation at 37°C for up to 7 days with terminal subculture [20].
Organism Identification: Positive samples underwent species identification using VITEK 2 and VITEK MS systems [20].
Data Analysis: Comparison of detection rates, time to positivity, and organism identification between methods, with statistical analysis using Pearson χ² test and Student's t-test [20].
This protocol demonstrated that ABCS detected 52.2% more positive cases than conventional culture alone, with particular advantage for streptococci, Staphylococcus aureus, and Klebsiella species [20].
Culture-Enriched Metagenomic Sequencing (CEMS) Protocol
A novel approach combining culturomics with metagenomic sequencing was developed to maximize microbial detection from complex samples [19]:
Sample Preparation: Fresh fecal sample (0.5g) was homogenized with 4.5g distilled water, with serial dilutions (10⁻³ to 10⁻⁷) prepared in 0.85% NaCl solution [19].
Multi-Media Cultivation: 200μL of each dilution was plated on 12 different media types, including nutrient-rich media (LGAM, PYG), selective media (PGAM, DGAM), and oligotrophic media (1/10GAM) [19].
Incubation Conditions: Duplicate sets were incubated aerobically and anaerobically at 37°C for 5-7 days using an anaerobic chamber with 95% nitrogen and 5% hydrogen atmosphere [19].
Sample Processing:
- Experienced Colony Picking (ECP): Traditional selection of distinctive colonies for purification and identification [19].
- Culture-Enriched Metagenomic Sequencing (CEMS): All colonies from each medium were pooled, harvested using cell scrapers, and processed for DNA extraction [19].
- Culture-Independent Metagenomic Sequencing (CIMS): Direct metagenomic sequencing of original fecal sample [19].
DNA Sequencing and Analysis: Shotgun metagenomic sequencing using Illumina HiSeq 2500, generating 100bp paired-end reads with average 6.73Gb data per sample. Taxonomic profiling using HUMANN2 with MetaPhlAn2 [19].
This protocol revealed that CEMS and CIMS identified complementary microbial communities with only 18% species overlap, demonstrating their synergistic value in comprehensive microbiome analysis [19].
Research Reagent Solutions: Essential Materials
Table 3: Key Research Reagents and Their Applications
| Reagent/Kit | Function | Application Context |
|---|---|---|
| BACT/ALERT Culture Bottles (bioMérieux) | Supports microbial growth with nutrient media in automated detection systems | Automated blood culture systems for sterile body fluids [20] |
| Lymphoprep (STEMCELL Technologies) | Density gradient medium for cell separation | Smart centrifugation protocols for bacterial isolation from blood [15] |
| Propidium Monoazide | DNA-binding dye that penetrates only dead cells | Viability qPCR to distinguish live/dead microorganisms [12] |
| QIAamp Fast DNA Stool Mini Kit (Qiagen) | DNA extraction from complex biological samples | Metagenomic sequencing from fecal samples [19] |
| Fungitell Assay (Associated Cape Cod) | Detection of (1→3)-β-D-glucan in serum | Diagnosis of invasive fungal infections [11] |
| Platelia Galactomannan EIA (Bio-Rad) | Enzyme immunoassay for aspergillus antigen | Diagnosis of invasive pulmonary aspergillosis [11] |
| GasPak EZ Anaerobe Pouch (BD) | Creates anaerobic environment for cultivation | Anaerobic bacterial culture [21] |
| Hubix Culture Bottles (HUFIT Inc.) | Culture media for novel continuous monitoring systems | Bacterial growth detection in automated systems [21] |
Workflow Visualization: Methodological Pathways
The diagnostic and research pathways for culture and non-culture methods involve distinct procedural steps with significant implications for time investment and information output. The following workflow diagrams illustrate these processes.
Culture vs. Non-Culture Workflow Comparison
The fundamental distinction between these paradigms lies in their core detection principles: culture methods depend on biological amplification (microbial growth), while non-culture methods utilize technological amplification (molecular or signal detection). This distinction drives their differential performance in speed, sensitivity, and application scope.
Integrated Approaches and Future Directions
The comparative analysis reveals that culture and non-culture methods offer complementary rather than mutually exclusive approaches. Integrated methodologies that leverage the strengths of both paradigms represent the future of microbiological diagnostics and research [17] [19]. Culture-enriched metagenomic sequencing exemplifies this integration, demonstrating superior microbial diversity detection compared to either method alone [19].
Emerging trends include automation of traditional culture processes [12], artificial intelligence integration for MALDI-TOF spectrum interpretation [12], and development of rapid culture-free detection systems for sepsis diagnosis [15]. These innovations aim to bridge the performance gap between paradigms while maintaining the unique benefits of each approach. For pharmaceutical and research applications, methodological selection should be guided by specific requirements for speed, sensitivity, characterization depth, and actionable results, with increasingly sophisticated integrated systems offering pathways to optimize across all these dimensions.
Understanding the 'Gold Standard' Concept in Microbiology
In clinical and research microbiology, the 'gold standard' refers to the diagnostic test or benchmark that is the best available under reasonable conditions against which new tests are compared to gauge their validity and efficacy [22]. This concept is fundamental yet dynamic, as technological advancements continuously redefine the benchmarks for accuracy. The central thesis of modern microbiological testing hinges on the comparison between traditional culture-based methods—long considered the archetypal gold standard—and rapidly evolving non-culture methods such as molecular diagnostics. For researchers and drug development professionals, understanding this dichotomy is crucial for selecting appropriate methodologies, interpreting data accurately, and driving diagnostic innovation. This guide provides an objective comparison of these paradigms, supported by experimental data and detailed protocols.
Defining the Gold Standard and its Imperfections
A hypothetical ideal gold standard test possesses 100% sensitivity (identifying all true positives) and 100% specificity (identifying all true negatives) [22]. In practice, however, no test is perfect, and the designation of "gold standard" is context-dependent, representing the best available option that is practically achievable [23].
The table below outlines core characteristics of an ideal gold standard versus practical realities:
| Characteristic | Ideal Gold Standard | Practical/Imperfect Gold Standard ("Alloyed Gold") |
|---|---|---|
| Sensitivity | 100% (No false negatives) | High, but less than 100% |
| Specificity | 100% (No false positives) | High, but less than 100% |
| Real-World Example | Theoretical benchmark | Blood culture for enteric fever [24], Microbial culture for many bacterial pathogens [25] [3] |
| Key Limitation | Unattainable in practice | Performance can be affected by sample quality, prior antibiotic use, and the inherent limitations of the method itself [25]. |
This concept is critically linked to ground truth, which is the underlying absolute state of information. The gold standard is the best effort to approximate this ground truth [22] [23]. In many cases, a Composite Reference Standard (CRS) is employed, which combines the results of two or more diagnostic tests to define the final diagnosis when a single perfect test is unavailable [24].
Direct Comparison: Culture vs. Non-Culture Methods
The following tables summarize the comparative performance of traditional culture and modern non-culture methods across key parameters and specific pathogens.
| Parameter | Culture-Based Methods | Non-Culture Methods (e.g., NAATs, Multiplex PCR) |
|---|---|---|
| Fundamental Principle | Growth and isolation of viable microorganisms on or in nutrient media [3]. | Detection of pathogen-specific biomarkers, most commonly nucleic acids [3]. |
| Turnaround Time | Long (24 hours to several days or weeks) [3]. | Rapid (hours to same-day) [3]. |
| Analytical Sensitivity | Lower; requires viable organisms in sufficient quantity. | Higher; can detect non-viable or low-load pathogens [3]. |
| Ability to Detect Novel/Unculturable Pathogens | No, only organisms that can be grown under the laboratory conditions used. | Yes, if the genetic target is known [25]. |
| Key Advantage | Provides a live isolate for antimicrobial susceptibility testing (AST) and strain typing for public health surveillance [3]. | High throughput, ability to test for multiple pathogens simultaneously (multiplexing), and superior speed [3]. |
| Major Drawback | Slow, labor-intensive, and fails to identify difficult-to-culture microorganisms [3]. | Does not provide a live isolate for AST without reflex culture [26] [3]. Positive results may detect non-viable organisms or clinical significance may be uncertain [26]. |
Table 2: Performance Data from Comparative Studies
| Infectious Disease / Pathogen | Gold Standard | Comparative Method | Key Performance Findings |
|---|---|---|---|
| Enteric Fever (Salmonella spp.) [24] | Blood Culture | Tube Widal & Dot Blot Assay | Blood culture sensitivity was low (9.81% positivity), specific at 100%. Dot Blot IgM showed higher sensitivity (71.15%) but lower specificity (10.16%) against a Composite Reference Standard. |
| Campylobacter Enteritis [3] | Culture | PCR | In a study of 400 specimens, PCR identified 41 positives. Culture only detected 21 of these, yielding a culture sensitivity of 51.2% compared to PCR. |
| Necrotizing Soft Tissue Infections (NSTI) [25] | Culture | Multiple Molecular Methods (16S rRNA sequencing, etc.) | Culture identified microbes in 70% of surgical samples. Molecular methods identified microorganisms in 90% of samples and frequently detected additional, unexpected pathogens. |
| Polymicrobial Urinary Tract Infections [3] | Urine Culture | Multiplex PCR | In 175 patients with polymicrobial infections, PCR detected 95% of cases, while culture only reported 22%. PCR also revealed polymicrobial infections in 67 patients with negative culture results. |
Detailed Experimental Protocols
To ensure reproducibility and critical evaluation, detailed methodologies from key cited studies are outlined below.
Objective: To isolate and identify Salmonella enterica serotype Typhi or Paratyphi from the blood of suspected enteric fever patients.
Workflow:
Key Reagents and Materials:
- Culture Medium: Brain Heart Infusion Broth with SPS (sodium polyanethol sulfonate) as an anticoagulant and anticoagulant [24].
- Sub-culture Media: Blood Agar and MacConkey Agar [24].
- Identification Tools: Standard biochemical test reagents (e.g., for lactose fermentation, gas production) and specific antisera for sero-agglutination confirmation [24].
- Antimicrobial Susceptibility Testing: Mueller-Hinton Agar and antibiotic discs for Kirby Bauer disc diffusion method [24].
Objective: To define a confirmed case of enteric fever in the absence of a single perfect test, using multiple component tests.
Workflow:
Key Reagents and Materials:
- Component Tests: All reagents for blood culture, Tube Widal test, and Dot Enzyme Immunoassay (Dot EIA) for Salmonella-specific IgM and IgG [24].
- Data Integration Framework: A pre-defined statistical or rule-based framework (e.g., the "two-test criteria") for combining results from the component tests to yield a final CRS outcome [24].
Objective: To quantify live Campylobacter cells in a sample, differentiating them from dead, membrane-compromised cells, thereby challenging the CFU gold standard.
Workflow:
Key Reagents and Materials:
- Propidium Monoazide (PMA): A DNA-intercalating crosslink agent that penetrates only dead, membrane-compromised cells. Upon light exposure, it covalently cross-links the DNA, rendering it non-amplifiable in subsequent qPCR [27].
- Internal Sample Process Control (ISPC): A known number of dead cells from a different species (e.g., C. sputorum) added to the sample to monitor the efficiency of PMA treatment and compensate for DNA loss during processing [27].
- qPCR Reagents: Primers and probes specific for thermophilic Campylobacter, the ISPC, and an Internal Amplification Control (IAC) to detect PCR inhibition [27].
Essential Research Reagent Solutions
The table below details key reagents and their critical functions in the methodologies discussed.
| Research Reagent | Function & Application |
|---|---|
| Selective Culture Media (e.g., with antibiotics) | Suppresses the growth of competing flora to allow isolation of fastidious pathogens like Campylobacter [3]. |
| Propidium Monoazide (PMA) | Used in live/dead differentiating qPCR to inhibit amplification of DNA from dead cells, ensuring quantification of viable pathogens [27]. |
| Internal Sample Process Control (ISPC) | Monitors efficiency of sample processing steps (e.g., DNA extraction, PMA treatment) and corrects for sample-derived inhibition or losses [27]. |
| Target-Specific Primers/Probes | For NAATs; ensure high specificity by binding to unique genetic sequences of the target pathogen (e.g., Salmonella Typhi, C. jejuni) [25] [3]. |
| Polyvalent Antisera | For serological agglutination tests (e.g., Widal, serotyping) to identify specific bacterial serovars based on surface antigen reactions [24]. |
The concept of a gold standard in microbiology is not static. While culture remains an indispensable tool for obtaining live isolates for antimicrobial susceptibility testing and epidemiological typing, its role as the undisputed gold standard is being redefined [3]. Molecular methods, particularly NAATs, offer superior speed, sensitivity, and the ability to detect difficult-to-culture pathogens, establishing themselves as the new gold standard for certain infections, especially viral ones [26].
The future of microbiological diagnostics lies in a synergistic approach. Reflex culture—where samples positive by a rapid, sensitive molecular test are subsequently cultured—is a recommended strategy to harness the speed of molecular methods while retaining the phenotypic information provided by culture [26] [3]. For researchers and drug developers, the choice between methods must be guided by the specific question at hand, whether it is rapid detection, outbreak tracing, or antimicrobial stewardship, with a clear understanding of the strengths and limitations inherent in each technological paradigm.
The Critical Role of Culture in Antimicrobial Susceptibility Testing
In the global fight against antimicrobial resistance (AMR), which is responsible for millions of deaths annually, antimicrobial susceptibility testing (AST) stands as a critical line of defense [28]. AST guides effective antimicrobial therapy, balancing optimal patient outcomes with the need to minimize selection pressure that drives AMR [29]. The core principle of AST is to expose a pathogen isolated from a patient to antimicrobial agents to determine the most effective treatment [29]. While novel, rapid methods are emerging, microbial culture remains the foundational step for phenotypic AST. This article objectively compares culture-based AST methods with emerging non-culture alternatives, framing the discussion within the broader thesis of culture versus non-culture microbiological test methods.
A Comparative Analysis of AST Methodologies
AST methods can be broadly categorized into classical culture-based, automated culture-based, and non-culture molecular techniques. Each offers distinct advantages and limitations in turnaround time, cost, and informational value.
Table 1: Comparison of Major Antimicrobial Susceptibility Testing Methods
| Method Category | Examples | Key Advantages | Key Limitations | Typical Turnaround Time | Information Provided |
|---|---|---|---|---|---|
| Classical Culture-Based | Disk Diffusion, Agar/Broth Dilution [28] | Low cost, flexible, provides phenotypic result (what actually happens) [28] | Time-consuming, requires prior bacterial isolation [28] | 18–24 hours or longer after isolation [28] | Qualitative (S/I/R) or Quantitative (MIC) [28] |
| Automated Culture-Based | Automated Blood Culture Systems (BACT/ALERT VIRTUO) [20] | Higher sensitivity, faster than some manual methods, standardized [20] | Higher instrument costs, limited agent selection | 6–24 hours after initial isolation [28] | Quantitative (MIC) |
| Non-Culture Molecular | PCR, Genetic Probe Assays [28] | Rapid, direct from specimen, high throughput [28] | Detects only known resistance mechanisms, may overestimate resistance [28] | ~1–6 hours [28] | Detection of specific resistance genes (e.g., mecA, ESBL genes) [28] |
Experimental Data: Showcasing the Sensitivity of Automated Culture
A 2021 retrospective study of over 9,000 patients compared conventional pleural fluid culture with automated blood culture systems (ABCS) like BACT/ALERT [20]. The results demonstrate a significant performance enhancement offered by modern culture technology.
Table 2: Experimental Performance Data: Conventional vs. Automated Culture
| Testing Parameter | Conventional Culture | Automated Blood Culture System (ABCS) |
|---|---|---|
| Number of Positive Patients | 302 (47.8%) | 632 (100%) |
| Exclusive Positivity Rate | Not Applicable | 330 (52.2%) |
| Common Organisms Detected | Varies | Viridans group streptococci, Staphylococcus aureus, Klebsiella spp. [20] |
| Associated Patient Factors | Higher CRP, Lower glucose [20] | Lower CRP, Higher glucose [20] |
Experimental Protocol for Culture Comparison [20]: Pleural fluid samples were divided at the bedside. For ABCS, 5-10 mL was inoculated into each aerobic and anaerobic blood culture bottle (BACT/ALERT 3D or VIRTUO). For conventional culture, another 5-10 mL was placed in a sterile tube. Conventional culture used solid media (blood agar, MacConkey agar, Brucella agar) incubated aerobically and anaerobically at 37°C for up to 7 days. ABCS bottles were incubated at 37°C for up to 7 days. Identification and susceptibility testing used VITEK 2 or VITEK MS systems.
The Scientist's Toolkit: Key Research Reagent Solutions
The execution of reliable AST, whether for clinical diagnostics or pharmaceutical development, depends on a suite of essential reagents and instruments.
Table 3: Essential Research Reagents and Tools for AST
| Item | Function/Application in AST | Key Players/Examples |
|---|---|---|
| Culture Media | Provides nutrients for microbial growth; essential for phenotypic results [30] | Chocolate Agar, Nutrient Broth, Tryptic Soy Broth [31] |
| Automated Culture Systems | Enhances diagnostic sensitivity and standardization for sterile body fluids [20] | BACT/ALERT VIRTUO (bioMérieux) [20] |
| Identification & Susceptibility Systems | Provides species identification and MIC-based susceptibility profiles [20] | VITEK 2, VITEK MS (bioMérieux) [20] |
| Antimicrobial Discs | Used in disk diffusion method to determine susceptibility categorically [28] | Various manufacturers (e.g., BD, bioMérieux) |
| Microdilution Trays | Used in broth microdilution to determine Minimum Inhibitory Concentration (MIC) [28] | Custom or pre-made panels for automated systems |
Innovation and Workflow in Modern AST
The Personalized AST Workflow
Emerging research focuses on making AST more precise and efficient by moving away from one-size-fits-all panels. The following diagram illustrates a novel, data-driven workflow for personalized AST.
Diagram Title: Personalized AST Clinical Prediction Workflow
This personalized approach uses clinical prediction models that incorporate variables like prior antimicrobial resistance, recent antibiotic treatment, and patient age to predict the probability of susceptibility for a given antibiotic [29]. If an antibiotic from the WHO "Access" category (those least likely to induce resistance) has a predicted susceptibility probability greater than 50%, it is automatically added to the test panel [29]. This method has been shown in simulation studies to provide more susceptible results for Access category antibiotics than standard fixed-panel approaches, directly supporting antimicrobial stewardship goals [29].
The Broader Diagnostic Pathway
The role of culture becomes even more critical when viewed as part of the complete diagnostic pathway, where it interacts with and validates other testing methods.
Diagram Title: Integrated Culture and Molecular AST Pathway
Despite the rapid advancement of molecular techniques, microbial culture remains the irreplaceable cornerstone of phenotypic antimicrobial susceptibility testing. It provides the direct, observable evidence of how a pathogen responds to an antimicrobial agent—the phenotypic reality that genotypic methods can only predict. While molecular methods offer unparalleled speed for detecting known resistance mechanisms, they cannot replace the comprehensive insight gained from culture, especially for detecting novel resistance patterns. The future of AST lies not in the displacement of culture, but in its integration with novel technologies and data-driven approaches, creating a synergistic workflow that maximizes speed, accuracy, and clinical relevance in the ongoing battle against antimicrobial resistance.
Methodological Deep Dive: Applications of Culture and Non-Culture Tests in Research and Diagnostics
Nucleic Acid Amplification Tests (NAATs) have revolutionized diagnostic microbiology by providing rapid, sensitive, and specific detection of pathogens that traditional culture-based methods often miss. The evolution from conventional culture techniques to molecular methods represents a paradigm shift in clinical microbiology, enabling detection of non-culturable, fastidious, or slow-growing microorganisms [32] [33]. While culture remains valuable for antibiotic susceptibility testing and serves as an enrichment technique, it demonstrates limited effectiveness for anaerobic, low-abundance, and slow-growing organisms [33]. The COVID-19 pandemic particularly highlighted the crucial role of NAATs, with methods like polymerase chain reaction (PCR) and sequencing becoming essential for diagnosis and management [34].
NAAT technologies have diversified significantly, with multiplex panels and real-time applications emerging as powerful tools for syndromic testing. These advancements allow simultaneous detection of multiple pathogens in a single reaction, substantially improving diagnostic efficiency for infections with overlapping clinical presentations [35] [36]. This guide objectively compares the performance characteristics of various NAAT platforms, focusing on their applications, limitations, and experimental validation in clinical settings.
Performance Comparison of NAAT Modalities
The diagnostic landscape features several NAAT approaches with distinct performance characteristics, applications, and technical requirements. The table below provides a comparative analysis of major NAAT modalities based on recent clinical studies.
Table 1: Performance Comparison of NAAT Technologies in Clinical Diagnostics
| Technology | Targets/Specific Examples | Sensitivity & Specificity | Limit of Detection | Multiplexing Capacity | Key Advantages | Primary Limitations |
|---|---|---|---|---|---|---|
| Multiplex Real-time RT-PCR | Respiratory viruses (SARS-CoV-2, Influenza A/B, RSV) [35] | 100% PPA and NPA for all targets compared to reference assays [35] | 3,333-8,333 copies/mL depending on target [35] | Moderate (3-4 targets typically) | High throughput, automated sample-to-result platform [35] | Limited targets per reaction compared to advanced multiplexing |
| Melting-Curve-Based Multiplex qPCR | SARS-CoV-2, Influenza A, HRSV, HRV-B [36] | 100% concordance with commercial kits [36] | 10 copies/reaction for all targets [36] | Moderate (4 targets demonstrated) | 100% specificity in validation; no cross-reactivity [36] | Requires optimization to maintain distinct melting temperatures |
| High-Plex PCR with Machine Learning | 7 respiratory pathogens simultaneously [37] | Accurate classification using amplification curve analysis [37] | Not specified | High (7-plex demonstrated) | Single fluorescent channel detection; reduced reagent costs [37] | Complex bioinformatics pipeline required |
| Metagenomic NGS (wcDNA) | Broad pathogen detection (bacterial, fungal, viral) [33] | 74.07% sensitivity, 56.34% specificity vs. culture [33] | Varies by pathogen abundance | Very high (unbiased detection) | Culture-independent; detects uncultivable organisms [33] | High host DNA background; compromised specificity |
| Fungal Multiplex Real-time PCR | Aspergillus fumigatus, A. terreus, Candida albicans, C. glabrata [38] | 100% specificity across 65 organisms tested [38] | 100 pg/μL (10⁶ copies/μL) [38] | Moderate (4 targets demonstrated) | Rapid 3-hour detection; identifies non-viable organisms [38] | Higher detection limit than bacterial assays |
Experimental Protocols and Methodologies
Multipreal-time RT-PCR for Respiratory Pathogens
The analytical performance evaluation of the LabTurbo multiplex real-time RT-PCR kit exemplifies a standardized approach for respiratory pathogen detection [35]. This cross-sectional study conducted from September to November 2023 utilized 350 nasopharyngeal swab samples (250 positive cases and 100 negative cases) collected in universal transport medium and stored at -80°C until analysis. The protocol employed the LabTurbo platform for simultaneous detection of SARS-CoV-2, influenza A/B, and RSV, with comparison to reference assays (Cobas Liat SARS-CoV-2 influenza A/B assay and Cobas influenza A/B and RSV assays). For limit of detection (LOD) determination, RNA standards were serially diluted and tested with the LabTurbo kit, establishing LODs ranging from 3,333 copies/mL for influenza A to 8,333 copies/mL for SARS-CoV-2 and RSV [35]. The study demonstrated 100% positive percent agreement (PPA) and negative percent agreement (NPA) with reference methods, confirming robust diagnostic performance.
Melting-Curve-Based Multiplex Assay Development
The development of a melting-curve-based multiplex real-time PCR (M-m-qPCR) assay illustrates a targeted approach for respiratory virus detection [36]. Researchers designed primers targeting the RNA-dependent RNA polymerase (RdRp) and nucleocapsid phosphoprotein N of SARS-CoV-2, the Matrix protein 2 of Influenza A virus, the RdRp domain of the L protein from Human Respiratory Syncytial Virus, and the polyprotein from Rhinovirus B genes. The analytical validation included in silico analysis and testing against a panel of reference and clinical strains encompassing viral, bacterial, and fungal pathogens, demonstrating 100% specificity. The assay achieved a detection limit of 10 copies per reaction for all targets using positive controls and was further validated in simulated nasal fluid before clinical testing on 811 nasopharyngeal swabs [36]. This comprehensive validation framework ensures reliable performance across diverse clinical scenarios.
Smart-Plexer: Hybrid Multiplex Assay Development
The Smart-Plexer workflow represents a breakthrough in multiplex assay development through its hybrid approach that couples empirical testing of singleplex assays with computer simulation [37]. This method addresses the fundamental challenge in multiplex development where the number of possible assay combinations increases exponentially with the number of targets. The process involves:
- Singleplex Data Collection: Running real-time PCR reactions with individual primer sets and targets.
- Curve Processing: Background subtraction, removal of late amplification curves, and elimination of noisy curves.
- Sigmoidal Fitting: Applying a five-parameter model to normalize curve data.
- Distance Calculation: Computing kinetic inter-target distances between amplification curves.
- Combination Ranking: Ranking simulated multiplex combinations based on average distance scores (ADS) and minimum distance scores (MDS).
- Empirical Validation: Laboratory testing of top-ranked combinations with machine learning classification via Amplification Curve Analysis (ACA).
This workflow successfully developed a 7-plex assay for respiratory pathogens using a single fluorescent channel, dramatically reducing development time and resources [37].
Figure 1: Smart-Plexer computational-experimental workflow for developing multiplex PCR assays.
Advanced Applications and Innovative Approaches
Digital Technologies and Machine Learning in Multiplexing
Recent innovations have leveraged digital technologies to overcome traditional limitations in multiplex qPCR. Machine learning (ML) algorithms applied to amplification and melting curves (AC and MC) enable accurate classification of multiple nucleic acid targets in single reactions [39]. This data-driven approach enhances multiplexing capabilities without requiring sophisticated instrumentation or complex fluorescent probe systems. The integration of knowledge-based and data-driven software solutions creates an end-to-end framework for streamlined assay design and improved target detection accuracy [39]. These computational advances are particularly valuable for expanding diagnostic capacity in resource-limited settings where traditional multiplex equipment may be cost-prohibitive.
Metagenomic Next-Generation Sequencing
Metagenomic next-generation sequencing (mNGS) represents the most comprehensive NAAT approach, enabling unbiased detection of known and novel pathogens without prior targeting [33]. Comparative studies of whole-cell DNA (wcDNA) mNGS versus cell-free DNA (cfDNA) mNGS reveal important performance differences: wcDNA mNGS demonstrates superior sensitivity (74.07% vs. 46.67% concordance with culture) and lower host DNA background (84% vs. 95% host DNA) [33]. However, this enhanced sensitivity comes with compromised specificity, requiring careful interpretation in clinical practice. mNGS excels in detecting polymicrobial infections and identifying fastidious organisms that evade conventional diagnostic methods, positioning it as a powerful tool for complex diagnostic scenarios.
Antimicrobial Resistance Detection
NAATs have expanded beyond simple pathogen detection to encompass antimicrobial resistance (AMR) profiling. A four-color multiplex real-time PCR assay for Mycoplasma genitalium demonstrates this application by simultaneously detecting the pathogen and azithromycin-resistance mutations in the 23S rRNA gene [40]. This approach enables targeted antibiotic therapy selection, directly addressing the global challenge of macrolide-resistant M. genitalium. Similarly, next-generation sequencing facilitates genomic antimicrobial susceptibility testing (gAST) by detecting resistance genes in bacterial whole genome sequences [32]. While gAST cannot yet replace phenotypic methods entirely due to technical complexity and interpretation challenges, it provides valuable insights for antimicrobial stewardship programs.
Figure 2: Evolution of diagnostic testing from traditional culture to advanced genotypic resistance detection.
Essential Research Reagents and Materials
Successful implementation of NAAT technologies requires specific reagent systems tailored to each application. The table below details key research solutions and their functions in nucleic acid amplification testing.
Table 2: Essential Research Reagent Solutions for NAAT Development
| Reagent/Category | Specific Examples | Function & Application | Experimental Notes |
|---|---|---|---|
| Nucleic Acid Extraction Kits | MagNA Pure 96 DNA and Viral NA Large Volume Kit [40], Qiagen DNeasy Blood & Tissue Kit [40] [38], VAHTS Free-Circulating DNA Maxi Kit [33] | Isolation of DNA/RNA from clinical specimens; critical for assay sensitivity | wcDNA extraction shows superior sensitivity vs. cfDNA for mNGS [33] |
| PCR Master Mixes | Path-ID Multiplex One-Step RT-PCR Kit [40], TaqMan-based chemistries [37] | Enzymatic amplification with reverse transcription capability | Compatible with multiplex real-time platforms |
| Specific Primers/Probes | Species-specific oligonucleotides targeting bgt1, benA, ITS2, LEU2 genes [38], RdRp, N protein, M2 protein [36] | Target-specific amplification and detection | Designed with stringent specificity validation; ΔG values critical for multiplexing [38] |
| Internal Controls | Extraction & Inhibition Control (EIC), Universal Inhibition Control (UIC) [40], human RNase P gene [36] | Process control for extraction efficiency and amplification inhibition | Essential for distinguishing true negatives from assay failures |
| Transport Media | Universal Transport Medium (Libo) [35], ESwab Liquid Amies Collection System [40] | Sample preservation during storage and transport | Critical for maintaining nucleic acid integrity before testing |
| Digital PCR Reagents | Customized chemistries for Smart-Plexer workflow [37] | Enables amplification curve analysis for machine learning classification | Fundamental for data-driven multiplexing approaches |
NAAT technologies represent a dynamic and rapidly evolving field that continues to transform clinical microbiology diagnostics. From singleplex PCR to sophisticated multiplex panels and metagenomic sequencing, each approach offers distinct advantages for specific diagnostic scenarios. Multiplex real-time PCR excels in targeted syndromic testing with excellent sensitivity and specificity, while mNGS provides comprehensive unbiased detection at the cost of greater complexity and interpretation challenges. Innovations in digital PCR, machine learning, and computational assay design are pushing multiplexing capabilities beyond traditional limits, creating new possibilities for efficient, cost-effective pathogen detection. The ongoing integration of genotypic resistance testing further expands the clinical utility of NAAT platforms, enabling more targeted therapeutic interventions. As these technologies continue to mature, they promise to enhance diagnostic precision, outbreak management, and antimicrobial stewardship efforts in increasingly sophisticated healthcare environments.
The ongoing evolution of microbiological diagnostic techniques is characterized by a fundamental tension between conventional culture-based methods and emerging non-culture approaches. Within this landscape, Matrix-Assisted Laser Desorption/Ionization Time-of-Flight Mass Spectrometry (MALDI-TOF MS) has emerged as a transformative technology that bridges both paradigms. While it typically requires an initial cultivation step to obtain sufficient microbial biomass, it dramatically accelerates the subsequent identification process, reducing turnaround times from days to minutes [41]. This positions MALDI-TOF MS as a pivotal technology that maintains the reliability of culture-based methods while incorporating the speed advantages of non-culture techniques.
The technique operates on the principle of analyzing unique protein fingerprints, primarily from highly abundant ribosomal proteins, to generate spectral profiles that are compared against reference databases for microorganism identification [41]. Since its introduction into clinical microbiology laboratories over the past decade, MALDI-TOF MS has become a standard tool in developed healthcare systems, offering an unprecedented combination of rapidity, accuracy, and cost-effectiveness for pathogen identification [42]. This guide provides a comprehensive comparison of current MALDI-TOF MS systems, their performance characteristics against conventional methods, and detailed experimental protocols, contextualized within the broader framework of microbiological testing methodologies.
The global MALDI-TOF MS market reflects the technology's expanding adoption across diverse sectors. The market was valued at approximately $925 million in 2021 and is projected to reach $2.67 billion by 2033, growing at a compound annual growth rate of 9.24% [43]. This growth is fueled by the technology's proven utility in clinical diagnostics, pharmaceutical research, food safety, and environmental monitoring.
Commercial MALDI-TOF MS systems for microbial identification are dominated by several key manufacturers, each offering distinct systems and database configurations. Bruker Daltonics markets the Biotyper systems, bioMérieux offers the VITEK MS, and newer entrants include Zhuhai DL Biotech with the Smart MS series and Autof MS 1000 systems from Chinese manufacturers [42] [44]. The competitive landscape is evolving with increasing participation from manufacturers in Asia, potentially offering more cost-effective alternatives to established systems.
Table 1: Global MALDI-TOF MS Market Regional Analysis
| Region | Market Size (2021) | Projected Market Size (2033) | CAGR (2021-2033) | Key Characteristics |
|---|---|---|---|---|
| North America | $238.51 million | $709.19 million | 9.44% | Dominant market; high R&D spending; automated clinical workflows |
| Europe | $221.95 million | $660.04 million | 9.44% | Strong regulatory framework (IVDR); advanced research networks |
| Asia Pacific | $201.14 million | $554.26 million | 8.95% | Rapidly growing; government investments; expanding healthcare infrastructure |
| Middle East | $46.54 million | $145.58 million | 9.78% | Fastest growth rate; major healthcare infrastructure investments |
The technology's value proposition extends beyond initial identification to emerging applications such as antimicrobial resistance prediction, strain typing, and MALDI imaging [45]. These advancements are increasingly supported by artificial intelligence and machine learning algorithms that extract additional diagnostic information from spectral data [46] [45]. The continuous expansion of reference spectral databases has been crucial for improving identification accuracy, particularly for rare and highly pathogenic species [41].
Comparative Performance Analysis of MALDI-TOF MS Systems
System Comparison and Identification Rates
Independent evaluations provide critical data for laboratories considering MALDI-TOF MS implementation. A 2025 study directly compared the performance of the newer Smart MS 5020 system (Zhuhai DL Biotech) against the established Biotyper Microflex LT system (Bruker Daltonics) using 612 clinical isolates comprising gram-negative bacteria, gram-positive bacteria, anaerobes, and fungi [42] [47]. The results demonstrated remarkably high and comparable identification rates between both systems.
Table 2: Performance Comparison of MALDI-TOF MS Systems
| Performance Metric | Smart MS 5020 | Biotyper Microflex LT | Autof MS 1000 | Conventional Methods |
|---|---|---|---|---|
| Overall Identification Rate | 100% | 98.9% | 77.4% (Environmental isolates) | Varies by organism and method |
| Species-Level Identification Accuracy | 96.9% | 96.6% | 73.97% | Dependent on technician expertise |
| Genus-Level Concordance | 98.9% | 98.9% | 91.66% | Generally high for common pathogens |
| Species-Level Concordance | 97.2% | 97.2% | N/A | Challenging for closely related species |
| Turnaround Time | Minutes after colony growth | Minutes after colony growth | Minutes after colony growth | 24-48 hours or more after growth |
| Key Applications | Clinical isolate identification | Clinical isolate identification | Pharmaceutical environmental monitoring | Broad, but slower |
The high concordance rates between the Smart MS 5020 and Biotyper systems—98.9% at the genus level and 97.2% at the species level—establish the newer system as a viable alternative for clinical diagnostics [42]. Discrepant results or unidentified strains were resolved using 16S rRNA gene sequencing, confirming the accuracy of MALDI-TOF MS identifications in most cases.
Performance in Specialized Applications
MALDI-TOF MS demonstrates variable performance across different microbial groups and applications. In pharmaceutical environmental monitoring, the Autof MS 1000 system successfully identified 77.42% of 1,041 bacterial isolates from cleanroom environments, with genus-level and species-level accuracies of 91.66% and 73.97%, respectively, when compared to 16S rDNA sequencing [44]. The slightly lower rates compared to clinical systems may reflect the diverse and sometimes challenging environmental species included in the study.
For fungal identification, particularly relevant in the context of COVID-19-associated mucormycosis, MALDI-TOF MS has demonstrated exceptional performance. A 2025 study comparing conventional mycological methods with MALDI-TOF MS for identifying fungal isolates in mucormycosis cases found 100% concordance at the genus level, with MALDI-TOF MS providing rapid species-level identification that is particularly challenging using morphological methods alone [48]. The technology correctly identified Rhizopus arrhizus and Rhizopus microsporus as the predominant species, with confidence values of 99.9% [48].
For direct identification from blood cultures, multiple processing methods have been evaluated. A 2025 study on Candida species identification from simulated blood cultures found that short-term culture (incubating subcultures for 6 hours) provided the highest identification rate at 71.9%, compared to 59.6% for the Sepsityper kit and 57.3% for an in-house SDS lysis method [49]. However, when using specialized Mycosis blood culture bottles, the in-house method achieved 100% identification, highlighting how protocol and sample preparation significantly impact performance.
Experimental Protocols and Methodologies
Standard Microbial Identification Workflow
The fundamental workflow for MALDI-TOF MS-based microbial identification involves several standardized steps. First, microbial colonies are cultivated on appropriate solid agar media, typically for 24-48 hours depending on the growth characteristics of the organism [41]. For most bacterial identifications, a small amount of biomass (equivalent to 1-3 μL loops) is transferred directly to a target plate and overlaid with matrix solution (typically α-cyano-4-hydroxycinnamic acid dissolved in organic solvents) [41]. This "smear method" or intact cell technique is sufficient for most routine identifications.
For more complex samples or when enhanced spectral quality is required, a protein extraction protocol is employed. The standard ethanol-formic acid extraction method involves harvesting sufficient biomass, inactivating with ethanol, and then extracting with formic acid and acetonitrile to obtain soluble proteins [49] [48]. The extract is then spotted onto the target plate, air-dried, and overlaid with matrix solution.
For highly pathogenic bacteria requiring biosafety level 3 containment, a specialized trifluoroacetic acid (TFA) inactivation protocol has been developed and validated [41]. This method involves suspending bacterial samples in 80% TFA for 30 minutes, which completely inactivates even bacterial endospores while maintaining protein integrity for MALDI-TOF MS analysis [41].
Direct Identification from Blood Cultures
For rapid identification from positive blood culture bottles, several methods have been developed to overcome the challenge of host protein interference. The Sepsityper kit (Bruker Daltonics) employs a standardized protocol involving centrifugation, lysis buffer treatment, washing steps, and protein extraction [49]. In the evaluated protocol, 5 mL of blood culture broth was centrifuged, the pellet was treated with lysis buffer, washed, and then processed with formic acid and acetonitrile before MALDI-TOF MS analysis [49].
An in-house SDS-based lysis method has also been developed as an alternative to commercial kits. This protocol involves centrifuging 1.8 mL of blood culture broth, discarding the supernatant, and resuspending the pellet in sterile water [49]. After repeat centrifugation, the pellet is resuspended in 0.1% SDS and incubated at room temperature for 10 minutes to lyse blood cells. This SDS treatment is repeated, followed by ethanol washing and standard protein extraction with formic acid and acetonitrile [49].
Short-term culture represents an alternative approach that balances speed with identification quality. Positive blood culture broth is subcultured onto preheated solid agar media (such as Sabouraud Dextrose Agar) and incubated for only 6 hours [49]. The microbial growth is then harvested directly from the plate for standard MALDI-TOF MS analysis, providing high-quality spectra without blood-derived interference.
Database Importance and Spectral Libraries
The critical importance of comprehensive, high-quality reference databases cannot be overstated in MALDI-TOF MS-based identification. The performance of any system is directly dependent on the breadth and quality of its spectral libraries [41]. Commercial systems include validated databases covering many clinically relevant microorganisms, but gaps exist particularly for rare environmental species, highly pathogenic bacteria, and newly emerging pathogens.
To address these limitations, public databases have been developed, such as the open-access database from the Robert Koch Institute containing 11,055 spectra from 1,601 microbial strains and 264 species, with emphasis on highly pathogenic bacteria [41]. This database has been downloaded over 6,500 times and is also accessible through platforms like MicrobeNet hosted by the CDC [41]. The availability of such resources significantly enhances the identification capabilities for microorganisms not well-represented in commercial databases.
Database quality and appropriate updating protocols are essential for maintaining identification accuracy. Studies have documented misidentifications resulting from inadequate entries of highly pathogenic bacteria in commercial databases [41]. These errors not only impact patient treatment but also disrupt routine procedures in diagnostic facilities, highlighting the need for continuous database refinement and expansion.
The Scientist's Toolkit: Essential Research Reagents and Materials
Successful MALDI-TOF MS analysis requires specific reagents and materials optimized for the technique. The following table details key components essential for microbial identification workflows.
Table 3: Essential Research Reagents for MALDI-TOF MS Microbial Identification
| Reagent/Material | Function | Application Notes |
|---|---|---|
| α-cyano-4-hydroxycinnamic acid (HCCA) | Matrix compound that absorbs laser energy and facilitates sample ionization | Standard matrix for microbial identification; prepared in organic solvents (acetonitrile with TFA) [41] |
| Trifluoroacetic acid (TFA) | Protein extraction and inactivation agent | Critical for safe processing of highly pathogenic bacteria; complete inactivation of spores in 30 minutes [41] |
| Formic Acid | Protein solubilization and extraction | Standard component of extraction protocols; improves spectral quality for difficult samples [49] |
| Acetonitrile | Organic solvent for matrix preparation and protein extraction | Facilitates co-crystallization of matrix and analytes; HPLC grade recommended [41] |
| Ethanol | Cell washing and inactivation | Used in standard ethanol-formic acid extraction protocol; removes interfering substances [48] |
| SDS (Sodium Dodecyl Sulfate) | Lysis agent for blood cells in direct blood culture methods | Key component of in-house methods for direct identification from blood cultures [49] |
| Sabouraud Dextrose Agar | Fungal cultivation medium | Essential for growing fungal isolates prior to MALDI-TOF MS analysis [48] |
| Calibration Standards | Instrument mass accuracy calibration | Escherichia coli ATCC 8739 commonly used for system calibration [42] |
Emerging Applications and Future Directions
MALDI-TOF MS technology continues to evolve beyond basic microbial identification. One of the most promising developments is the application of machine learning to predict antimicrobial resistance (AMR) profiles directly from mass spectra. A 2025 study described a dual-branch neural network recommender system that can predict AMR profiles across multiple species and drugs, effectively serving as a drug recommendation system for infectious diseases [46]. This approach could significantly reduce the time to appropriate antibiotic therapy by predicting resistance directly from identification spectra.
MALDI imaging mass spectrometry is another rapidly advancing application, enabling spatial analysis of molecules directly in tissue sections [43] [45]. This technique allows researchers to visualize the distribution of drugs, metabolites, and proteins within biological samples, creating new opportunities for pharmacological research and clinical diagnostics.
The integration of artificial intelligence and cloud-based spectral analysis represents a significant trend in the field [43] [45]. These technologies enable more sophisticated data interpretation, continuous database updates, and improved identification accuracy, particularly for challenging microorganisms. The development of more compact, automated systems with simplified workflows is also making the technology accessible to smaller laboratories and decentralized testing facilities [45].
MALDI-TOF MS has firmly established itself as an essential technology that successfully bridges the paradigm between conventional culture-based methods and rapid non-culture diagnostics. The technology offers an optimal balance of accuracy, speed, and cost-effectiveness for microbial identification across diverse applications from clinical diagnostics to pharmaceutical quality control. Performance comparisons demonstrate that newer systems like the Smart MS 5020 achieve identification rates comparable to established platforms, providing laboratories with viable alternatives for implementation.
The ongoing expansion of spectral databases, development of specialized protocols for challenging samples, and emergence of advanced applications like resistance prediction and tissue imaging ensure that MALDI-TOF MS will remain a cornerstone technology in microbiological testing. As the field advances, integration with artificial intelligence and continued refinement of workflows will further enhance the value of this versatile analytical platform for researchers, clinical microbiologists, and drug development professionals navigating the complex landscape of culture and non-culture diagnostic methodologies.
The detection and identification of microorganisms have long relied on culture-dependent methods, which involve growing bacteria or viruses on specific nutrient media. However, the limitations of these approaches—including lengthy processing times (often 24-48 hours or more), an inherent inability to culture many microorganisms, and limited scalability for rapid diagnostics—have driven the development of sophisticated non-culture methods [50]. Among these, immunoassays have emerged as powerful tools that leverage the specific binding between antibodies and antigens to detect pathogens directly, often within hours or even minutes [51].
Immunoassays represent a cornerstone of modern diagnostic microbiology, filling a critical niche between molecular methods like PCR and traditional culture techniques. These assays can be broadly categorized into two principal classes: antigen detection tests, which identify specific microbial proteins, and serological tests, which detect host-derived antibodies produced in response to an infection [51]. The fundamental principle underlying all immunoassays is the exquisite specificity of antibody-antigen interactions, which allows for the precise identification of targets even within complex biological matrices like serum, plasma, or saliva [52]. This guide provides a comprehensive, data-driven comparison of immunoassay technologies, their performance characteristics, and experimental protocols, contextualized within the broader paradigm of culture versus non-culture diagnostic approaches.
Immunoassay Fundamentals and Methodologies
Core Principles and Technical Configurations
Immunoassays function on the principle of specific immunochemical recognition, typically utilizing monoclonal or polyclonal antibodies raised against target antigens. The choice of assay format depends on factors including the molecular size of the analyte, required sensitivity, and the sample matrix [52]. The most common formats include:
- Sandwich Immunoassays: Used for larger antigens with multiple epitopes. The analyte is "sandwiched" between a capture antibody immobilized on a solid surface and a detection antibody labeled with an enzyme, fluorophore, or other signal-generating molecule [53].
- Competitive Immunoassays: Employed for small molecules with a single epitope. The sample analyte competes with a labeled reference analyte for a limited number of antibody binding sites [52].
- Indirect Immunoassays: Typically used for antibody detection (e.g., serological testing), where the target antibody from a sample binds to an immobilized antigen, and is subsequently detected by a labeled secondary antibody specific to the Fc region of the primary antibody [51].
The critical success factors in developing any immunoassay include the specificity and affinity of antibody reagents, the choice of detection system, and optimization of blocking and washing steps to minimize non-specific binding [52].
Detection Platforms and Signal Amplification
Multiple detection modalities are employed in immunoassays, each with distinct advantages in sensitivity, dynamic range, and equipment requirements:
- Colorimetric Detection: Utilizes enzymes like Horseradish Peroxidase (HRP) or Alkaline Phosphatase (AP) that convert substrates into colored products (e.g., TMB, OPD, ABTS), measurable by absorbance spectrophotometry [52]. This is the basis for traditional ELISA and lateral flow tests.
- Chemiluminescence Immunoassay (CLIA): Relies on light emission from a chemical reaction, offering enhanced sensitivity over colorimetric methods [51]. Common platforms include the DiaSorin LIAISON series.
- Electrochemiluminescence Immunoassay (ECLIA): A advanced form of chemiluminescence where the reaction is initiated by electrochemical stimulation, as used in Roche's Elecsys systems [54].
- Fluorescence Immunoassays (FIA): Employ fluorescent labels detected with fluorometers, providing good sensitivity and suitability for multiplexing [53].
- Surface-Enhanced Raman Spectroscopy (SERS): Uses noble metal nanostructures to dramatically enhance Raman scattering signals, achieving exceptional sensitivity—reportedly 1.5-2 orders of magnitude lower limits of detection compared to fluorescence methods [53].
Signal amplification strategies can further enhance detection sensitivity. The biotin-streptavidin system is widely used due to the high affinity of this interaction. Recent advances include streptavidin-polymerized HRP (SA-PolyHRP), which conjugates multiple HRP enzymes to a single streptavidin molecule, significantly increasing the enzyme payload per binding event and resulting in dramatic signal amplification. Studies have shown SA-PolyHRP can enhance sensitivity by 7.86-fold for E. coli O157:H7 detection compared to conventional SA-HRP [55].
Table 1: Key Research Reagent Solutions for Immunoassay Development
| Reagent Category | Specific Examples | Function in Assay |
|---|---|---|
| Solid Supports | Nunc MaxiSorp plates, Pall Supor membranes | High-binding surfaces for immobilization of capture antibodies or antigens |
| Blocking Buffers | 1% BSA, 10% host serum, Casein buffer, Protein-free blockers | Reduce non-specific binding to improve signal-to-noise ratio |
| Enzyme Conjugates | HRP, Alkaline Phosphatase, SA-PolyHRP | Catalyze substrate conversion for signal generation and amplification |
| Detection Substrates | TMB (colorimetric), Supersignal (chemiluminescent), pNpp (ALP substrate) | Enzyme substrates that generate measurable signals |
| Magnetic Particles | Streptavidin-coated magnetic beads, Carboxyl-modified MPs | Solid phase for separation and concentration of target analytes |
Performance Comparison of Immunoassay Platforms
Diagnostic Accuracy of Serological Assays
Recent large-scale meta-analyses have provided comprehensive comparisons of commercial serological assays, particularly in the context of COVID-19 diagnostics. Using reverse transcriptase-PCR (RT-PCR) as the reference standard, these studies have evaluated the diagnostic accuracy of various platforms through metrics including diagnostic odds ratio (DOR), sensitivity, and specificity [54].
Table 2: Comparative Performance of Commercial Serological Assays for COVID-19
| Assay Name (Manufacturer) | Target Antibody & Antigen | Technology Platform | Diagnostic Odds Ratio (DOR) |
|---|---|---|---|
| Elecsys Anti-SARS-CoV-2 (Roche) | Total Antibody (Anti-N) | ECLIA | 1701.56 |
| Elecsys Anti-SARS-CoV-2 N (Roche) | Total Antibody (Anti-N) | ECLIA | 1022.34 |
| Abbott SARS-CoV-2 IgG (Abbott) | IgG (Anti-N) | CMIA | 542.81 |
| Euroimmun Anti-SARS-CoV-2 S1-IgG (Euroimmun) | IgG (Anti-S1) | ELISA | 190.45 |
| LIAISON SARS-CoV-2 S1/S2 IgG (DiaSorin) | IgG (Anti-S1/S2) | CLIA | 178.73 |
| Euroimmun Anti-SARS-CoV-2 N-IgG (Euroimmun) | IgG (Anti-N) | ELISA | 82.63 |
| Euroimmun Anti-SARS-CoV-2 IgA (Euroimmun) | IgA (Anti-S1) | ELISA | 45.91 |
The data reveal clear performance differentials between assay formats. Total antibody assays (predominantly IgG) demonstrated the highest accuracy, followed by IgG-specific assays, with IgA performing least effectively [54]. When classified by detection technology, electrochemiluminescence (ECLIA) and chemiluminescent microparticle immunoassays (CMIA) showed superior diagnostic performance compared with chemiluminescence immunoassays (CLIA) and enzyme-linked immunosorbent assays (ELISA) [54]. Furthermore, assays targeting the nucleocapsid (N) antigen showed significantly higher diagnostic efficacy (pooled DOR: 604.29) compared to those targeting the spike protein S1 subunit (pooled DOR: 119.88) or combined S1/S2 antigens (pooled DOR: 178.73) [54].
Real-World Clinical Performance and Limitations
Independent evaluations of serological assays in clinical settings have corroborated these findings while highlighting important considerations for test selection. A 2021 study evaluating five commercial SARS-CoV-2 antibody tests found that IgG assays generally showed good reliability with sensitivity >80% and specificity >97%, though sensitivity was lower (70.8-80%) within the first two weeks after symptom onset [56]. IgM assays demonstrated notably lower sensitivity (47.6-54.6%), while a specific IgA ELISA showed good sensitivity (84.3%) but suboptimal specificity (81.7%) and a substantial rate (11.7%) of indeterminate results [56].
A 2025 comparative study of six COVID-19 serology assays further demonstrated high positive percent agreement (≥85%) and negative percent agreement (≥90%) across platforms, with the Meso Scale Diagnostics (MSD) anti-spike IgG assay achieving perfect (100%) agreement in both categories [57]. The limits of detection (LOD) between assays ranged from 9.9 to 62.0 BAU/mL, with the Abbott anti-spike RBD assay showing the lowest LOD [57]. This study also highlighted that certain assays could detect antibodies across all major variants of concern (Alpha, Beta, Gamma, Delta, and Omicron), a crucial consideration for evolving infectious diseases [57].
Experimental Protocols for Immunoassay Implementation
Protocol 1: Double-Antibody Sandwich ELISA for Pathogen Detection
This protocol outlines the development of a sensitive sandwich ELISA for direct detection of bacterial pathogens, such as E. coli O157:H7 and Salmonella Typhimurium, incorporating SA-PolyHRP for signal enhancement [55].
Key Reagents and Materials:
- Capture antibody: Specific polyclonal or monoclonal antibody against target pathogen
- Detection antibody: Biotinylated antibody recognizing a different epitope on the target pathogen
- Coating buffer: 50 mM sodium bicarbonate, pH 9.6, or PBS (pH 8.0)
- Blocking buffer: 1% BSA or 10% host serum in TBS or PBS
- Washing buffer: PBS or TBS with 0.05% Tween-20 (PBST or TBST)
- Streptavidin-PolyHRP conjugate
- TMB substrate solution
- Stop solution: 2M H₂SO₄
- Nunc MaxiSorp high-binding 96-well plates
Procedure:
- Coating: Dilute capture antibody in coating buffer to optimal concentration (typically 1-10 µg/mL). Add 100 µL per well to a 96-well microplate. Incubate overnight at 4°C or for 2 hours at 37°C.
- Washing: Wash plate three times with wash buffer (300 µL/well) using a plate washer or manual pipetting to remove unbound antibody.
- Blocking: Add 200-300 µL of blocking buffer per well. Incubate for 1-2 hours at room temperature or 37°C. Wash plate three times.
- Sample Incubation: Add 100 µL of sample or bacterial suspension per well. Incubate for 1-2 hours at 37°C. Wash plate 3-5 times to remove unbound antigen.
- Detection Antibody Incubation: Add 100 µL of biotinylated detection antibody at optimized concentration. Incubate for 1 hour at 37°C. Wash plate 3-5 times.
- Enzyme Conjugate Incubation: Add 100 µL of SA-PolyHRP conjugate at manufacturer-recommended dilution. Incubate for 30-60 minutes at room temperature. Wash plate 5 times thoroughly.
- Signal Development: Add 100 µL of TMB substrate per well. Incubate in dark for 10-30 minutes at room temperature.
- Reaction Termination: Add 50-100 µL of stop solution per well.
- Measurement: Read absorbance at 450 nm within 30 minutes using a plate reader.
Optimization Notes: Critical parameters requiring optimization include capture antibody concentration, detection antibody concentration, blocking agent type (BSA, skim milk, casein), and incubation times. The SA-PolyHRP enhancement can significantly improve sensitivity compared to conventional SA-HRP, with documented LODs of 1.4 × 10⁴ CFU/mL for E. coli O157:H7 and 6.0 × 10³ CFU/mL for S. Typhimurium [55].
Protocol 2: Magneto-Immunoassay for Pathogen Concentration and Detection
This protocol combines immunomagnetic separation with sensitive detection for pathogen concentration from complex matrices, particularly useful for foodborne pathogens or environmental samples [58].
Key Reagents and Materials:
- Magnetic beads (2.8 µm diameter) coated with streptavidin or specific antibodies
- Biotinylated capture antibodies specific to target pathogen
- External magnetic separation device
- Sample matrix (food homogenate, clinical specimen, environmental water)
- Washing buffers (PBS with 0.05% Tween-20)
- Detection antibodies with appropriate labels (HRP, fluorescent dyes)
Procedure:
- Bead Preparation: Incubate streptavidin-coated magnetic beads with biotinylated capture antibodies for 30-60 minutes at room temperature with gentle mixing. Wash twice with buffer to remove unbound antibodies.
- Sample Incubation: Add functionalized magnetic beads to the sample matrix. Incubate for 30-60 minutes with continuous mixing to allow pathogen capture.
- Magnetic Separation: Place the sample tube in a magnetic separator for 2-5 minutes to concentrate bead-pathogen complexes. Carefully remove and discard the supernatant.
- Washing: Resuspend the bead-pathogen complex in washing buffer. Repeat magnetic separation and supernatant removal 2-3 times to eliminate matrix components and non-specifically bound materials.
- Detection: Resuspend washed beads in appropriate buffer containing detection antibodies. After incubation and washing, proceed with detection appropriate to the label:
- For HRP: Add chemiluminescent or colorimetric substrate and measure signal
- For fluorescence: Measure fluorescence intensity with appropriate instrumentation
- For electrochemical detection: Perform impedance spectroscopy measurements
- Analysis: Quantify pathogen concentration based on standard curve prepared from known concentrations.
Technical Notes: The magnetic force acting on superparamagnetic particles is described by F = (V·Δχ/μ₀)(B·∇)B, where V is particle volume, Δχ is susceptibility difference, μ₀ is permeability of free space, and B is magnetic induction [58]. This protocol can achieve detection limits as low as 10² CFU/mL when combined with sensitive detection methods like electrochemical impedance spectroscopy or long-range surface plasmon resonance [58].
Comparative Analysis: Culture-Dependent vs. Immunoassay Methods
The distinction between culture-dependent and culture-independent methods represents a fundamental dichotomy in microbiological testing. Culture-dependent methods have been the historical gold standard, relying on the growth of microorganisms on selective or non-selective media, with tools ranging from simple agar plates to specialized field tests like Biological Activity Reaction Tests (BART) [50]. While these methods provide viable organisms for further characterization and antibiotic susceptibility testing, they suffer from significant limitations: they are time-consuming (typically requiring 24-48 hours for results), cannot detect viable but non-culturable organisms, and have limited throughput [50].
Immunoassays address many of these limitations by directly detecting microbial antigens or host immune responses without requiring organism growth. The comparative advantages include:
- Speed: Most immunoassays provide results within 15 minutes to 4 hours, compared to 24-48 hours for culture methods [51] [55].
- Sensitivity: Modern enhanced immunoassays can achieve detection limits as low as 10³-10⁴ CFU/mL, with some formats reaching 10² CFU/mL or lower when combined with pre-enrichment or concentration steps [58] [55].
- Throughput: Automated platforms like CLIA and ECLIA systems can process hundreds of samples per hour with minimal manual intervention [54] [56].
- Cost-Effectiveness: Immunoassays generally require less specialized training and equipment than molecular methods like PCR, making them accessible in diverse settings [51].
However, immunoassays have their own limitations, including the potential for cross-reactivity with related species, dependence on the quality of antibody reagents, inability to provide antibiotic susceptibility profiles, and in serological testing, the window period between infection and detectable antibody response [51] [56]. The optimal approach often involves a complementary strategy, using rapid immunoassays for initial screening and culture methods for confirmation and additional characterization when needed.
Immunoassays represent a sophisticated and versatile class of non-culture methods that have revolutionized microbial detection and serological evaluation. The data clearly demonstrate significant performance differences between platforms, with ECLIA and CMIA technologies generally outperforming traditional ELISA formats, particularly for serological applications [54]. The choice between antigen detection and serological testing, as well as the selection of specific assay formats, must be guided by the clinical or research question, the characteristics of the target pathogen, and the required balance between sensitivity, specificity, speed, and throughput.
As the field advances, emerging technologies like SERS-based immunoassays and enhanced signal amplification systems like SA-PolyHRP promise even greater sensitivity and multiplexing capabilities [53] [55]. Nevertheless, immunoassays are most powerful when viewed as part of an integrated diagnostic approach that acknowledges the complementary strengths of both culture and non-culture methods. This balanced perspective enables researchers and clinicians to select the optimal methodological strategy based on specific diagnostic needs, ultimately enhancing both patient care and public health responses to infectious disease threats.
The diagnosis and management of bacterial infections have long been limited by reliance on conventional culture-based techniques, which can fail to identify unculturable, fastidious, or viable but non-culturable bacteria [59] [60]. In recent years, high-throughput sequencing technologies have revolutionized microbial analysis by enabling direct examination of microbial communities without the need for cultivation [61] [62]. Among these technologies, 16S rRNA gene sequencing and shotgun metagenomic sequencing have emerged as the two primary culture-independent approaches for profiling microbial populations [63] [64]. These methods have transformed our understanding of microbial diversity in diverse environments, from human tissues to industrial ecosystems [50] [60]. This guide provides an objective comparison of these sequencing-based methods, focusing on their performance characteristics, experimental requirements, and applications within microbiological research.
Technical Foundations: Core Methodologies and Workflows
16S rRNA Gene Sequencing
16S rRNA gene sequencing is a targeted amplicon sequencing approach that exploits the presence of the 16S ribosomal RNA gene in all bacteria and archaea [65] [64]. The methodology involves:
- DNA Extraction: Genomic DNA is isolated from clinical or environmental samples using commercial kits such as the PureLink Microbiome DNA Purification Kit [66].
- PCR Amplification: Specific hypervariable regions (V1-V9) of the 16S rRNA gene are amplified using universal primers. Common targets include the V4 region or V3-V4 regions [61] [50].
- Library Preparation: Amplified products are barcoded, cleaned, and pooled for multiplexed sequencing [64].
- Sequencing: Platforms including Illumina, PacBio, and Oxford Nanopore are used, with choice affecting read length and accuracy [61] [59].
- Bioinformatic Analysis: Processed sequences are clustered into operational taxonomic units (OTUs) and classified against databases like SILVA or Greengenes using pipelines such as QIIME or MOTHUR [50] [64].
Shotgun Metagenomic Sequencing
In contrast to the targeted approach of 16S sequencing, shotgun metagenomics involves:
- DNA Extraction: Total genomic DNA is extracted, often with additional steps to remove host DNA when working with low-microbial-biomass samples [67].
- Fragmentation and Library Preparation: DNA is randomly fragmented, and adapters are ligated without target-specific amplification. Tagmentation may be used for efficient fragmentation and tagging [64].
- Sequencing: All DNA fragments are sequenced at high depth, generating billions of reads representing the entire genetic content of the sample [63] [67].
- Bioinformatic Analysis: Complex workflows involve quality filtering, assembly, gene prediction, and functional annotation using tools like MetaPhlAn and HUMAnN, with alignment to comprehensive genomic databases [64].
The fundamental distinction lies in the targeted versus untargeted nature of these approaches, with 16S sequencing focusing on a specific phylogenetic marker and metagenomics capturing the entire genetic diversity present in a sample.
Comparative Performance Analysis
Taxonomic Resolution and Coverage
Multiple studies have systematically compared the taxonomic profiling capabilities of 16S rRNA gene sequencing and shotgun metagenomics:
Table 1: Taxonomic Resolution and Coverage Comparison
| Aspect | 16S rRNA Sequencing | Shotgun Metagenomics |
|---|---|---|
| Taxonomic Coverage | Bacteria and Archaea only [63] [64] | All domains: Bacteria, Archaea, Viruses, Fungi, Protists [63] [64] |
| Genus-Level Identification | Reliable (96% accuracy) [59] | Highly reliable [64] |
| Species-Level Identification | Limited (87.5% accuracy), high false-positive rate [59] | Reliable, with proper sequencing depth [63] [64] |
| Strain-Level Differentiation | Not possible [64] | Possible with sufficient sequencing depth [64] |
| Multi-Kingdom Analysis | Requires separate approaches (ITS for fungi, 18S for protists) [64] | Simultaneous identification of all kingdoms [63] |
A 2025 comparative evaluation of sequencing platforms demonstrated that both PacBio and Oxford Nanopore Technologies (ONT) provided comparable assessments of bacterial diversity in soil microbiomes, with PacBio showing slightly higher efficiency in detecting low-abundance taxa [61]. The study found that despite differences in sequencing accuracy, ONT produced results that closely matched those of PacBio, suggesting that ONT's inherent sequencing errors do not significantly affect the interpretation of well-represented taxa [61].
Functional Profiling Capabilities
A critical distinction between these methods lies in their ability to profile microbial function:
Table 2: Functional Profiling Capabilities
| Functional Aspect | 16S rRNA Sequencing | Shotgun Metagenomics |
|---|---|---|
| Functional Gene Detection | Indirect prediction only (e.g., PICRUSt) [64] | Direct detection of functional genes and pathways [63] [64] |
| Antimicrobial Resistance Genes | Not detectable | Direct identification possible [67] |
| Virulence Factors | Not detectable | Direct characterization [67] |
| Metabolic Pathway Analysis | Inferred from taxonomy | Direct reconstruction from genomic data [64] |
| Novel Gene Discovery | Not possible | Possible through assembly and annotation [64] |
Shotgun metagenomics provides comprehensive data on the functional potential of microbial communities, enabling researchers to identify antimicrobial resistance genes, virulence factors, and metabolic pathways directly from sequencing data [67]. In contrast, 16S sequencing can only infer function through predictive tools like PICRUSt, which extrapolate function from taxonomic assignments [64].
Diagnostic Performance in Clinical Settings
Comparative studies have evaluated the performance of these methods in clinical diagnostics:
Table 3: Diagnostic Performance Comparison
| Parameter | 16S rRNA Sequencing | Shotgun Metagenomics |
|---|---|---|
| Detection Rate | 74.3% in culture-negative samples [66] | Higher species identification (80 species vs 65-71 for tNGS) [67] |
| Polymicrobial Detection | 5.7% detection rate in culture-negative samples [66] | Superior for complex communities [67] |
| Turnaround Time | ~20 hours [67] | 20-48 hours [67] [62] |
| Cost per Sample | ~$50 USD [64] | Starting at ~$150 USD [64] |
| Host DNA Interference | Low (PCR enriches bacterial DNA) [64] | High (requires host depletion or deep sequencing) [64] |
A 2024 study evaluated 16S-based metagenomic sequencing for diagnosing pathogens in culture-negative clinical samples, reporting a 74.3% detection rate across various medical settings, with 68.6% monomicrobial and 5.7% polymicrobial infections detected [66]. The most frequently identified microorganisms were Cutibacterium acnes (11%), Staphylococcus epidermidis (10.4%), and Staphylococcus aureus (9.5%) [66].
A comprehensive 2025 comparison of metagenomic and targeted sequencing methods for lower respiratory infections found that metagenomic NGS identified the highest number of species (80 species), compared to 71 species for capture-based tNGS and 65 species for amplification-based tNGS [67]. However, the capture-based targeted approach demonstrated the highest diagnostic accuracy (93.17%) and sensitivity (99.43%) [67].
Experimental Design and Methodological Considerations
Workflow Comparison
The experimental workflows for 16S rRNA sequencing and shotgun metagenomics differ significantly in their key steps:
Key Research Reagent Solutions
Successful implementation of these sequencing approaches requires specific research reagents and platforms:
Table 4: Essential Research Reagents and Platforms
| Application | Essential Solutions | Function | Examples/Providers |
|---|---|---|---|
| DNA Extraction | Microbial DNA Kits | Efficient lysis and purification of microbial DNA | PureLink Microbiome DNA Purification Kit [66], Quick-DNA Fecal/Soil Microbe Microprep Kit [61] |
| Host DNA Depletion | Nuclease Treatments | Selective removal of host DNA to improve microbial signal | Benzonase treatment [67] |
| 16S Amplification | Primer Sets | Target-specific amplification of variable regions | 27F/1492R for full-length 16S [61], V4 primers 515F/806R [50] |
| Library Preparation | Library Prep Kits | Fragmentation, adapter ligation, and barcoding | Ion Plus Fragment Library Kit [66], SMRTbell Prep Kit (PacBio) [61] |
| Sequencing | Sequencing Platforms | High-throughput DNA sequencing | Illumina MiSeq/NextSeq [50] [67], PacBio Sequel IIe [61], Ion GeneStudio S5 [66] |
| Bioinformatics | Analysis Pipelines | Data processing, taxonomy assignment, functional analysis | QIIME, MOTHUR [64], MetaPhlAn, HUMAnN [64] |
Sample Type Considerations
The optimal sequencing method depends heavily on sample type and research objectives:
- High-host-DNA samples (tissues, blood): 16S sequencing is advantageous due to PCR enrichment of bacterial targets, reducing host background [64].
- Low-biomass samples: Both methods require careful optimization, with 16S potentially more sensitive due to target amplification [59].
- Complex microbial communities (soil, gut): Shotgun metagenomics provides more comprehensive functional insights and multi-kingdom profiling [61] [64].
- Clinical diagnostics: 16S is sufficient for bacterial identification, while shotgun metagenomics detects viruses, fungi, and resistance genes [66] [62].
Integration with Culture-Based Methods
Despite advances in sequencing technologies, traditional culture-based methods retain importance in microbiological testing. A 2014 comparative analysis of bronchoalveolar lavage fluid specimens demonstrated that bacterial culture was largely effective in discriminating acute infection from its absence, with culture-independent techniques providing complementary information for unculturable or fastidious organisms [60].
The relationship between culture-dependent and culture-independent methods can be visualized as follows:
A 2024 study of industrial water samples highlighted how next-generation sequencing complemented traditional culture-dependent methods like Biological Activity Reaction Tests (BARTs), identifying microbial populations that were present in the original sample but not recovered in culture-dependent tests [50]. This integration of methods provides a more comprehensive understanding of microbial community dynamics.
The choice between 16S rRNA gene sequencing and shotgun metagenomics depends on research goals, budget, and sample characteristics:
- Choose 16S rRNA sequencing when: Research questions focus specifically on bacterial and archaeal communities; budget constraints are significant; sample types contain high host DNA; and genus-level taxonomic resolution is sufficient [64].
- Choose shotgun metagenomics when: Comprehensive multi-kingdom profiling is required; functional gene content and metabolic pathways are of interest; species or strain-level resolution is necessary; and sufficient sequencing depth can be achieved [63] [64].
For clinical diagnostics, 16S-based metagenomic sequencing significantly enhances pathogen detection in culture-negative samples, with one study reporting a 74.3% detection rate where conventional cultures failed [66]. Meanwhile, shotgun metagenomics excels in detecting rare, novel, or unexpected pathogens and providing comprehensive antimicrobial resistance profiling [67] [62].
As sequencing technologies continue to evolve and costs decrease, the integration of both targeted and untargeted sequencing approaches with traditional culture methods will provide the most comprehensive understanding of microbial communities across research and diagnostic contexts.
The diagnostic landscape for infectious diseases is undergoing a profound transformation, moving away from traditional culture-based methods that have been the cornerstone of microbiology for over a century toward rapid, syndrome-based molecular testing. Traditional microbial culture, while foundational, presents significant limitations including lengthy turnaround times (often 24-72 hours), suboptimal sensitivity for fastidious organisms, and compromised performance in patients who have received empirical antibiotics [68] [69]. Syndrome-based testing represents a innovative approach that uses multiplex molecular assays to simultaneously test for multiple pathogens—viruses, bacteria, and parasites—that cause similar clinical symptoms within a single automated platform [70] [71]. This paradigm shift offers the potential for rapid pathogen identification, improved antimicrobial stewardship, and enhanced patient outcomes through timely, targeted therapeutic interventions.
The fundamental thesis underlying this transition recognizes that while culture methods provide valuable phenotypic data including antimicrobial susceptibility profiles, the delayed results often render them clinically less actionable than rapid molecular alternatives. Non-culture methods, particularly syndromic multiplex panels, next-generation sequencing, and digital PCR technologies, address critical diagnostic gaps by offering unprecedented speed, sensitivity, and comprehensive pathogen detection [68] [72]. This guide objectively compares the performance characteristics of these emerging technologies against traditional methods and competing platforms across four critical infection syndromes: respiratory, gastrointestinal, urinary, and bloodstream infections.
Comparative Performance Data Across Infection Syndromes
Table 1: Overall Performance Characteristics of Syndromic Testing Platforms by Infection Type
| Infection Syndrome | Testing Platform/ Method | Sensitivity (%) | Specificity (%) | Turnaround Time | Key Advantages |
|---|---|---|---|---|---|
| Respiratory | BioFire FilmArray | 98.4 (PPA)* | N/R | ~1 hour | High multiplexing, minimal hands-on time [73] |
| QIAstat-Dx | 93.8 (PPA)* | N/R | ~70 minutes | Provides CT values [73] | |
| ePlex | Reference | N/R | ~1.5 hours | Automated sample-to-answer [73] | |
| Gastrointestinal | QIAstat-Dx GIP | 91 | 95 | 70 minutes | 24 targets, CT values provided [74] |
| BioFire FilmArray GIP | N/R | N/R | 1 hour | Increased positivity rate vs. culture (32% vs. 6.7%) [70] | |
| Bloodstream | Molecular BCID Panels | 92-99 | 99-100 | 1.58 hours | Reduced time to optimal therapy (4.65h vs 14.68h) [70] [72] |
| Traditional Culture | N/A | N/A | 15.1 ± 10.4 hours (TTPC) | Gold standard, provides AST [68] | |
| Central Nervous System | mNGS | 86.6% detection rate | N/R | 16.8 ± 2.4 hours | Unbiased pathogen detection [68] |
| ddPCR | 78.7% detection rate | N/R | 12.4 ± 3.8 hours | Fastest turnaround [68] | |
| Traditional Culture | 59.1% detection rate | N/R | 22.6 ± 9.4 hours | Affected by prior antibiotics [68] |
*PPA: Positive Percent Agreement compared to ePlex as reference [73]
Table 2: Technical Comparison of Emerging Non-Culture Methodologies
| Technology | Mechanism | Throughput | Pathogen Coverage | Resistance Detection | Relative Cost |
|---|---|---|---|---|---|
| Multiplex PCR Panels | Simultaneous amplification of multiple pathogen-specific targets | Moderate | Targeted (20-30 pathogens) | Limited resistance markers | Medium |
| mNGS | High-throughput sequencing of all nucleic acids in sample | Low | Comprehensive, unbiased | Can detect resistance genes | High |
| ddPCR | Partitioning sample into thousands of droplets for absolute quantification | Low | Targeted (single to few pathogens) | Can detect resistance mutations | Medium |
| Metagenomic Sequencing | Shotgun sequencing of all microbial DNA | Low | Most comprehensive | Broad resistance gene detection | Highest |
Respiratory Infection Testing
Clinical Need and Technological Advancements
Respiratory tract infections represent a substantial global health burden, causing millions of physician visits annually and posing particular risks to immunocompromised, pediatric, and elderly populations [71]. The diagnostic challenge stems from the similarity of clinical presentations across diverse pathogens including influenza, SARS-CoV-2, RSV, and bacterial pathogens like Bordetella pertussis and Mycoplasma pneumoniae [71]. The phenomenon of "tripledemic" circulation of flu, COVID-19, and RSV has further emphasized the need for comprehensive testing approaches that can accurately distinguish between these pathogens to guide appropriate therapy [71].
Syndromic testing platforms for respiratory infections have demonstrated significant improvements over individual pathogen tests or small multiplex panels. These systems consolidate testing for numerous viral and bacterial targets into a single compiled multiplex test, requiring only one patient sample and reducing the need for repeat testing [71]. This approach conserves valuable laboratory resources and staff capacity while providing clinicians with comprehensive results that directly inform treatment decisions, such as the appropriate use of antivirals or the avoidance of unnecessary antibiotics for viral infections [71].
Comparative Performance Data
Recent comparative studies have evaluated the relative performance of leading syndromic respiratory panels. A retrospective comparison of three automated multiplex PCR platforms—BioFire FilmArray, QIAstat-Dx, and ePlex—revealed strong overall agreement with positive percent agreement of 98.4% for BioFire compared to ePlex, and 93.8% for QIAstat-Dx compared to ePlex [73]. The investigation identified BioFire as the platform with the highest relative sensitivity, though all platforms demonstrated comparable performance and suitability for syndromic testing of respiratory samples [73].
The implementation of syndromic respiratory testing has demonstrated tangible clinical benefits, particularly in antimicrobial stewardship. Studies have shown that major antibiotic overuse occurs in up to 37% of children and 83% of adults with viral upper respiratory tract infections [71]. Rapid syndromic testing significantly contributes to antibiotic stewardship by reducing inappropriate prescriptions for viral infections, a critical intervention in combating antimicrobial resistance (AMR), which was associated with approximately 1.27 million global deaths in 2019 alone [71].
Figure 1: Workflow for Syndromic Respiratory Testing Platforms
Gastrointestinal Infection Testing
Diagnostic Challenges and Solution Requirements
Infectious gastroenteritis represents a significant global health burden, with an estimated incidence of 0.29 episodes per person-year in the Netherlands alone [74]. While most episodes are self-limiting in healthy individuals, persistent or severe infections can lead to hospitalization, particularly in infants, the elderly, and immunocompromised patients who face increased risk of dehydration and complications [74]. Traditional diagnostic approaches for gastrointestinal infections have relied on stool culture, antigen testing, and microscopy, but these methods present limitations in sensitivity, turnaround time, and the ability to detect multiple pathogens simultaneously.
Syndromic gastrointestinal panels address these challenges by combining nucleic acid extraction, amplification, and detection of a wide range of viral, bacterial, and parasitic enteropathogens in a single, automated test [74]. These systems offer a streamlined sample-to-answer workflow with turnaround times of approximately 70 minutes, making them suitable for both centralized laboratories and decentralized point-of-care testing environments [74]. The comprehensive nature of these panels is particularly valuable for detecting co-infections and identifying pathogens that are difficult to culture or require specialized growth conditions.
Platform Performance Characteristics
The QIAstat-Dx Gastrointestinal Panel (GIP) represents one of the newer additions to the syndromic testing landscape, offering simultaneous detection of 24 bacterial, viral, and parasitic enteropathogens with results in 70 minutes [74]. Performance evaluations comparing the QIAstat-Dx GIP assay to laboratory-developed real-time PCR assays (LDTs) demonstrated that the GIP assay detected 91% (97/107) of enteropathogens identified by LDTs, with overall agreement increasing to 95% when excluding discrepant results with high cycle threshold values (CT >35) [74]. Notably, the GIP assay detected 42 additional enteropathogens that were not detected or tested by LDTs, though 35 of these were diarrheagenic Escherichia coli targets whose clinical relevance requires careful interpretation [74].
Comparative studies of syndromic gastrointestinal panels have demonstrated their significant impact on diagnostic yield. Implementation of the BioFire FilmArray Gastrointestinal Panel increased stool positivity rates from 6.7% with conventional methods to 32% [70]. This enhanced detection capability translated into meaningful clinical outcomes, with patients assessed via multiplex PCR being less likely to undergo endoscopy (9.6% versus 8.4%) and less likely to be prescribed antibiotics (40.9% versus 36.2%) [70].
Table 3: Key Enteropathogens Detected by Syndromic Gastrointestinal Panels
| Bacterial Targets | Viral Targets | Parasitic Targets |
|---|---|---|
| Campylobacter spp. (jejuni, upsaliensis, coli) | Adenovirus F40/41 | Cryptosporidium spp. |
| Salmonella spp. | Astrovirus | Cyclospora cayetanensis |
| Vibrio cholerae | Norovirus GI/GII | Entamoeba histolytica |
| Yersinia enterocolitica | Rotavirus | Giardia lamblia |
| Diarrheagenic E. coli (EAEC, EPEC, ETEC, EIEC, STEC) | Sapovirus | |
| Clostridioides difficile toxin A/B |
Bloodstream Infection Testing
Time to Therapy as a Critical Metric
Bloodstream infections carry significant mortality risks that increase with every hour of delayed appropriate antimicrobial therapy [70]. Traditional culture-based methods for pathogen identification and antimicrobial susceptibility testing typically require 48-72 hours for final results, necessitating empirical broad-spectrum antibiotic coverage during this critical window [69]. Molecular syndromic panels designed for positive blood cultures address this limitation by rapidly identifying common causes of bloodstream infections and associated antimicrobial resistance genes, enabling earlier transition to targeted therapy.
The clinical impact of rapid blood culture identification panels has been demonstrated across multiple healthcare settings. Implementation of the BioFire FilmArray Blood Culture Identification (BCID) panel in critically ill patients shortened the median time to optimal therapy from 14.68 hours to 4.65 hours, with antibiotics being adjusted in 31.8% of patients based on panel results [70]. The median time to pathogen identification via the multiplex PCR system was just 1.58 hours, with 96.2% of organisms successfully identified by the panel [70].
Diagnostic Accuracy and Health Economic Outcomes
A comprehensive systematic review and meta-analysis evaluating the diagnostic test accuracy of molecular tests from positive blood cultures for detecting pathogens and antimicrobial resistance included 74 studies and 24,590 samples [72]. When compared with standard-of-care phenotypic identification and susceptibility testing, molecular tests demonstrated consistently high performance across microbial groups: 92-99% sensitivity and 99-100% specificity for identifying gram-negative bacteria (43 studies); similar ranges for gram-positive bacteria (38 studies) and yeast (24 studies); and 99-100% negative predictive values across categories [72].
The economic impact of rapid bloodstream infection testing has also been substantiated in clinical studies. Implementation of the Verigene BC-GN panel for Gram-negative bacteremia demonstrated not only reduced time to pathogen identification (from 30.3 hours to 19.1 hours) but also significantly shorter ICU length of stay (12 days versus 16.2 days) and reduced 30-day mortality (8.1% versus 19.2%) [70]. The estimated net cost saving for each patient in the ICU was $11,661, highlighting the substantial economic value of rapid diagnostic implementation [70].
Urinary Tract Infection Diagnostics
Limitations of Traditional Culture Methods
Urinary tract infections account for a substantial portion of workload in clinical microbiology laboratories, with an estimated 400 million UTIs occurring globally each year [69]. Traditional UTI diagnosis relies on symptoms, urinalysis, and semi-quantitative urine culture interpreted according to historical guidelines dating to the 1950s [69]. This approach, while foundational, presents significant limitations in complex cases, particularly for detecting low-level bacteriuria (<105 CFU/mL) and fastidious organisms that are often overlooked or entirely missed in standard urine culture [69].
The practice of inferring clinical significance from cultured bacterial concentrations using universal thresholds across all species represents an oversimplification of complex infection dynamics [69]. Some patients experience symptomatic infections with bacterial counts as low as 102 CFU/mL, levels below the limit of detection of standard 1 µL inoculum and overlapping with potential contamination levels [69]. Additionally, traditional culture protocols cannot differentiate active pathological processes of UTI from mere colonization, particularly in catheterized patients or those with structural abnormalities [69].
Emerging Molecular Technologies
Novel technologies for UTI diagnosis include rapid molecular-based pathogen identification, next-generation sequencing, and advanced antimicrobial susceptibility testing methods [69]. These approaches offer potential solutions to the limitations of culture through improved sensitivity, reduced turnaround time, and enhanced detection of fastidious or non-culturable organisms. However, these methods also present unique challenges related to interpretation, cost, and the need for adaptation of historical diagnostic paradigms to avoid misdiagnosis and overtreatment [69].
Molecular methods are particularly valuable for identifying emerging uropathogens with fastidious growth characteristics and species whose status as commensal versus pathogen remains ambiguous [69]. The taxonomic landscape of UTIs has been revealed to be incredibly diverse beyond the predominant Escherichia coli, encompassing Staphylococcus saprophyticus, Klebsiella pneumoniae, Pseudomonas aeruginosa, other Enterobacterales, and Enterococcus spp., each with distinct growth requirements and clinical significance [69].
Advanced Methodologies: mNGS and ddPCR
Metagenomic Next-Generation Sequencing (mNGS)
Metagenomic next-generation sequencing represents a culture-independent, high-throughput approach that enables unbiased pathogen detection without requiring prior hypothesis about potential causative agents [68]. This methodology has demonstrated particular utility in challenging diagnostic scenarios such as neurosurgical central nervous system infections (NCNSIs), where conventional culture methods show limited sensitivity (59.1% detection rate) compared to mNGS (86.6% detection rate) [68]. Notably, the administration of empirical antibiotics does not significantly influence the positive detection rate of mNGS, a critical advantage over culture-based methods [68].
The reduced turnaround time associated with mNGS facilitates prompt pathogen identification, circumventing the lengthy cultivation periods necessary for certain microorganisms [68]. Multiple studies have demonstrated that the sensitivity of mNGS is comparable to, or even surpasses, that of specific PCR assays [68]. Additionally, mNGS has proven effective for identifying novel, rare, and atypical etiologies of complicated infectious diseases, making it particularly valuable for diagnostically challenging cases [68].
Digital Droplet PCR (ddPCR)
Droplet digital PCR represents an innovative quantitative molecular detection technology boasting advantages including high sensitivity, reproducibility, simplicity, and speed [68]. In the context of neurosurgical CNS infections, ddPCR has demonstrated a detection rate of 78.7%, significantly higher than traditional culture (59.1%) though slightly lower than mNGS (86.6%) [68]. The most notable advantage of ddPCR is its significantly shorter time from sample harvesting to final results (12.4 ± 3.8 hours) compared to both mNGS (16.8 ± 2.4 hours) and microbial culture (22.6 ± 9.4 hours) [68].
ddPCR has emerged as a promising tool for pathogen detection across various clinical contexts, with successful applications in diagnosing bacterial infections, fungal infections, and viral diseases [68]. The technology has demonstrated superior sensitivity in detecting pathogens in cerebrospinal fluid samples and is increasingly utilized for detecting pathogen DNA in bloodstream infections [68]. The quantitative nature of ddPCR provides additional clinical information regarding pathogen load, which may have prognostic value and utility in monitoring treatment response.
The Scientist's Toolkit: Essential Research Reagents and Materials
Table 4: Key Research Reagents and Materials for Syndrome-Based Testing Development
| Reagent/Material | Function | Application Examples |
|---|---|---|
| Multiplex PCR Master Mixes | Simultaneous amplification of multiple pathogen-specific targets | Syndromic panel development [70] [74] |
| Nucleic Acid Extraction Kits | Isolation of DNA/RNA from clinical specimens | Sample preparation for all molecular assays [74] |
| Pathogen-Specific Primers/Probes | Targeted amplification and detection of microbial sequences | Custom panel development [74] |
| Internal Control Templates | Monitoring extraction efficiency and amplification inhibition | Quality control for molecular assays [74] |
| Reference Strain Panels | Validation and quality assurance of detection assays | Test verification and standardization [74] [72] |
| Automated Cartridge Systems | Integrated sample-to-answer testing platforms | Syndromic testing systems [74] [71] |
| Bioinformatic Analysis Pipelines | Interpretation of complex sequencing data | mNGS and metagenomic applications [68] |
The comparative analysis of syndrome-based testing technologies reveals a dynamic diagnostic landscape where traditional culture methods and innovative molecular platforms each offer distinct advantages and limitations. While syndromic multiplex panels provide rapid, comprehensive pathogen identification for common infections, and emerging technologies like mNGS and ddPCR offer enhanced sensitivity and speed, culture remains essential for antimicrobial susceptibility testing and detecting novel pathogens [68] [69] [17].
The optimal diagnostic approach increasingly involves strategic integration of multiple methodologies to overcome individual limitations. Syndromic panels serve as efficient front-line tests for common infections, while mNGS provides a powerful tool for complex or diagnostically challenging cases [68] [17]. Culture methods continue to provide critical phenotypic data for antimicrobial stewardship, particularly in the context of escalating antimicrobial resistance [69] [17]. This integrated paradigm, leveraging the respective strengths of each technology, represents the most promising path forward for improving patient outcomes, supporting antimicrobial stewardship, and advancing public health response to infectious disease threats.
As the field continues to evolve, ongoing research and development efforts should focus on expanding pathogen coverage, reducing costs, enhancing resistance detection capabilities, and streamlining workflows to make these advanced technologies more accessible across diverse healthcare settings. The ultimate goal remains the delivery of precise, timely, and actionable diagnostic information to guide optimal patient management and treatment decisions.
Implementation Challenges and Strategic Optimization of Microbiological Testing
Interpreting Discordant Results Between Culture and Molecular Methods
In clinical microbiology, traditional culture-based methods and modern molecular diagnostics constitute the foundational approaches for pathogen identification. While culture offers the benefit of live isolates for further characterization, molecular techniques provide rapid, sensitive detection independent of microbial viability. Discordant results between these methods—where one test returns positive while the other is negative, or they identify different organisms—present significant interpretive challenges for researchers, clinical microbiologists, and drug development professionals. Understanding the mechanisms underlying these discrepancies is essential for accurate diagnostic interpretation, antimicrobial stewardship, and therapeutic development.
The coexistence of these methodologies reflects a transitional era in diagnostic microbiology. As molecular platforms gain prominence due to their speed and sensitivity, culture remains indispensable for phenotypic characterization, antimicrobial susceptibility testing, and public health surveillance. This comparative guide examines the technical and biological factors driving discordant results, supported by experimental data and methodological protocols from contemporary research.
Methodological Comparisons: Technical Foundations and Limitations
Fundamental Principles and Characteristics
Culture-based and molecular diagnostic methods operate on fundamentally different principles, each with distinct strengths and limitations that contribute to observed discordances.
- Culture Methods: Rely on microbial growth in or on artificial media, requiring viable organisms with specific metabolic and reproductive capabilities. The method provides isolates for downstream applications but is constrained by fastidious growth requirements, prior antibiotic exposure, and slow turnaround times.
- Molecular Methods: Detect microbial nucleic acids (DNA or RNA) through amplification techniques like PCR, multiplex panels, or sequencing. These methods offer rapid, sensitive detection without requiring viability but cannot distinguish between live and dead organisms or provide isolates for susceptibility testing.
Table 1: Core Characteristics of Culture and Molecular Diagnostic Methods
| Characteristic | Culture-Based Methods | Molecular Methods |
|---|---|---|
| Detection Target | Viable, replicating microorganisms | Microbial nucleic acids (DNA/RNA) |
| Turnaround Time | 24–72 hours for preliminary results; weeks for slow-growing organisms | 1.5–24 hours for results [75] [76] |
| Viability Requirement | Essential for detection | Not required; detects both live and dead organisms |
| Sensitivity | Variable; affected by prior antibiotics, transport conditions | High; can detect low pathogen loads [77] |
| Specificity | High for most pathogens | High, but contamination risks can cause false positives [78] |
| Functional Output | Provides isolates for AST, typing, and virulence studies | Limited to genetic detection; some methods detect resistance genes |
| Optimal Application | When isolate recovery is needed; antimicrobial stewardship | Rapid diagnosis; difficult-to-culture pathogens; prior antibiotic exposure |
Quantitative Discordance Rates Across Clinical Contexts
Discordance rates between culture and molecular methods vary significantly across clinical syndromes and specimen types, reflecting differences in microbial burden, specimen quality, and pathogen characteristics.
Table 2: Discordance Rates Between Culture and Molecular Methods in Various Clinical Contexts
| Clinical Context | Molecular Method | Key Findings | Reported Discordance Rate/Pattern |
|---|---|---|---|
| Periprosthetic Joint Infection (PJI) [78] | Metagenomic Next-Generation Sequencing (mNGS) | Risk factors for culture-mNGS discordance: prior antibiotic use, polymicrobial infections, rare pathogens | Prior antibiotic use (OR=2.137); Polymicrobial infections (OR=3.245); Tissue specimens (OR=2.837) |
| Gastroenteritis [79] | Multiplex PCR (BD MAX Enteric Bacterial Panel) | No significant difference in duration of positivity between PCR and culture for bacterial shedding | Negative PCR 100% predictive of negative culture; No statistically significant differences in shedding duration (P=0.23 for Campylobacter, P=0.89 for Salmonella, P=0.20 for STEC) |
| Complicated Urinary Tract Infection [76] | PCR | PCR-guided therapy provided better clinical outcomes compared to culture-guided approach | Significantly better clinical outcomes (88.1% vs. 78.1%, p=0.011); Shorter turnaround time (49.7h vs. 104.4h, p<0.001) |
| Infectious Keratitis [77] | Multiplex PCR | PCR and culture showed similar diagnostic yields; discordance more likely with bacteria than fungi | Sensitivity: 75% (bacteria) vs. 87.9% (fungi); Result alignment with culture: 63% (bacteria) vs. 89% (fungi) |
| Bloodstream Infections [80] | Microchip-based Molecular Assay | High concordance for β-lactam resistance gene detection | 99.5% (203/204) concordance in simulated samples; 100% (113/113) concordance with comparator molecular assay in clinical samples |
| Gut Microbiota Analysis [81] | Culture-Enriched Metagenomic Sequencing (CEMS) | Low overlap between culture-enriched and culture-independent metagenomic sequencing | Only 18% species overlap between CEMS and CIMS; 36.5% species detected only by CEMS; 45.5% species detected only by CIMS |
Experimental Approaches: Protocols for Comparative Studies
Standardized Methodologies for Method Comparison
Research comparing culture and molecular methods requires rigorous experimental design and standardized protocols to ensure meaningful interpretation of discordant results. The following methodologies represent approaches used in recent studies across different clinical contexts.
Table 3: Experimental Protocols for Culture-Molecular Method Comparisons
| Experimental Component | Culture-Based Protocol | Molecular Protocol |
|---|---|---|
| Sample Processing | Inoculation onto selective and non-selective media; incubation under appropriate atmospheric conditions [79] [78] | Nucleic acid extraction using commercial kits; quality assessment via spectrophotometry [81] [75] |
| Incubation/Conditions | 24-48 hours for most bacteria; extended for fastidious organisms; aerobic, anaerobic, or microaerophilic conditions as needed [78] | Amplification via PCR, isothermal methods, or library preparation for sequencing; typically 1-8 hours [13] [75] |
| Pathogen Identification | Colony morphology, Gram stain, biochemical profiling, MALDI-TOF mass spectrometry [78] [82] | Target amplification with specific primers/probes; sequence detection via fluorescence, electrophoresis, or mass spectrometry [75] [77] |
| Data Interpretation | Growth on media, colony counts, phenotypic characteristics | Cycle threshold (Ct) values, sequence reads, alignment to reference databases |
| Quality Control | Sterility checks, control strains, media performance testing | Inhibition controls, internal amplification controls, standard curves |
Analytical Framework for Discordance Resolution
When culture and molecular methods yield discordant results, systematic analysis is required to determine the correct interpretation. The following workflow provides a logical framework for investigating discordances, incorporating technical and biological considerations.
Essential Research Reagents and Platforms
Research investigating discordance between culture and molecular methods utilizes specialized reagents and instrumentation tailored to specific methodological requirements.
Table 4: Essential Research Reagents and Platforms for Comparative Studies
| Category | Specific Products/Systems | Research Application |
|---|---|---|
| Culture Media | Blood agar, chocolate agar, MacConkey agar, Campylobacter blood-free agar, CHROMagar Salmonella [79] | Support growth of diverse pathogen types; selective isolation of target organisms |
| Automated Culture Systems | BacT/ALERT (bioMérieux), BACTEC (BD Diagnostic Systems), MGIT 960 (TB culture) [75] [82] | Automated monitoring of microbial growth; reduced manual labor |
| Nucleic Acid Extraction Kits | QIAamp Fast DNA Stool Mini Kit, TIANamp Micro DNA Kit, MagPure DNA Kit [81] [75] [78] | Isolation of high-quality DNA from clinical specimens; removal of PCR inhibitors |
| Amplification Platforms | BioFire FilmArray, Xpert MTB/RIF, Alifax GNR microchip [80] [75] | Automated nucleic acid extraction, amplification, and detection; simplified workflow |
| Mass Spectrometry Systems | VITEK MS (bioMérieux), MALDI-TOF MS systems [78] [82] | Rapid microbial identification from culture colonies; protein profiling |
| Sequencing Platforms | Illumina HiSeq 2500, MassARRAY system [81] [75] | Comprehensive pathogen detection; resistance mutation identification |
Critical Factors Driving Divergent Results
Several well-characterized biological and technical factors contribute to discordant results between culture and molecular methods, with varying significance across clinical contexts.
Prior Antibiotic Exposure: Antimicrobial therapy represents the most significant factor causing false-negative cultures while leaving molecular detection unaffected. Studies across multiple infection types consistently demonstrate this effect, with one PJI investigation identifying prior antibiotic use as a primary risk factor for culture-negative/molecular-positive discordance (OR=2.137) [78]. The presence of antimicrobial agents suppresses microbial growth while nucleic acids remain detectable for extended periods.
Microbial Viability and Nucleic Acid Persistence: Molecular methods detect DNA from both viable and non-viable organisms, creating a fundamental divergence from culture that requires viability. This discrepancy is particularly evident in monitoring treatment response, where nucleic acids may persist long after cultivable organisms have been eliminated. Gastroenteritis research found CIDT positivity persisted beyond culture positivity, though differences were not statistically significant [79].
Fastidious Growth Requirements: Microorganisms with specific nutritional or atmospheric requirements may fail to grow in standard culture conditions while remaining detectable by molecular methods. This limitation affects detection of anaerobic bacteria, slow-growing mycobacteria, and nutritionally variant streptococci. Modified culture approaches such as culture-enriched metagenomic sequencing (CEMS) can improve recovery of these fastidious organisms [81].
Analytical Sensitivity Differences: Molecular methods typically demonstrate superior analytical sensitivity compared to culture, enabling detection of low pathogen burdens below the threshold of culture detection. This enhanced sensitivity is particularly valuable in paucibacillary infections or when specimen quality is suboptimal, though it raises questions about the clinical significance of minimally detectable signals [77].
Polymicrobial Infections: Complex infections containing multiple organisms present challenges for both methodological approaches. Culture may overlook slow-growing or fastidious organisms in mixed infections, while molecular methods can detect all present organisms but may struggle to determine clinical significance. PJI research identified polymicrobial infections as a significant risk factor for culture-molecular discordance (OR=3.245) [78].
The systematic comparison of culture and molecular methods reveals a complex diagnostic landscape where discordant results arise from fundamental differences in detection targets and methodological limitations. Rather than viewing these approaches as mutually exclusive, optimal diagnostic strategies leverage their complementary strengths: molecular methods for rapid, sensitive detection and culture for isolate recovery and phenotypic characterization.
For researchers and drug development professionals, understanding the biological and technical basis for discordance is essential for appropriate method selection and results interpretation. Context-specific considerations—including clinical syndrome, pathogen characteristics, and intended application—should guide methodological choices. Future diagnostic development should focus on integrated approaches that preserve the strengths of both methodologies while addressing their limitations, particularly through technologies that maintain the rapidity and sensitivity of molecular methods while enabling phenotypic characterization such as antimicrobial susceptibility testing.
Polymicrobial infections (PMIs), where multiple microbial species simultaneously contribute to an infection, represent a significant diagnostic challenge and are associated with worse patient outcomes compared to monomicrobial infections. Worldwide, PMIs account for an estimated 20–50% of severe clinical infection cases, with biofilm-associated and device-related infections reaching 60–80% in hospitalized patients [83]. The complex microbial interactions within these infections substantially alter disease pathophysiology, severity, and therapeutic response, heightening the risk of morbidity, prolonging hospitalization, and inflating healthcare costs [83]. Despite this significant burden, conventional culture-based diagnostic methods often fail to provide a complete picture of the pathogenic landscape, leading to diagnostic gaps that compromise clinical outcomes [83].
The clinical significance of polymicrobial sepsis is particularly alarming, with studies reporting mortality rates of 38% for polymicrobial sepsis compared to 25% for monomicrobial sepsis in adult hospitalized patients [84]. Patients with polymicrobial sepsis are also less likely to receive correct empirical antimicrobial therapy, especially when fungi are involved, with one study reporting only 34% of polymicrobial cases received correct empiric antimicrobial therapy compared to 59% of monomicrobial cases [84]. This diagnostic challenge is compounded by the fact that traditional culture-dependent methods have limited utility with unculturable microorganisms, while emerging culture-independent methods, including molecular techniques, enable direct analysis of microbial DNA without requiring cultivation [50].
This review systematically compares the performance of culture-dependent and culture-independent methodologies for detecting polymicrobial infections, providing experimental data on their relative strengths and limitations. By examining their concordance rates, detection capabilities, and clinical applicability, we aim to provide researchers and clinicians with evidence-based guidance for selecting appropriate diagnostic approaches based on specific clinical and research contexts.
Comparative Performance: Culture-Dependent Versus Culture-Independent Methods
Detection Sensitivity and Concordance Rates
Multiple studies have directly compared the detection capabilities of culture-dependent and culture-independent methods, revealing significant differences in their ability to identify pathogens in polymicrobial infections.
Table 1: Comparative Detection Rates Between Culture and Metagenomic Methods
| Study Type | Sample Type | Culture-Positive Detection Rate | Metagenomic Detection Rate | Concordance Rate | Key Findings |
|---|---|---|---|---|---|
| Clinical specimen analysis [85] | Various clinical specimens | 80.4% (37/46 specimens) | 95.7% (44/46 specimens) | 91.8% for culture-positive specimens; 52.8% for culture-negative specimens | Metagenomics identified bacteria in significantly more specimens than culture |
| Respiratory study [60] | Bronchoalveolar lavage (BAL) fluid | 39.1% (pathogen species reported) | 95.7% (bacteria identified) | Culture results positively associated with culture-independent indices of infection | Culture-independent sequencing detected bacteria in nearly all specimens |
| Industrial water analysis [50] | Industrial water samples | Varying by BART test type | Comprehensive taxa identification via NGS | Overall agreement, but abundance disparities | Highlighted differences between original sample and cultured populations |
A 2017 comparative study of 103 clinical specimens found that metagenomics-based identification showed a 91.8% concordance rate for culture-positive specimens but only 52.8% concordance with culture-negative samples [85]. The overall sensitivity and specificity for metagenomics analysis were 91.8% and 52.7%, respectively, when compared against conventional culture as the reference standard [85]. This suggests that while metagenomics reliably detects what culture also finds, it identifies additional pathogens in samples that would traditionally be considered negative.
In respiratory infections, a study of 46 bronchoalveolar lavage fluid specimens from lung transplant recipients found that bacteria were identified in 44 of 46 (95.7%) specimens by culture-independent sequencing, significantly more than the number of specimens in which bacteria were detected (37 of 46, 80.4%) or pathogen species reported (18 of 46, 39.1%) via culture [60]. This demonstrates the substantially higher detection rate of molecular methods, particularly for identifying specific pathogenic species beyond just presence/absence of bacteria.
Methodological Limitations and Advantages
Each approach presents distinct limitations and advantages that researchers must consider when designing diagnostic protocols.
Culture-dependent limitations primarily stem from their selective nature. Conventional methods favor fast-growing, dominant microbes under specific laboratory conditions, often missing slow-growing, anaerobic, or fastidious organisms [83]. Studies indicate traditional culture-based approaches can miss up to 30–40% of co-pathogens in polymicrobial samples [83]. Additionally, the limited spectrum of culturable organisms leads to a narrow detection range, focusing only on anticipated pathogens while overlooking potentially significant co-infecting organisms [83].
Culture-independent advantages include their comprehensive, unbiased nature. Metagenomic approaches allow for identification of entire microbial communities, including bacteria, viruses, fungi, and parasites within clinical samples without prior cultivation [83]. These methods can detect unculturable, fastidious, and metabolically active viable but unculturable bacteria that conventional approaches miss [60]. Furthermore, they offer significantly faster turnaround times, with some contexts delivering results within 24 hours compared to 48-72 hours for culture methods [83].
Culture-independent limitations include higher costs, detection of non-viable organisms, and potential overestimation of resistance when resistance genes are identified but not necessarily expressed [28]. There are also challenges with contamination, assay inhibition, and interference from host DNA that must be addressed before these methods can be relied on for routine clinical use [84].
Experimental Workflows and Methodologies
Culture-Dependent Workflow
Traditional culture-dependent methods follow a standardized approach for pathogen isolation and identification:
Table 2: Culture-Dependent Methodology Overview
| Step | Procedure | Specifications | Purpose |
|---|---|---|---|
| Specimen Collection | Blood, urine, CSF, sputum, wound, stool, body fluids | Standard aseptic technique | Obtain representative sample without contamination |
| Inoculum Preparation | Selection of 3-5 well-isolated colonies | Creation of bacterial suspension standardized to 0.5 McFarland standard | Standardize microbial concentration for consistent testing |
| Plating & Incubation | Inoculation onto selective media (e.g., chocolate, blood, MacConkey agar) | Incubation at 35°C for 16-24 hours (up to 72 hours for slow-growing organisms) | Promote growth of target pathogens under optimal conditions |
| Pathogen Identification | Morphological and biochemical characterization | RapID system or similar for Gram-negative bacilli; additional tests for other pathogens | Determine species identity based on phenotypic characteristics |
| Antimicrobial Susceptibility Testing (AST) | Disk diffusion or MIC methods | Interpretation based on CLSI/EUCAST guidelines | Determine antibiotic sensitivity profiles |
For antimicrobial susceptibility testing, the process involves preparing a standardized inoculum from bacterial culture, dilution of bacterial suspension (for MIC method), inoculation to growth medium, addition of antimicrobial disks (for disk diffusion), incubation, and interpretation of results [86]. Quality control strains with established disk zones or MIC ranges are tested periodically to ensure testing conditions, media, and reagents remain acceptable [86].
Culture-Independent Workflow
Culture-independent methods employ molecular techniques to identify pathogens directly from clinical specimens:
DNA Extraction: Clinical specimens undergo DNA extraction using commercial kits such as the QIAamp DNA Mini kit (Qiagen) [85]. For low-biomass samples, additional steps like centrifugation and resuspension in buffer may be incorporated [60]. Extraction controls are essential to monitor for contamination.
Library Preparation: Target gene regions are amplified using polymerase chain reaction (PCR). For bacterial identification, the V1-V2 or V3-V5 variable regions of the 16S rRNA gene are typically targeted with primers such as 357F (forward) and 929R (reverse) [60] [85]. For fungal detection, the ITS1 region of the 18S rRNA gene is targeted [85]. Custom barcoded primer pools enable multiplexing of samples.
Sequencing: Amplified libraries are sequenced using platforms such as the Ion Torrent Personal Genome Machine (PGM) with Ion PGM HiQ OT2 and Sequencing kits [85] or Illumina MiSeq sequencer with v2 500 cycle reagent kits [50]. The choice of platform depends on required throughput, read length, and accuracy requirements.
Bioinformatics Analysis: Sequence data is processed using specialized pipelines such as MOTHUR or USEARCH [50] [60]. Operational taxonomic units (OTUs) are binned at 97% identity, and taxonomic classification is performed using databases like SILVA [50] or the Ribosomal Database Project (RDP) Classifier [60]. Contaminant sequences detected in negative controls are removed prior to final analysis.
Advanced Integrative Approaches
Hybrid Methods: Culture-Enriched Metagenomic Sequencing
Recent advances have introduced hybrid approaches that combine the strengths of both culture-dependent and independent methods. Culture-enriched metagenomic sequencing (CEMS) involves cultivating samples under multiple conditions followed by metagenomic analysis of the grown cultures [19].
In a comparative study analyzing human fecal microbial diversity, researchers found that microbes identified by CEMS and direct culture-independent metagenomic sequencing (CIMS) showed a low degree of overlap (18% of species), with species identified by CEMS and CIMS alone accounting for 36.5% and 45.5%, respectively [19]. This suggests that both culture-dependent and culture-independent approaches are essential in revealing comprehensive microbial diversity.
The CEMS methodology involves several key steps:
- Multi-condition cultivation: Samples are cultured using numerous commercial or modified media under both anaerobic and aerobic conditions [19]
- Colony harvesting: All colonies grown on culture plates are collected using saline solution and cell scrapers [19]
- DNA extraction and sequencing: Metagenomic DNA is extracted from the harvested cultures and subjected to shotgun metagenomic sequencing [19]
- Growth rate analysis: Growth rate index (GRiD) values for various strains on different media can be calculated to predict optimal growth conditions [19]
This approach enables researchers to obtain isolates for further study while also capturing a more comprehensive view of the cultivable microbiome than traditional picking of individual colonies.
Research Reagent Solutions
Table 3: Essential Research Reagents for Polymicrobial Infection Studies
| Category | Specific Products/Functions | Application in Research |
|---|---|---|
| Culture Media | R2A media, tryptic soy broth, plate count agar (nonselective); cetrimide, MacConkey agar (selective) [50] | Isolation of diverse microbial populations; selection of specific microbial types |
| Molecular Biology Kits | QIAamp DNA Mini kit (Qiagen) [85]; DNeasy blood and tissue kit [60] | High-quality DNA extraction from clinical specimens and bacterial cultures |
| Sequencing Reagents | Ion Torrent PGM HiQ OT2 and Sequencing kits [85]; Illumina MiSeq v2 500 cycle reagent kits [50] | Next-generation sequencing for metagenomic identification |
| Bioinformatics Tools | MOTHUR [60]; USEARCH [50]; SILVA SSU ARB database [50] | Processing sequencing data, OTU clustering, taxonomic classification |
| Field-Based Culture Tools | BARTs (Biological Activity Reaction Tests) [50] | Culture-dependent testing in field settings with selective media for various microbial types |
Clinical Implications and Diagnostic Considerations
Impact on Patient Management
The choice between culture-dependent and independent methods has direct implications for clinical decision-making and patient outcomes. Polymicrobial sepsis is associated with more than three times higher progression rates (26.7% vs. 7.8%) to severe sepsis and septic shock than monomicrobial sepsis [84]. The accurate detection of all causative pathogens is therefore critical for appropriate antimicrobial therapy selection.
The complex microbial interactions in polymicrobial infections significantly impact treatment efficacy. In biofilm-associated infections, microbial communities exhibit markedly increased antimicrobial resistance—as much as 10- to 1000-fold reduction in antibiotic effectiveness [83]. Furthermore, polymicrobial biofilms accelerate horizontal gene transfer of carbapenemases, ESBLs, and other resistance determinants across taxa, further complicating therapy [83].
Culture-independent methods can directly impact antimicrobial stewardship by providing comprehensive pathogen identification. However, current limitations include the detection of resistance genes that may not be expressed phenotypically, requiring careful interpretation by clinicians and microbiologists [28].
Future Directions and Emerging Technologies
Emerging diagnostic solutions include CRISPR-based multiplex assays, artificial intelligence-based metagenomic platforms, and sensitive biosensors with point-of-care applicability [83]. These technologies show potential in reducing turnaround time (<2 hours) with high accuracy (>95%), though their translation to real-world settings depends critically on affordability and integration into healthcare pathways [83].
Shotgun metagenomics is also being explored to uncover pathogen-pathogen interactions in polymicrobial sepsis cases and their potential role in the clinical course of this condition [84]. This approach sequences all genetic material in a sample without targeting specific genes, providing deeper insights into functional potential and microbial community dynamics.
Both culture-dependent and culture-independent methods offer distinct advantages for the detection and characterization of polymicrobial infections. Culture-based methods provide viable isolates for antimicrobial susceptibility testing and remain the gold standard for phenotypic characterization, but suffer from limited sensitivity, particularly for unculturable or fastidious organisms. Molecular methods offer comprehensive, rapid detection of diverse pathogens but face challenges with cost, interpretation, and determining viability and phenotypic resistance.
The optimal diagnostic approach depends on the clinical context, available resources, and specific research questions. For clinical management of critical infections, a combined approach using molecular methods for rapid identification followed by culture for antimicrobial susceptibility testing may provide the most comprehensive information for guiding therapy. For research applications aiming to characterize complex microbial communities, culture-enriched metagenomic sequencing represents a promising hybrid approach that leverages the strengths of both methodologies.
As technological advances continue to improve the speed, accuracy, and accessibility of molecular diagnostics, along with the development of novel cultivation techniques, our ability to detect and understand polymicrobial infections will continue to evolve, ultimately leading to improved patient outcomes and more effective antimicrobial stewardship.
Overcoming Pre-Analytical Variables in Sample Collection and Processing
In microbiological testing, the pre-analytical phase—encompassing all steps from sample collection to processing before analysis—is a pivotal determinant of test accuracy and reliability. This phase introduces the most significant proportion of laboratory errors, accounting for 60-70% of all laboratory errors [87]. For researchers and drug development professionals, controlling these variables is not merely a matter of protocol compliance but a fundamental scientific necessity to ensure data integrity. Within the context of culture versus non-culture methods, pre-analytical handling can dramatically alter the representation of the microbial community, potentially biasing results and leading to erroneous conclusions. This guide provides an objective comparison of how these two methodological approaches perform under varied pre-analytical conditions, supported by experimental data, to inform robust experimental design in research and development.
Fundamental Methodological Comparison
Culture-dependent and culture-independent methods represent two distinct paradigms for microbial analysis. Culture-dependent methods have been the standard for over a century, relying on the growth of microorganisms on specific nutrient media to isolate and identify viable cells [50]. In contrast, culture-independent methods, such as next-generation sequencing (NGS), enable direct analysis of microbial DNA from a sample without the need for cultivation, thereby capturing data on both culturable and unculturable organisms [50] [60].
The core distinction lies in their basis for detection: culture methods depend on microbial growth and metabolic activity, while molecular methods rely on the presence and extraction of genetic material. This fundamental difference dictates how susceptible each method is to various pre-analytical variables, from sample collection to storage and processing.
Table 1: Core Characteristics of Culture and Non-Culture Methods
| Characteristic | Culture-Dependent Methods | Culture-Independent Methods (e.g., NGS) |
|---|---|---|
| Basis of Detection | Microbial growth on nutrient media [50] | Presence of microbial DNA/RNA [50] [60] |
| Detection Scope | Limited to culturable, viable organisms | Culturable, unculturable, viable-but-non-culturable (VBNC), and dead cells [50] [60] |
| Typical Output | Colony-forming units (CFU), identification of isolates | Relative microbial abundance, community structure, metabolic potential |
| Key Advantage | Confirms viability, allows for strain isolation & antibiotic testing | Comprehensive profile of microbial community |
| Key Limitation | <1% of environmental microbes are culturable [50] | Cannot routinely distinguish between viable and dead cells |
Impact of Pre-Analytical Variables on Methodological Performance
Pre-analytical variables can be categorized into factors related to the patient/subject, sample collection, and sample handling. Their impact differs significantly between culture and molecular approaches.
Sample Collection and Transport
Variables during collection, such as tourniquet application time, collection tube type, and sample volume, are critical for both methods but can have divergent effects.
- For Culture Methods: The viability of microorganisms is paramount. Transport time and temperature are crucial; delays or improper temperatures can lead to the death of fastidious organisms or overgrowth of contaminants, rendering culture results non-representative [88]. The choice of transport media (e.g., with or without preservatives) is designed specifically to maintain the viability of target organisms.
- For Molecular Methods: Viability is less critical than the integrity of the genetic material. The primary concerns are preventing the degradation of DNA/RNA and inhibiting contaminants that may interfere with enzymatic reactions (e.g., PCR). While some samples can be stabilized with preservatives for later DNA extraction, grossly hemolyzed samples should be avoided as erythrocytes contain proteases that can degrade nucleic acids and other biomarkers [88].
A critical pre-analytical factor in hematology and coagulation testing is the blood-to-anticoagulant ratio. Under-filling a citrate tube, for instance, prolongs clotting times because the excess citrate binds calcium used in the assay. This effect is exacerbated in patients with a high hematocrit, requiring formula-based adjustment of the anticoagulant volume [89].
Sample Storage and Stability
The stability of analytes during storage is a major pre-analytical consideration.
- For Culture Methods: Storage is generally short-term, with the goal of preserving viability. Refrigeration is common, but freezing is often detrimental unless cryoprotectants are used.
- For Molecular Methods: Storage stability is analyte-specific. Some biomarkers, like C-terminal telopeptide (CTX), are stable for years at -20°C, while others, like osteocalcin and tartrate-resistant acid phosphatase (TRAP5b), are sensitive to thermodegradation and degrade within hours at room temperature [88]. EDTA plasma is often recommended for molecular biomarkers because chelating calcium reduces the activity of proteolytic enzymes, enhancing DNA stability [88]. Multiple freeze-thaw cycles should be avoided as they can lyse remaining platelets and degrade nucleic acids [89].
Comparative Experimental Data
Recent studies directly comparing both methods under controlled conditions reveal their complementary strengths and weaknesses.
Analysis of Bronchoalveolar Lavage (BAL) Fluids
A 2014 study compared conventional BAL fluid culture with 16S rRNA gene pyrosequencing (a culture-independent method) in 46 samples from lung transplant recipients [60].
Table 2: Comparative Detection in BAL Fluid Samples [60]
| Method | Samples with Bacteria Detected | Samples with "Pathogen" Species Reported | Correlation with Clinical Infection Indices |
|---|---|---|---|
| Culture-Dependent | 37/46 (80.4%) | 18/46 (39.1%) | Positively associated with culture-independent indices (e.g., bacterial DNA burden) |
| Culture-Independent (Pyrosequencing) | 44/46 (95.7%) | Not Applicable (Provides community profile) | Bacterial DNA burden and low diversity were indicators of infection |
The study found that bacterial culture was largely effective in discriminating acute infection from its absence. However, culture-independent sequencing detected bacteria in significantly more specimens. Furthermore, quantitative culture results correlated with culture-independent indices: culture growth above 10^4 CFU/ml was associated with an increased bacterial DNA burden and a decreased community diversity [60]. This demonstrates that while NGS is more sensitive in detecting microbial presence, culture remains a valuable indicator of clinically significant microbial loads.
Analysis of Industrial Water and Arsenic-Contaminated Soil
Studies on environmental samples further highlight the disparity in microbial community representation.
A 2024 study on industrial water systems used Biological Activity Reaction Tests (BARTs), a culture-dependent field test, and compared the results with NGS analysis of the same tubes [50]. The results showed that while there was overall agreement, the most abundant taxa found in the original water samples sometimes differed from those that proliferated in the BARTs, indicating that the selective nature of the culture medium shaped the resulting microbial community [50].
Similarly, a study on arsenic-contaminated soil found that while culture-dependent and independent methods showed high similarities at the phylum level (with Firmicutes, Proteobacteria, and Actinobacteria being common), there were large differences at the genus level. Of the genera identified, only Pseudomonas was detected by both methods [90]. This underscores that culture-based isolation can capture some, but not all, of the dominant native populations, and its output is heavily influenced by the choice of growth media.
Table 3: Comparison of Microbial Community Profiling in Arsenic-Laden Soil [90]
| Taxonomic Level | Culture-Independent Method (Illumina) | Culture-Dependent Method (Isolation) | Agreement |
|---|---|---|---|
| Phylum | Firmicutes (92.23%), Proteobacteria (3.21%), Actinobacteria (2.41%) | Firmicutes, Proteobacteria, Actinobacteria | High Similarity |
| Genus | Staphylococcus (89.8%), Pseudomonas (1.25%), Corynebacterium (0.82%) | Pseudomonas (and other unlisted genera) | Low Similarity (Only Pseudomonas was common) |
Detailed Experimental Protocols
To ensure reproducibility, detailed protocols for key experiments cited are provided below.
1. Sample Acquisition and Processing:
- Perform bronchoalveolar lavage (BAL) by wedging the bronchoscope and instilling 120-300 mL of sterile saline.
- Fractionate the sample into two aliquots: one for clinical culture and one for sequencing.
- Centrifuge the research aliquot at 22,500 × g for 30 minutes at 4°C.
- Discard the supernatant and store the pellet at -80°C until DNA extraction.
2. DNA Isolation and Quantification:
- Extract genomic DNA from the pellet using a commercial kit (e.g., Qiagen DNeasy Blood and Tissue Kit) with a bead-beating step for homogenization.
- Quantify the bacterial DNA load via quantitative PCR (qPCR) targeting the 16S rRNA gene.
3. 16S rRNA Gene Amplification and Sequencing:
- Perform PCR amplification of the V3-V5 hypervariable regions of the 16S rRNA gene using barcoded primers (e.g., 357F and 929R).
- Use touchdown PCR cycling conditions: 95°C for 2 min; 20 cycles of touchdown (95°C for 20s, annealing from 60°C to 50°C, 72°C for 45s); 20 standard cycles (95°C for 20s, 50°C for 30s, 72°C for 45s); final elongation at 72°C for 5 min.
- Sequence the amplicon libraries on a platform such as the Roche 454 GS Junior or Illumina MiSeq.
4. Data Analysis:
- Process sequences using a pipeline like mothur to remove low-quality reads and chimeras.
- Cluster sequences into Operational Taxonomic Units (OTUs) at a 97% identity threshold.
- Classify OTUs taxonomically using a reference database (e.g., SILVA).
- Analyze community diversity and composition.
1. Sample Inoculation and Incubation:
- Select the appropriate BART test (e.g., for iron-related bacteria, sulfate-reducing bacteria).
- Inoculate the BART tube with 15 mL of the water sample.
- Incubate the tube at room temperature, away from direct sunlight, and observe daily.
- Record the reaction pattern and the time until a positive reaction is observed (lag time), which is used to estimate population levels.
2. Sample Harvesting and DNA Preservation:
- If the BART test is positive or shows growth, filter approximately 15 mL of the sample through a 0.2-micron sterile membrane filter.
- Using sterile tweezers, fold the filter membrane and place it into a proprietary lyophilized preservation buffer.
- Vortex the tube for ~30 seconds to ensure preservation and ship overnight for NGS analysis.
3. Downstream NGS Analysis (as in 5.1 above):
- Extract DNA from the preserved sample.
- Perform 16S rRNA gene sequencing (e.g., V4 region with 515F/806R primers on an Illumina MiSeq).
- Analyze the resulting data to identify the taxa that grew in the BART test and compare them to the community in the original water sample.
Workflow Visualization
The following diagram illustrates the divergent and convergent pathways of culture-dependent and culture-independent methodologies, highlighting key pre-analytical steps.
Microbial Analysis Workflow Comparison. This diagram contrasts the distinct sample handling requirements and analytical pathways for culture-dependent and culture-independent methods, culminating in integrated data interpretation.
Essential Research Reagent Solutions
The following table details key reagents and materials critical for managing pre-analytical variables in the experiments discussed.
Table 4: Key Research Reagent Solutions for Microbiological Testing
| Reagent/Material | Function | Method Application |
|---|---|---|
| Selective & Nonselective Media (e.g., R2A, MacConkey, BARTs) | Supports growth of specific or general microbial populations from a sample. | Culture-Dependent [50] |
| DNA/RNA Preservation Buffers (e.g., Proprietary Lyophilized Buffers) | Stabilizes nucleic acids immediately upon collection, preventing degradation during transport/storage. | Culture-Independent [50] |
| Trisodium Citrate Tubes (3.2%) | Anticoagulant for coagulation tests; requires strict 9:1 blood-to-anticoagulant ratio. | Pre-Analytical (Sample Collection) [89] |
| EDTA Blood Tubes | Anticoagulant that chelates calcium; preferred for many molecular assays due to enhanced DNA stability. | Pre-Analytical (Sample Collection) [88] |
| 0.2-micron Sterile Membrane Filters | Concentrates microbial cells from large liquid volumes (e.g., water) for subsequent DNA extraction. | Culture-Independent [50] |
| Barcoded 16S rRNA Primers (e.g., 515F/806R) | Allows PCR amplification and multiplexed sequencing of the 16S rRNA gene from complex communities. | Culture-Independent (NGS) [50] |
The comparative analysis reveals that neither culture-dependent nor culture-independent methods are superior; they are fundamentally complementary. Culture methods confirm viability and allow for isolate manipulation but offer a narrow, media-biased view of the microbial world. Molecular methods provide a comprehensive community profile but can include non-viable organisms and require sophisticated data interpretation. The pre-analytical phase is a major source of variability and potential bias for both. Sample collection techniques, transport conditions, and storage stability must be intentionally optimized based on the chosen method's fundamental requirements—viability for culture and nucleic acid integrity for molecular analysis. For researchers, the most robust strategy involves understanding these pre-analytical sensitivities and, where possible, employing an integrated approach that leverages the strengths of both methodologies to generate a more accurate and complete understanding of the microbial system under investigation.
Strategies for Integrating Non-Culture Methods into Existing Workflows
In clinical microbiology and biopharmaceutical research, the detection and identification of microorganisms have traditionally relied on culture-based methods. These techniques, while considered the historical "gold standard," have intrinsic limitations, including prolonged turnaround times (24-72 hours or more) and lower sensitivity for slow-growing or fastidious pathogens [91] [2]. In the context of sepsis, for example, each hour of delay in administering effective antimicrobial therapy is associated with an average 8% decrease in survival, highlighting the critical need for faster diagnostic solutions [91]. Similarly, in biomanufacturing, delays in microbiological testing can result in significant production costs and compromise product safety [92].
These challenges provide the rationale for integrating non-culture-based techniques into existing workflows. These methods, including molecular and immunoassay techniques, offer improved speed, sensitivity, and the ability to detect organisms that are difficult or impossible to culture [2]. This guide objectively compares the performance of non-culture methods with traditional culture and automated culture alternatives, providing a framework for their strategic integration into modern microbiological testing regimens.
Performance Comparison: Non-Culture vs. Culture-Based Methods
A comprehensive understanding of the relative strengths and weaknesses of different diagnostic approaches is fundamental to successful integration. The data below summarize direct comparisons and key characteristics.
Table 1: Comparative Diagnostic Performance of Microbial Detection Methods
| Method Category | Example Techniques | Time to Result | Key Advantages | Key Limitations |
|---|---|---|---|---|
| Traditional Culture | Heterotrophic Plate Count, Spread Plate [93] | Days to weeks [2] | Allows antibiotic susceptibility testing; Widely accepted standard [91] | Low sensitivity for fastidious organisms; Time-consuming; Not all viable microbes are recovered [91] [93] |
| Automated Culture | Automated Blood Culture Systems (ABCS) [94] [20] | 1-7 days [20] | Improved sensitivity over conventional culture; Automated monitoring [94] [20] | Still requires microbial growth; Longer turnaround than non-culture methods |
| Non-Culture Methods | Nucleic Acid Amplification Tests (NAAT), Antigen Detection [2] | Hours to a day [2] | Rapid results; High sensitivity; Detects non-culturable pathogens [91] [2] | Generally does not provide antibiotic susceptibility data [91] [2] |
Evidence from large-scale clinical studies demonstrates the superior sensitivity of newer methods. A 2025 retrospective study of over 9,000 patients with pleural infection found that an Automated Blood Culture System (ABCS) detected bacteria in 52.2% of patients who had negative conventional cultures. This means ABCS approximately doubled the diagnostic yield for pleural infections compared to conventional culture alone [94] [20].
For non-culture methods, the advantages are particularly pronounced for specific pathogens. Nucleic acid amplification testing (NAAT) has drastically reduced turnaround times for many routine diagnostics and is the preferred method for detecting viruses like norovirus and rotavirus, as well as fastidious bacteria like Bordetella pertussis and Mycoplasma pneumoniae [2]. Furthermore, non-culture methods are indispensable for detecting uniformly uncultivable pathogens such as Rickettsia spp. and Coxiella burnetii [91].
Strategic Integration Workflow
Successful integration of non-culture methods is not a simple replacement but an enhancement of existing workflows. A strategic, complementary approach ensures that the strengths of each method are fully leveraged. The following diagram outlines a decision-making framework for integrating these tests.
Strategic Workflow for Integrating Non-Culture Methods
This framework supports three primary integration scenarios:
- Parallel Testing for Critical Cases: In life-threatening situations like sepsis or for critical bioprocess samples, running culture and non-culture methods simultaneously provides rapid preliminary results from the non-culture assay (guiding initial therapy) while maintaining the ability to obtain antibiotic susceptibility data from the culture [91].
- Non-Culture First-Line for Specific Pathogens: When a fastidious or non-culturable organism (e.g., Mycoplasma pneumoniae, Coxiella burnetii) is suspected, a targeted NAAT or serological test should be the first choice [91] [2].
- Culture for Susceptibility Testing: When a culture-based method identifies a pathogen, it remains the only way to perform comprehensive antibiotic susceptibility testing (AST), which is crucial for de-escalating or optimizing antimicrobial therapy [91].
Experimental Protocols and Supporting Data
Protocol: Comparative Validation of Automated vs. Conventional Culture
A 2025 study provides a robust protocol for comparing Automated Blood Culture Systems (ABCS) with conventional culture for pleural fluid samples [20].
- Sample Collection and Inoculation: At the bedside, approximately 5-10 mL of pleural fluid is inoculated into each aerobic and anaerobic blood culture bottle (for ABCS). A separate 5-10 mL aliquot is placed into a sterile tube for conventional culture [20].
- Culture Processing:
- Conventional Culture: The pleural fluid is inoculated onto solid media (blood agar, MacConkey agar, Brucella agar). Plates are incubated under aerobic and anaerobic conditions at 37°C for up to 7 days.
- ABCS Culture: The inoculated bottles are loaded into the automated system (e.g., BACT/ALERT VIRTUO) and incubated at 37°C for up to 7 days.
- Analysis: The positivity rates, time to detection, and organisms identified by each method are compared.
Supporting Data: This study demonstrated that ABCS detected causative organisms in 100% of the 632 confirmed pleural infection cases, whereas conventional culture alone would have missed 330 cases (52.2%) [20]. Common organisms isolated exclusively by ABCS included viridans group streptococci, Staphylococcus aureus, and Klebsiella spp.
Protocol: Deploying Non-Culture Methods for Fungal Diagnosis
For diagnosing infections caused by dimorphic fungi like Talaromyces marneffei, non-culture methods are vital. A 2025 review outlines a multi-method approach [5].
- Sample Types: Blood, urine, bronchoalveolar lavage fluid (BALF), cerebrospinal fluid (CSF), and tissue.
- Method Selection by Sample:
- Blood: Most versatile; suitable for culture, NAAT, and antigen detection.
- Urine: Primarily for immunological antigen detection.
- BALF/CSF: Metagenomic next-generation sequencing (mNGS) is recommended for its high sensitivity and specificity in early diagnosis.
- Tissue: Histopathology with microscopy, potentially supplemented with NAAT.
- Analysis: Turnaround time, sensitivity, and specificity are compared against the delayed results of fungal culture.
Supporting Data: This approach underscores that non-culture techniques enable faster and more convenient pathogen identification, improving diagnostic efficiency and facilitating earlier initiation of life-saving antifungal treatment, particularly in resource-limited settings [5].
Essential Research Reagent Solutions
Implementing the protocols above requires specific, high-quality reagents. The following table details key materials and their functions in non-culture and comparative workflows.
Table 2: Key Reagents for Non-Culture and Culture Method Validation
| Reagent / Material | Function | Example Use Case |
|---|---|---|
| Automated Blood Culture Bottles | Contains enriched media in a self-contained system for automated, continuous monitoring of microbial growth [20]. | Used in ABCS for sterile body fluids like pleural fluid or blood [20]. |
| Selective & Non-Selective Agar Plates | Solid media for isolating and enumerating microorganisms from a sample. Different types select for specific organisms [20]. | Conventional culture on blood agar, MacConkey agar, and Brucella agar [20]. |
| PCR Master Mix & Primers/Probes | Essential components for Nucleic Acid Amplification Tests (NAAT) to detect specific microbial DNA or RNA sequences [2]. | Targeted detection of fastidious pathogens (e.g., Mycoplasma pneumoniae, Bordetella pertussis) [2]. |
| Antigen Detection Kits | Immunoassays that use antibodies to detect microbial antigens in a patient sample [2]. | Rapid diagnosis from urine (e.g., Streptococcus pneumoniae, Legionella pneumophila serogroup 1) [2]. |
| Authenticated Reference Microbial Strains | Certified microbial cultures used as positive controls to validate the accuracy and performance of both culture and non-culture test methods [92]. | QC testing, assay validation, and compliance with regulatory standards (e.g., USP) [92]. |
The integration of non-culture methods into existing microbiological workflows is a necessary evolution driven by the demand for speed, sensitivity, and comprehensive pathogen detection. Data show that automated culture systems can significantly improve diagnostic yield over conventional culture, while non-culture molecular and immunological methods provide unparalleled speed for critical pathogens. A strategic, integrated approach—using these methods as complements rather than substitutes—leverages the strengths of each technology. This synergy ultimately leads to faster diagnoses, more informed treatment decisions, improved patient outcomes, and enhanced safety in biopharmaceutical manufacturing.
Cost-Benefit Analysis and Resource Allocation for Laboratory Testing
Microbiological diagnostics are undergoing a substantial transformation, moving from traditional culture-based methods toward rapid molecular and automated technologies. This evolution presents laboratories with complex decisions regarding resource allocation, requiring careful balance between diagnostic performance and economic efficiency. Within pharmaceutical research and clinical diagnostics, selecting appropriate testing methodologies significantly impacts development timelines, patient outcomes, and operational costs. The broader thesis of culture versus non-culture methods centers on leveraging the unique advantages of each approach to create complementary diagnostic strategies. While non-culture methods offer unprecedented speed, traditional culture remains vital for phenotypic characterization, particularly for antimicrobial susceptibility testing (AST) [17]. This guide provides an objective comparison of current microbiological testing platforms, supporting informed decision-making for researchers, scientists, and drug development professionals engaged in diagnostic selection and laboratory management.
Comparative Analysis of Microbiological Testing Methods
Performance and Operational Characteristics
Laboratories can choose from several methodological platforms, each with distinct performance profiles, operational requirements, and economic implications. The table below summarizes key characteristics across major testing categories.
Table 1: Comparative Analysis of Microbiological Testing Methods
| Method Category | Specific Examples | Sensitivity & Diagnostic Yield | Time to Result | Key Advantages | Primary Limitations |
|---|---|---|---|---|---|
| Automated Culture Systems | Automated Blood Culture System (ABCS) | ~2x higher than conventional culture for pleural fluid (52.2% vs. 47.8% positive) [20] | Hours to days (requires microbial growth) | Enhances microbiologic diagnosis; superior sensitivity for sterile body fluids [20] | Longer turnaround than molecular methods; requires viable organisms |
| Conventional Culture | Smear, Agar Plate Culture | Median positivity 50.3% (range: 32.6-79.4%) for infectious keratitis [77] | 2-3 days to several weeks | Gold standard for phenotypic AST; broad, untargeted approach [17] [77] | Low sensitivity; resource and time-consuming; negatively impacted by prior antibiotic use [77] |
| Molecular Methods (Non-Culture) | 16S/18S rRNA PCR, Multiplex PCR | Sensitivity: 70-98%; Specificity: 56.7-100% vs. clinical diagnosis [77] | Few hours to 48 hours | Rapid result; detects non-viable organisms; high sensitivity; useful after antimicrobial initiation [77] | Limited by primer design; false positives from contamination; cannot provide AST [77] |
| Microbial Community Profiling | Shotgun Metagenomics, 16S rRNA Sequencing | N/A (provides community composition, not clinical sensitivity) | Days (sequencing and analysis) | Highest resolution for microbial diversity; culture-independent [17] | High cost and complexity; requires specialized bioinformatics [17] |
| Rapid Point-of-Care Tests | Clinic-based POCT (e.g., eCup+) | N/A (provides preliminary result) | Under 5 minutes for preliminary result | Extreme speed and efficiency; clinic oversight [95] | Requires confirmation for non-negative results; limited customization [95] |
Detailed Methodological Protocols
Automated and Conventional Culture Protocols
For pleural fluid analysis, the recommended protocol involves bedside inoculation. Approximately 5–10 mL of pleural fluid is inoculated into each aerobic and anaerobic blood culture bottle for the Automated Blood Culture System (ABCS). A separate 5–10 mL sample is placed in a sterile tube for conventional culture. In the laboratory, the conventional culture sample is aspirated and inoculated onto solid media, typically blood agar plate, MacConkey agar, and Brucella agar. These plates are incubated under both aerobic and anaerobic conditions at 37°C for up to 7 days. The ABCS (e.g., BACT/ALERT 3D and VIRTUO systems) also incubates bottles at 37°C for up to 7 days before terminal subculture. Identification and susceptibility testing are performed using systems like VITEK 2 and VITEK MS [20].
Molecular PCR Testing Protocol
For ocular infections like infectious keratitis, corneal scrapings are collected. The PCR process involves:
- Sample Collection: Corneal scrapings are placed in a transport medium.
- DNA Extraction: Nucleic acids are purified from the sample.
- Amplification: The DNA undergoes cyclical amplification through denaturation, primer hybridization, and elongation. For broad-range detection, 16S/18S ribosomal-RNA (rRNA) based PCR is commonly used, targeting the 16S rRNA in bacteria and 18S rRNA in eukaryotes like fungi and protozoa.
- Detection: After sufficient cycles, amplified DNA is detected, providing a positive or negative result for the targets in the panel (e.g., a multiplex PCR panel). Results are typically available within a few hours to 48 hours [77].
Cost-Benefit Analysis and Resource Allocation Frameworks
Financial and Operational Impacts
Implementing new laboratory technologies requires a thorough cost-benefit analysis (CBA), a systematic process of identifying, quantifying, and comparing all costs and benefits associated with a decision [96]. The financial advantages of automation are multifaceted.
Table 2: Cost-Benefit Analysis of Laboratory Automation and New Technologies
| Factor | Financial & Operational Impact | Considerations for Resource Allocation |
|---|---|---|
| Labor Costs | Among the highest expenditures; automation reduces human involvement in routine processes, lowering staffing costs and overtime [97]. | Enables reallocation of skilled personnel to strategic tasks like data analysis and quality control [97]. |
| Operational Efficiency | Streamlines sample preparation, data entry, and analysis; enables 24/7 operation, increasing throughput and reducing turnaround times [97]. | Higher throughput allows management of increasing workloads without proportional staff increases, offering long-term scalability [97]. |
| Error Reduction | Minimizes costly mistakes from manual handling/entry; reduces expenses for retraining, retesting, and material replacement [97]. | Consistent results lower consumable costs (reagents, etc.) and enhance operational efficiency over time [97]. |
| Test Pricing & Site of Service | Significant cost discrepancies exist; e.g., a metabolic panel cost $8.51 (independent lab) vs. $48.45 (hospital outpatient lab) [98]. | Resource allocation models must consider place-of-service costs to optimize spending without compromising care [98]. |
| Genetic & Biomarker Testing | Spend increased 66% between 2020-2024 [98]. Presents challenges in coding, quality control, and determining clinical utility [98]. | Requires sophisticated management strategies to control spend and ensure appropriate utilization amidst rapid innovation [98]. |
Strategic Resource Allocation Models
Effective resource allocation in pharmaceutical R&D and diagnostic laboratories can be enhanced through structured modeling techniques:
- Linear Programming (LP) Models: These mathematical techniques optimize resource allocation by maximizing or minimizing a linear objective function under constraints. For example, LP models can allocate R&D funds across different therapeutic areas, with one application achieving a 15% increase in overall project success rates [99].
- Stochastic Models: These incorporate uncertainty and randomness, which is essential for clinical trial planning. They manage risks associated with trial durations, leading to more accurate project timeline predictions and resource planning [99].
- Dynamic Programming (DP) Models: Useful for multi-stage decision-making, DP optimizes resource allocation across drug development phases (discovery to commercialization). One demonstrated application resulted in a 20% reduction in development time [99].
- Game Theory Models: This approach analyzes competitive situations involving multiple decision-makers, applicable to strategic alliances, licensing agreements, and market competition. It can lead to better resource utilization and innovation outcomes in joint R&D ventures [99].
The Scientist's Toolkit: Essential Research Reagent Solutions
Selecting appropriate reagents and materials is fundamental to executing the methodologies described. The following table details key solutions for the featured experimental workflows.
Table 3: Key Research Reagent Solutions for Microbiological Testing
| Item Name | Function/Brief Explanation | Application Context |
|---|---|---|
| Blood Culture Bottles (Aerobic/Anaerobic) | Broth medium for inoculation of sterile body fluids; supports growth of a wide range of microorganisms under different atmospheric conditions. | Automated Blood Culture Systems (ABCS) for testing pleural fluid, blood, etc. [20] |
| Solid Culture Media (Blood Agar, MacConkey Agar, Brucella Agar) | Provides solid surface for bacterial isolation and colony formation; different media support growth of specific organism groups (e.g., general purpose, Gram-negatives, anaerobes). | Conventional culture for organism isolation and phenotypic analysis [20] [77] |
| PCR Primers (16S/18S rRNA) | Short, single-stranded DNA sequences that bind to complementary target regions to initiate DNA amplification by DNA polymerase. | Molecular identification of bacteria (16S) and fungi/protozoa (18S) in PCR assays [77] |
| Transport Medium | Preserves specimen integrity and viability of microorganisms during transport from collection site to laboratory. | Used in indirect culture and for molecular samples to maintain sample quality [77] |
| Stains (Gram, Giemsa, Calcofluor White) | Chemical dyes that bind to cellular components, allowing visual differentiation of microorganisms (e.g., Gram-positive vs. Gram-negative bacteria, fungi) under microscopy. | Initial microscopic examination of smears from clinical samples [77] |
Integrated Testing Workflows and Decision Pathways
The following diagram illustrates a consolidated diagnostic workflow integrating both culture and non-culture methods to optimize resource allocation and diagnostic yield.
This workflow demonstrates how non-culture methods provide rapid preliminary results, guiding initial decisions, while culture methods remain essential for comprehensive phenotypic characterization and antimicrobial stewardship. This integrated approach maximizes the respective benefits of speed and depth of information.
The paradigm of microbiological testing is unequivocally shifting toward an integrated model where culture and non-culture methods are strategically combined. Automated culture systems significantly enhance diagnostic yield for certain sample types, while molecular methods provide critical speed for time-sensitive clinical decisions. Effective resource allocation requires a nuanced cost-benefit analysis that extends beyond the initial price of equipment to encompass labor efficiency, error reduction, long-term scalability, and the growing financial impact of genetic and biomarker testing. By applying structured resource allocation models—such as linear programming and stochastic models—and implementing integrated workflows, laboratories and pharmaceutical R&D teams can optimize their diagnostic infrastructure. This ensures robust pathogen identification, supports antimicrobial stewardship, and delivers measurable value in both research and clinical practice.
Validation Frameworks and Comparative Performance Assessment of Diagnostic Methods
In the field of microbiological diagnostics, the evaluation of any testing method relies fundamentally on a set of standardized statistical metrics. These metrics—accuracy, precision, sensitivity, and specificity—provide the critical framework for validating test performance, enabling researchers and clinicians to make evidence-based decisions regarding patient care and public health. As the paradigm shifts from traditional culture-based methods toward rapid non-culture techniques, understanding these metrics becomes increasingly important for assessing the true clinical utility of novel diagnostic platforms.
Accuracy represents the proportion of true results (both true positives and true negatives) in the total population, measuring how close a test's results are to the actual true values [100]. Precision, often considered separately, refers to the reliability and reproducibility of test results when repeated determinations are performed on the same sample [101]. Sensitivity measures a test's ability to correctly identify individuals who have a given disease or condition (true positive rate), while specificity measures its ability to correctly exclude individuals who do not have the condition (true negative rate) [101] [102] [103]. These metrics are intrinsic to the test itself and remain prevalence-independent, providing fundamental insights into test performance across different populations and settings.
Defining the Core Metrics
Conceptual Foundations
The statistical measurements of accuracy and precision reveal a test's basic reliability, though these terms describe different sources of variability and are not interchangeable [101]. A test method can be precise (reliably reproducible in what it measures) without being accurate (actually measuring what it is supposed to measure), or vice versa [101]. In clinical practice, this distinction is crucial—a highly precise but inaccurate test would consistently give the same wrong result, while an accurate but imprecise test would be correct on average but with substantial variability between measurements.
Sensitivity and specificity exist in an inverse relationship, where increasing sensitivity typically decreases specificity, and vice versa [102]. This trade-off necessitates careful consideration of the clinical context when evaluating tests. Highly sensitive tests are particularly valuable when the consequence of missing a disease is severe, as they effectively "rule out" conditions when negative (often summarized by the mnemonic "SnNout") [103]. Conversely, highly specific tests are preferred for "ruling in" conditions when positive ("SpPin"), as they minimize false positives that could lead to unnecessary treatments, anxiety, and additional testing [102] [103].
Mathematical Formulations
These metrics are derived from a 2x2 contingency table that cross-references the test results with the true disease status, typically established through a gold standard test [102]. The table below outlines the fundamental calculations for each metric.
Table 1: Standard Formulas for Diagnostic Test Metrics
| Metric | Formula | Interpretation |
|---|---|---|
| Sensitivity | True Positives / (True Positives + False Negatives) | Probability of a positive test given the patient has the disease [102] [103] |
| Specificity | True Negatives / (True Negatives + False Positives) | Probability of a negative test given the patient is well [102] [103] |
| Accuracy | (True Positives + True Negatives) / Total Population | Proportion of all tests that are correct [100] |
| Precision (PPV) | True Positives / (True Positives + False Positives) | Proportion of positive tests that are true positives [100] |
Figure 1: Logical flow for classifying diagnostic test outcomes, leading to the calculation of core metrics.
It is crucial to distinguish sensitivity and specificity from predictive values. While sensitivity and specificity are prevalence-independent characteristics of the test itself, positive predictive value (PPV) and negative predictive value (NPV) are highly dependent on the prevalence of the condition in the population being tested [102]. In a population with high disease prevalence, the same test will have a higher PPV and lower NPV than when used in a population with low prevalence.
Experimental Applications in Microbiology
Comparative Study Design
When evaluating microbiological tests, researchers typically employ comparative study designs that pit new methods against established reference standards. The following diagram illustrates a generalized workflow for such validation studies.
Figure 2: Generalized workflow for the experimental validation of a new microbiological testing method against a reference standard.
Key Research Reagents and Materials
The execution of these comparative studies requires specific reagents and instruments tailored to the testing methodology. The table below catalogues essential research solutions used in modern microbiological diagnostics.
Table 2: Essential Research Reagent Solutions for Microbiological Testing
| Reagent/Material | Function/Application | Example Use Case |
|---|---|---|
| Culture Media | Supports microbial growth for traditional culture-based methods | Potato Dextrose Agar (PDA) for fungal culture [5] |
| Automated Blood Culture Systems | Detects microbial growth in liquid media using automated sensors | BACT/ALERT 3D and VIRTUO for pleural infection diagnosis [94] |
| Selective Lysis Solutions | Selectively removes host cells while preserving pathogen integrity | Sodium cholate hydrate and saponin for sepsis diagnostics [15] |
| Density Gradient Media | Separates cellular components based on density | Lymphoprep for bacterial isolation from blood [15] |
| PCR Reagents | Amplifies target DNA sequences for molecular detection | Primers and probes for fungal pathogen identification [104] |
| Microfluidic Chips | Enables single-cell analysis and trapping | Culture-free bacterial detection from blood [15] |
Comparative Data: Culture vs. Non-Culture Methods
Talaromyces marneffei Diagnosis
Talaromyces marneffei, an opportunistic fungal pathogen endemic in Southeast Asia, illustrates the trade-offs between traditional and modern diagnostic approaches. Conventional culture, while considered a historical gold standard, is time-consuming, taking 10-14 days for full growth and identification, and is susceptible to contamination [5]. Non-culture techniques, including molecular assays and antigen detection, have emerged as valuable complementary tools. For invasive samples like bronchoalveolar lavage fluid or cerebrospinal fluid, metagenomic next-generation sequencing shows promise for early diagnosis due to its reported high sensitivity and specificity, though it is not yet standardized or widely available [5].
Pleural Infection Diagnosis
A recent large-scale comparative study of over 9,000 patients demonstrated the superior sensitivity of automated blood culture systems (ABCS) compared to conventional culture for diagnosing pleural infections [94]. Conventional culture was positive in only 302 (47.8%) patients who had positive results in the ABCS, whereas 330 (52.2%) patients had isolates detected only by ABCS [94]. This significant difference in detection rates highlights the enhanced capability of automated systems to identify pathogens that would be missed by conventional methods.
Table 3: Performance Comparison of Culture-Based Diagnostic Methods
| Test Method | Pathogen/Condition | Sensitivity | Specificity | Turnaround Time |
|---|---|---|---|---|
| Conventional Culture | Talaromyces marneffei | High but slow [5] | High [5] | 10-14 days [5] |
| Conventional Pleural Fluid Culture | Pleural Infection | 47.8% (vs. ABCS) [94] | Not specified | Several days |
| Automated Blood Culture System | Pleural Infection | ~100% (Detected twice as many cases) [94] | High (After excluding contaminants) [94] | Faster than conventional |
| Novel PCR Assay | Histoplasmosis, Blastomycosis, Coccidioidomycosis | 100% [104] | 100% [104] | Hours (vs. days for culture) |
Sepsis Diagnostics
For bloodstream infections, the diagnostic challenge is particularly acute due to low microbial loads (as low as 1-10 colony-forming units per ml of blood) and the critical time sensitivity—every hour of delayed treatment in septic shock decreases survival by 8% [15]. Recent advances in culture-free methods combine smart centrifugation, microfluidic trapping, and deep learning-based detection to identify bacteria from whole blood within 2 hours, a significant improvement over the days often required for traditional culture [15]. This method demonstrated recovery rates of 65% for E. coli, 95% for K. pneumoniae, and 64% for E. faecalis from spiked blood samples at clinically relevant concentrations [15].
Impact on Sampling Plans and Public Health
The performance characteristics of testing methods have profound implications beyond individual patient diagnosis, particularly in fields like food safety where testing informs regulatory decisions. The sensitivity and specificity of a method directly impact the performance of sampling plans, which are designed to detect contaminants in food batches [105].
Low specificity (a high rate of false positives) in sampling plans with high numbers of samples can result in a very high rejection chance of a contamination-free product batch, leading to significant economic waste [105]. Consequently, test methods used in sampling plans with larger number of samples should have a very high specificity (>>99%) [105]. While sensitivity has a smaller effect on sampling plan performance, very low sensitivity can also compromise detection probability, particularly for inhomogeneously distributed contaminants [105]. This statistical reality underscores the importance of method validation in the context of its intended use, especially when the base rate of the condition is low.
The standardized metrics of accuracy, precision, sensitivity, and specificity provide an indispensable framework for the objective evaluation of microbiological testing methods. As the evidence demonstrates, non-culture techniques are increasingly outperforming traditional culture methods in speed and, in many cases, sensitivity—as seen with automated blood culture systems for pleural infections and novel molecular assays for fungal pathogens [94] [104]. However, the choice between methods must consider the clinical context, the consequences of false positives versus false negatives, and the prevalence of the target condition.
Future directions in diagnostic microbiology will likely focus on integrating rapid, high-sensitivity molecular and phenotypic methods while maintaining the specificity required to avoid unnecessary treatments and economic losses. The ongoing validation of these technologies against appropriate standards, with transparent reporting of all four key metrics, will be essential for advancing patient care and public health protection.
ASTM E1326 Guide for Evaluating Non-Culture Microbiological Tests
The field of microbial testing is characterized by a fundamental division between traditional culture-based methods and emerging non-culture techniques. Culture methods, including heterotrophic plate count (HPC), most probable number (MPN), and spread plate techniques, have served as the historical cornerstone for microbial enumeration [106]. These methods rely on the ability of microorganisms to grow in or on nutrient media under controlled conditions, enabling visual detection and counting of colony-forming units. While widely accepted and standardized, these approaches possess significant limitations, particularly their prolonged execution time and limited recovery efficiency, as any single culture method typically recovers only a portion of the total viable microorganisms present in a sample [106].
Non-culture microbiological tests have emerged to address these limitations, offering alternative detection mechanisms that don't solely depend on microbial growth. The ASTM E1326 Standard Guide provides a critical framework for evaluating these non-culture tests, helping users and producers determine their suitability for different sample types and assess the accuracy of their results [106]. This guide acknowledges that while culture methods remain the reference standard for comparison, non-culture techniques can provide valuable alternatives when properly validated, especially for time-sensitive applications or for detecting microorganisms that are difficult to culture.
Within the broader thesis of culture versus non-culture method research, ASTM E1326 establishes the methodological bridge that allows for systematic comparison, recognizing that both paradigms have complementary roles in modern microbiological quality control across pharmaceutical, medical device, and clinical diagnostics applications.
Comparative Analysis of Microbial Testing Methodologies
Fundamental Principles and Performance Characteristics
The divergence between culture and non-culture methods extends beyond mere procedural differences to encompass fundamental differences in detection philosophy, capability, and application suitability.
Table 1: Fundamental Method Characteristics and Applications
| Characteristic | Traditional Culture Methods | Non-Culture Methods |
|---|---|---|
| Basic Principle | Microbial growth in/on nutrient media [106] | Direct detection without cultivation (e.g., ATP content, enzymatic activity) [106] |
| Primary Output | Colony-forming units (CFUs) [106] | Varies by technology (e.g., relative light units, genomic sequences) |
| Typical Time to Result | Days to weeks (3-5 days minimum for bioburden, longer for slow-growers) [107] | Hours to days (potential for same-day results) |
| Microbial Viability Requirement | Required for growth and detection | Not always required (detects cellular components) |
| Recovery Efficiency | Often recovers only a fraction of total viable population [106] | Potentially detects a broader range of organisms |
| Information Provided | Quantitative count, sometimes identification | Quantitative or qualitative; identification depends on method |
| Automation Potential | Generally low | Generally high |
Performance Comparison in Practical Applications
When evaluating method performance against the benchmark of traditional culture techniques, several key metrics emerge from both standardized testing and clinical practice.
Table 2: Operational Performance and Diagnostic Utility Comparison
| Performance Metric | Traditional Culture Methods | Non-Culture Methods | Context and Examples |
|---|---|---|---|
| Sensitivity (General) | Limited by culturability (Varies widely) | Can be extremely high (Varies by technology) | mNGS theoretically lacks bias but can have low sensitivity for fungi/TB [108] |
| Specificity | High (confirmation by growth) | Can suffer from interference/cross-reaction | Antigen tests (e.g., GM, CRAG) show >90% specificity in some contexts [109] |
| Time to Result | 2 days - several weeks [109] | Several hours - 2-3 days | mNGS turnaround includes sample processing, sequencing, and bioinformatics [108] |
| Ability to Detect Mixed Infections | Low (fast-growers may outcompete) [108] | High (theoretically "nets" all pathogens) [108] | mNGS shows higher sensitivity for mixed infections versus culture [108] |
| Quantification Capability | Quantitative (CFU) | Semi-quantitative or quantitative (varies) | Culture is the quantitative reference standard |
| Impact on Clinical Decision Making | Slow, often retrospective | Potentially rapid, can guide initial therapy | mNGS can rapidly identify unexpected pathogens [108] |
Experimental Validation Framework According to ASTM E1326
Core Validation Methodology
The ASTM E1326 guide provides a structured approach to validate that a non-culture method performs equivalently to or better than the reference culture method for its intended purpose. The core validation process involves a comparative experimental design where identical samples are tested by both the non-culture method and the reference culture method. Statistical analysis is then performed on the paired results to determine the level of agreement and any systematic biases [106]. Key steps include:
- Sample Selection: Choosing samples that represent the full range of expected microbial loads and contaminating organisms encountered in routine testing.
- Parallel Testing: Running the non-culture method in parallel with the established reference culture method on aliquots of the same sample.
- Data Correlation: Analyzing the paired results using statistical methods (e.g., regression analysis, Bland-Altman plots) to establish a correlation and determine the accuracy and precision of the non-culture method.
Detailed Experimental Protocol for Method Comparison
A typical validation protocol following the ASTM E1326 framework involves the following detailed steps:
Step 1: Preparation of Inoculated Samples
- Obtain or prepare samples with known, defined microbial loads. This can involve using sterile products inoculated with a known concentration of reference strains (e.g., Bacillus atrophaeus spores) or using naturally contaminated products with characterized bioburden [110].
- The chosen microorganisms should represent the typical flora expected for the product type and include challenging species (e.g., spores for resistance validation).
Step 2: Execution of Comparative Tests
- Test each prepared sample using both the non-culture method and the reference culture method (e.g., membrane filtration, direct plating). The sample size should be sufficient for statistical power [110] [107].
- For the reference method, membrane filtration is often used: the sample is passed through a 0.45µm membrane filter, which is then placed on agar and incubated at 30-35°C for bacteria and 20-25°C for fungi for at least 5 days, followed by colony counting [107].
Step 3: Data Analysis and Equivalence Determination
- Record all quantitative results from both methods.
- Calculate the correlation coefficient, slope, and y-intercept of the regression line comparing the non-culture results to the culture results.
- Establish acceptability criteria for these parameters (e.g., a correlation coefficient >0.95, a slope near 1.0) to declare equivalence.
- Assess the repeatability and reproducibility of the non-culture method across different operators, days, and instrumentations.
The following workflow diagram illustrates the key stages in this validation process:
Essential Research Reagent Solutions and Materials
Successful execution of microbiological tests, whether culture or non-culture, relies on specific, high-quality reagents and materials. The following table details key components essential for the experiments described in this guide.
Table 3: Key Research Reagent Solutions and Materials
| Item Name | Function/Application | Critical Specifications |
|---|---|---|
| Membrane Filter | To capture microorganisms from liquid samples during filtration-based bioburden or sterility testing [107]. | 0.45 µm pore size; compatible with the sample and subsequent culture or analysis [107]. |
| Culture Media | To support the growth and proliferation of microorganisms in culture-based methods and as part of some non-culture detection systems. | Tryptic Soy Agar (TSA) for bacteria, Sabouraud Dextrose Agar (SDA) for fungi; must be sterile and meet performance criteria [107]. |
| Limulus Amebocyte Lysate (LAL) | A key reagent for a non-culture method: detecting bacterial endotoxins in injectable drugs and medical devices [111] [112]. | Validated for sensitivity and compliance with pharmacopeial standards (e.g., USP <85>) [112]. |
| Neutralizing Elution Fluid | To extract microorganisms from product surfaces without killing them, crucial for accurate bioburden testing prior to sterilization [110]. | Must effectively separate microbes from surfaces while maintaining their viability; validated for the specific product type [110]. |
| ATP Detection Reagents | The core of some non-culture tests, detecting adenosine triphosphate as a marker of viable cellular contamination. | High sensitivity and stability; includes luciferase enzyme and substrate. |
| Reference Microbial Strains | Used for method validation, inhibition testing, and ensuring test system control. | Certified strains from recognized culture collections (e.g., ATCC, NCTC). |
The ASTM E1326 guide provides an indispensable, systematic framework for navigating the evolving landscape of microbiological testing. It acknowledges the established role of traditional culture methods as the reference standard for quantitative microbial enumeration while creating a pathway for the integration of valuable non-culture alternatives. The comparative data and validation protocols outlined in this guide empower researchers and quality control professionals to make informed decisions, ensuring that any adopted non-culture method is fit for its intended purpose. As the field continues to advance with technologies like mNGS demonstrating both great promise and clear limitations, the principled, evidence-based evaluation championed by ASTM E1326 remains fundamental to ensuring product safety, efficacy, and public health, effectively bridging the gap between traditional microbial culture and modern non-culture diagnostics.
The laboratory diagnosis of infections is undergoing a fundamental transformation, moving from traditional culture-based techniques that can require several days to yield results toward rapid non-culture-based methods that provide answers in hours. This paradigm shift is particularly critical in the management of wound infections, gastrointestinal pathogens, and soft tissue infections, where timely and appropriate antimicrobial therapy significantly impacts patient outcomes. Culture methods, long considered the gold standard, involve growing microorganisms on specialized media and performing subsequent identification and susceptibility testing. While specific, these processes are slow, typically requiring 48 to 72 hours for a complete workup, and are susceptible to contamination while failing to detect unculturable or fastidious organisms [113] [5]. In contrast, non-culture techniques, including multiplex molecular panels, antigen detection, and advanced imaging technologies, offer rapid turnaround times, often between 2 to 24 hours, enabling swift clinical decision-making [113] [114]. This guide objectively compares the performance of these diagnostic approaches through experimental data, providing researchers and drug development professionals with a clear analysis of their respective capabilities.
Comparative Diagnostic Performance Across Infection Types
The following case studies analyze the operational and performance characteristics of culture versus non-culture methods in three key clinical areas.
Case Study 1: Gastrointestinal Pathogen Detection in Immunocompromised Hosts
Experimental Protocol: A retrospective cohort study compared the BioFire FilmArray Gastrointestinal (GI) Panel (a multiplex nucleic acid test) against conventional stool testing in people with HIV (PWH) presenting with diarrheal symptoms. Conventional testing included stool culture, Clostridium difficile polymerase chain reaction (PCR), direct fluorescent antigen testing for Giardia and Cryptosporidium, and ova and parasite (O&P) examination. The study involved 1941 specimens, with performance metrics assessed based on pathogen detection rates, turnaround time, and impact on clinical management [114].
Table 1: Performance Comparison of GI Pathogen Detection Methods in People with HIV
| Performance Metric | Conventional Stool Testing | Multiplex GI Panel (GPP) |
|---|---|---|
| Total Specimens Tested | 1705 | 236 |
| Positive Detection Rate | 45/1705 (2.6%) | 124/236 (52.5%) |
| Mean Turnaround Time | 71.4 hours | 23.4 hours |
| Co-infection Detection Rate | 13.3% | 48.4% |
| Key Strengths | Detects non-pathogenic parasites; phenotypic susceptibility data | Rapid; high sensitivity; detects viral pathogens and co-infections |
| Key Limitations | Slow; misses viruses and non-culturable bacteria; lower sensitivity | Does not provide phenotypic antimicrobial susceptibility |
Supporting Data: The GPP demonstrated a substantially higher positivity rate and a dramatically shorter mean turnaround time (p < 0.001). It also identified 29 viral infections undetectable by conventional methods and revealed a much higher rate of polymicrobial infections. This led to improved antibiotic stewardship, as unnecessary anti-infective therapy was avoided in cases of exclusively viral infection [114].
Case Study 2: Wound Infection Diagnosis
Experimental Protocol: Diagnosing infection in chronic wounds remains challenging. A systematic review of diagnostic test accuracy studies compared index tests like the Moleculight i:X (a bacterial fluorescence imaging device), elevation of specific enzymes, and bacterial protease activity against the reference standard of deep tissue biopsy microscopy and culture. Studies recruited patients from secondary care wound clinics, and sensitivities and specificities were calculated for the various methods [115].
Table 2: Performance of Novel Diagnostic Methods for Chronic Wound Infection
| Diagnostic Method | Sensitivity (%) | Specificity (%) | Reference Standard |
|---|---|---|---|
| Moleculight i:X (Fluorescence Imaging) | 50 - 75 | 47 - 100 | Deep Tissue Biopsy Culture |
| Bacterial Protease Activity | 50 - 75 | 47 - 100 | Wound Swab Culture |
| Elevation of Wound Fluid Enzymes | 50 - 75 | 47 - 100 | Wound Swab Culture |
| Standard Swab Culture | N/A (Reference) | N/A (Reference) | Deep Tissue Biopsy |
Supporting Data: The reviewed studies found that the sensitivities and specificities of the novel methods varied widely. The evidence quality was not sufficient to recommend their routine use in community settings at present, highlighting the need for more research. Standard culture, while time-consuming, remains a cornerstone of diagnosis but is limited by its inability to comprehensively detect biofilms, anaerobic bacteria, and bacteria in a viable but non-culturable state [115] [116].
Case Study 3: Necrotizing Soft Tissue Infections (NSTIs)
Experimental Protocol: A retrospective review of 100 patients with suspected NSTIs compared the diagnostic performance of radiological imaging (CT or MRI) against microbiological testing (culture and Gram stain of tissue/fluid). Confirmed NSTI status, determined by surgical findings and clinical progression, served as the reference standard. Metrics including sensitivity, specificity, and time to diagnosis were analyzed for both modalities [117]. A separate systematic review specifically analyzed the diagnostic accuracy of MRI and CT, pooling data from multiple studies [118].
Table 3: Diagnostic Performance of Radiology vs. Microbiology for NSTIs
| Diagnostic Metric | Radiological Imaging (CT/MRI) | Microbiological Testing (Culture) |
|---|---|---|
| Sensitivity | 79.4% [117] | 57.1% [117] |
| Specificity | 75.7% [117] | 94.6% [117] |
| Positive Predictive Value (PPV) | 84.7% [117] | 94.7% [117] |
| Negative Predictive Value (NPV) | 68.3% [117] | 56.5% [117] |
| Mean Time to Diagnosis | 5.8 ± 3.8 hours [117] | 18.8 ± 8.2 hours [117] |
| Key Diagnostic Findings | MRI: T2 hyperintensity of deep fascia (Sens: 86.4%, Spec: 65.2%) [118]CT: Presence of gas (Sens: 48.6%, Spec: 93.2%) [118] | Identifies causative organism(s); provides antimicrobial susceptibility profile |
Supporting Data: Radiology provided a significantly faster (p < 0.001) and more sensitive diagnosis, crucial for a time-sensitive condition like NSTI. Microbiology offered superior specificity and a definitive microbiological diagnosis to guide targeted antibiotic therapy but was significantly slower. The agreement between the two modalities was only fair (Cohen’s κ = 0.25), underscoring their complementary, rather than interchangeable, roles [117].
Technical and Implementation Considerations
Experimental Workflows
The fundamental workflows for culture and non-culture methods differ significantly in process and time, as illustrated below for a syndromic panel like a respiratory or GI panel.
Classification of Non-Culture Diagnostic Technologies
The landscape of non-culture diagnostics is diverse, encompassing several technological principles applicable to different specimen types.
The Scientist's Toolkit: Key Research Reagent Solutions
The development and execution of these diagnostic tests rely on a suite of specialized reagents and materials.
Table 4: Essential Research Reagents and Materials for Diagnostic Development
| Reagent/Material | Function/Application | Example Use Case |
|---|---|---|
| Selective Culture Media | Promotes growth of specific pathogens while inhibiting others. | Isolating MRSA from a mixed wound specimen. |
| Nucleic Acid Extraction Kits | Purifies DNA and/or RNA from clinical specimens for molecular assays. | Preparing sample for multiplex PCR panel testing. |
| PCR Master Mixes | Contains enzymes, dNTPs, and buffers necessary for nucleic acid amplification. | Amplifying target pathogen genes in a multiplex PCR panel. |
| Specific Primers & Probes | Short nucleic acid sequences designed to bind and detect unique pathogen genes. | Identifying and differentiating between E. coli and K. pneumoniae in a GI panel. |
| Monoclonal Antibodies | Highly specific antibodies used for immunological antigen detection. | Developing a rapid lateral flow test for a specific fungal antigen (e.g., Talaromyces marneffei) [5]. |
| Electrochemical Substrates | Molecules that produce a measurable electrical signal upon enzyme interaction. | Detecting bacterial protease activity or specific biomarkers like pyocyanin in a wound biosensor [116]. |
| Fluorescent Dyes/Probes | Molecules that fluoresce when bound to specific targets or cellular components. | Visualizing bacteria in wounds using the Moleculight i:X device [115]. |
The comparative data from these case studies clearly demonstrate that non-culture-based diagnostic methods offer significant advantages in speed and, often, sensitivity over traditional culture. This is revolutionizing the management of acute infections, enabling rapid initiation of targeted therapy and bolstering antimicrobial stewardship efforts. However, culture remains indispensable for obtaining phenotypic antimicrobial susceptibility data, which is critical for tracking resistance and managing complicated infections. The future of microbiological diagnostics does not lie in the wholesale replacement of culture but in the strategic integration of these rapid technologies with traditional methods. For researchers and drug developers, the focus should be on creating streamlined workflows that leverage the speed of non-culture tests for initial diagnosis and the precision of culture for guiding subsequent therapy, especially in complex cases. Further development of technologies like biosensors and metagenomic sequencing promises to further close the diagnostic gaps that remain in the field of clinical microbiology.
The accurate and timely identification of pathogens in clinical samples is a cornerstone of effective infectious disease management. For over a century, culture-based methods have served as the gold standard in microbiology laboratories, providing definitive pathogen identification and enabling antimicrobial susceptibility testing [119]. However, the landscape of microbial diagnostics is undergoing a profound transformation with the advent of molecular techniques that offer unprecedented sensitivity, speed, and analytical depth [120] [119].
This paradigm shift is particularly critical for life-threatening conditions such as bloodstream infections and sepsis, where every hour delay in appropriate antimicrobial treatment decreases survival by 7.6% [120]. Traditional culture methods typically require 2-5 days for complete identification and susceptibility testing, creating a dangerous diagnostic void during which clinicians must rely on empiric broad-spectrum antimicrobial therapy [120]. This delay not only compromises patient outcomes but also contributes to the escalating problem of antimicrobial resistance through unnecessary or inadequate antibiotic exposure [120].
The diagnostic challenge is further compounded by the recognition that many infections, particularly bloodstream infections, are polymicrobial in nature, with reported rates ranging from 5-38% and associated mortality risks increased by 2-3 folds compared to monomicrobial infections [120]. Conventional culture methods often struggle to comprehensively characterize complex microbial communities due to differential growth requirements and the potential for fastidious or non-cultivatable organisms to be overshadowed by more robust species [120].
This comparison guide objectively examines the quantitative performance gaps between conventional culture-based methods and modern molecular diagnostics through systematic analysis of experimental data and clinical studies. By synthesizing evidence across multiple infection types and sample matrices, we provide researchers and clinical laboratory professionals with a comprehensive evidence base to inform diagnostic selection and implementation.
Performance Comparison: Quantitative Data Analysis
The transition from culture to molecular methods represents not merely a technological upgrade but a fundamental shift in detection capabilities. The tables below synthesize quantitative performance data across multiple clinical studies and sample types, revealing consistent patterns of enhanced sensitivity and reduced time-to-result with molecular approaches.
Table 1: Comparative sensitivity across pathogen types and sample matrices
| Pathogen | Sample Type | Culture Sensitivity | Molecular Method | Molecular Sensitivity | Reference |
|---|---|---|---|---|---|
| Haemophilus influenzae | Sputum (COPD) | 10.4-26.2% | qPCR | 32.7-47.1% | [121] |
| Moraxella catarrhalis | Sputum (COPD) | 4.1-6.3% | qPCR | 12.9-19.0% | [121] |
| Streptococcus pneumoniae | Sputum (COPD) | 3.8-17.4% | qPCR | 11.0-15.6% | [121] |
| Multiple pathogens | Blood (suspected sepsis) | 4.0% (6/149) | Digital PCR | 28.2% (42/149) | [122] |
| Multiple pathogens | Necrotizing soft tissue | 70% of samples | 16S rRNA/Microseq | 90% of samples | [25] |
Table 2: Time-to-result comparison across diagnostic methodologies
| Methodology | Average Time-to-Result | Key Steps Involved | Impact on Clinical Decision |
|---|---|---|---|
| Conventional blood culture | 2-5 days [120] | Growth detection → subculture → identification → AST | Guides late therapy de-escalation |
| Digital PCR | 4.8 ± 1.3 hours [122] | DNA extraction → partition → amplification → analysis | Enables same-day targeted therapy |
| Real-time PCR (sputum) | <24 hours [121] | Sample processing → DNA extraction → amplification | Informs next-day antibiotic adjustment |
| Blood culture (from positive signal) | 94.7 ± 23.5 hours [122] | Growth detection → identification → confirmation | Delays targeted treatment by days |
| Microcalorimetry (PJI) | ~10-11 hours [123] | Sonication → heat flow measurement → analysis | Potential for same-day intervention |
Table 3: Detection of polymicrobial infections across methodologies
| Methodology | Polymicrobial Detection Capability | Limitations | Clinical Implications |
|---|---|---|---|
| Conventional culture | Variable; reported rates of 5-38% in BSIs [120] | Differential growth rates suppress minority species | Inadequate antimicrobial coverage in 2/3 of polymicrobial BSIs [120] |
| Multiplex PCR (SeptiFast) | Detects 25 common pathogens simultaneously [119] | Limited pathogen panel; predefined targets | Enables broader initial coverage but may miss uncommon pathogens |
| Digital PCR | Detected 63 strains across 42 positive specimens [122] | Limited by primer panel design | More comprehensive profile of co-infecting pathogens |
| 16S rRNA sequencing | Identified additional microorganisms in 90% of NSTI samples [25] | Requires sophisticated bioinformatics | Reveals complex microbial ecology in necrotizing infections |
| Next-generation sequencing | Unbiased detection of diverse microbial communities | Cost, turnaround time, bioinformatics expertise | Most comprehensive view of polymicrobial infections |
Experimental Protocols and Methodologies
Blood Culture and Digital PCR Comparison Study
A 2025 retrospective study directly compared digital PCR (dPCR) with routine blood culture for pathogen detection in 149 patients with suspected infections [122]. The experimental workflow and detailed methodologies are described below.
Detailed Methodological Protocols:
Blood Culture Protocol:
- Two sets of blood culture samples were collected for anaerobic and aerobic culture (10 mL venous blood per culture set) [122]
- Samples were incubated at 37°C in the BacT/ALERT 3D automated system with continuous monitoring for microbial growth [122]
- Positive samples underwent Gram staining followed by subculture on Columbia blood agar plates at 37°C with 5% CO₂ for 18-24 hours [122]
- Isolated pathogens were identified using the Vitek 2 Compact automated identification system [122]
Digital PCR Protocol:
- Whole blood samples were collected in EDTA tubes and centrifuged at 1,600 × g for 10 minutes for plasma separation [122]
- Plasma DNA was extracted using commercial nucleic acid extraction kits (Pilot Gene Technology) and the Auto-Pure10B Nucleic Acid Purification System [122]
- 15 μL of extracted DNA was added to reaction mixtures containing fluorescent probes and primers specific for target pathogens [122]
- The reaction mixture was partitioned into thousands of nanodroplets using a droplet digital PCR system (Pilot Gene) [122]
- PCR amplification was performed with endpoint fluorescence measurement across six detection channels (FAM, VIC, ROX, CY5, CY5.5, A425) [122]
- Data analysis was performed using Gene PMS software with absolute quantification of pathogen load (copies/mL) [122]
Respiratory Pathogen Detection in COPD Studies
The comparative performance of culture versus molecular methods for respiratory pathogens was evaluated across three clinical studies (AERIS, NTHI-004, and NTHI-MCAT-002) involving sputum samples from COPD patients [121].
Culture-Based Methodology:
- Fresh sputum samples were processed with dithiothreitol (DTT) at local clinical laboratories [121]
- Standard culture-based identification procedures were performed according to local laboratory routines with minor adaptations [121]
- Phenotypic characterization and semi-quantitative culture data were reported following standard microbiological practices [121]
- Haemophilus influenzae differentiation from H. haemolyticus required additional microarray analysis or PCR confirmation [121]
Real-time PCR Methodology:
- Frozen DTT-treated sputum samples were transported to a central laboratory for standardized processing [121]
- Multiplex quantitative PCR assays targeted specific respiratory pathogens (H. influenzae, M. catarrhalis, S. pneumoniae) [121]
- Species-specific primers and probes enabled precise identification without cross-reactivity [121]
- Quantitative results provided bacterial load data in addition to presence/absence detection [121]
Key Research Reagent Solutions
The implementation of robust molecular diagnostics requires specialized reagents and systems. The table below details essential research reagents and their applications in microbial detection methodologies.
Table 4: Essential research reagents and systems for microbial detection
| Reagent/System | Application | Function | Example Products/References |
|---|---|---|---|
| BacT/ALERT 3D System | Blood culture automation | Continuous monitoring of microbial growth in blood culture bottles | [122] |
| Nucleic Acid Extraction Kits | DNA purification from clinical samples | Isolation of high-quality microbial DNA from plasma, tissue, or sputum | Pilot Gene Technology kits [122] |
| Digital PCR Reagents | Partition-based absolute quantification | Fluorescent probes and primers for pathogen-specific detection | Pilot Gene dPCR system [122] |
| Dithiothreitol (DTT) | Sputum processing | Mucolysis to release trapped bacteria for culture or molecular analysis | [121] |
| Vitek 2 Compact System | Automated microbial identification | Phenotypic identification and AST of cultured isolates | [122] |
| Matrix-Assisted Laser Desorption Ionization Time-of-Flight (MALDI-TOF) | Microbial identification | Protein profiling for rapid species identification of cultured isolates | [119] |
| 16S rRNA Primers & Reagents | Bacterial phylogenetic analysis | Amplification and sequencing of conserved bacterial ribosomal genes | [25] [124] |
| Multiplex PCR Panels | Syndromic infectious disease testing | Simultaneous detection of multiple pathogens in single sample | LightCycler SeptiFast [119] |
Technological Mechanisms and Signaling Pathways
Molecular diagnostic methods operate through distinct technological mechanisms that define their performance characteristics, advantages, and limitations. The diagram below illustrates the foundational signaling pathways of key molecular detection platforms.
Mechanistic Insights:
PCR-Based Technologies:
- Traditional PCR: Utilizes thermal cycling to exponentially amplify target DNA sequences, with detection via gel electrophoresis [125]. Lacks quantification capabilities and prone to non-specific amplification [125].
- Real-Time PCR (qPCR): Monitors amplification fluorescence in real-time using sequence-specific probes or DNA-binding dyes, enabling quantification via cycle threshold (Ct) values [125] [121]. Provides superior sensitivity and specificity for known pathogens compared to culture [121].
- Digital PCR (dPCR): Partitions reactions into thousands of individual droplets, providing absolute quantification without standard curves and enhanced resistance to PCR inhibitors [122] [125]. Demonstrates significantly higher detection rates (28.2% vs 4.0%) compared to blood culture in sepsis evaluation [122].
Sequencing Technologies:
- 16S rRNA Sequencing: Amplifies and sequences conserved bacterial ribosomal genes, enabling culture-independent community profiling and detection of fastidious organisms [25] [124]. Identified microorganisms in 90% of necrotizing soft tissue infection samples compared to 70% with culture [25].
- Next-Generation Sequencing (NGS): Provides comprehensive pathogen detection through parallel sequencing of millions of DNA fragments, enabling strain-level discrimination and resistance gene detection [123] [125]. Particularly valuable for identifying uncultivable pathogens and polymicrobial infections [120] [124].
- Nanopore Sequencing: Sequences single DNA molecules through protein nanopores, generating long reads in real-time without amplification [125]. Enables rapid pathogen identification but with higher error rates (~5-15%) compared to NGS [125].
Alternative Detection Principles:
- Microcalorimetry: Measures heat flow from microbial metabolism, detecting bacterial growth within hours without molecular amplification [123]. Demonstrates 83% sensitivity and 100% specificity in prosthetic joint infection diagnosis with median detection time of 10 hours [123].
- DNA Microarray: Utilizes hybridization to immobilized DNA probes for multiplex pathogen detection [125]. Limited sensitivity for low-abundance targets and potential for cross-hybridization [125].
- LAMP (Loop-Mediated Isothermal Amplification): Amplifies DNA isothermally without thermal cycling, making it suitable for point-of-care applications [125]. Generally cost-effective with rapid results (30 minutes to few hours) but lower sensitivity than qPCR [125].
Discussion and Clinical Implications
The quantitative data presented in this analysis reveal consistent and substantial detection gaps between conventional culture and molecular methods across diverse clinical scenarios. Molecular techniques demonstrate 2-4 fold higher detection rates for common respiratory pathogens [121] and 7-fold higher positivity rates in bloodstream infection detection [122]. These performance differentials have profound implications for clinical management and antimicrobial stewardship.
The dramatically reduced time-to-result with molecular methods (hours versus days) creates opportunities for earlier targeted antimicrobial therapy, potentially improving outcomes in time-sensitive conditions like sepsis where mortality increases 7.6% per hour of delayed appropriate treatment [120]. Furthermore, the enhanced sensitivity of molecular detection is particularly valuable in patients who have received prior antibiotic therapy, as antibiotics can reduce culture sensitivity while leaving microbial DNA detectable [122] [25].
The superior capability of molecular methods to characterize polymicrobial infections represents another significant advantage, as conventional culture may miss minority species or fastidious organisms in mixed infections [120]. Molecular techniques provided more comprehensive microbial profiles in necrotizing soft tissue infections [25] and detected substantially more co-infecting strains in bloodstream infections [122]. This comprehensive profiling is clinically relevant, as polymicrobial bloodstream infections increase mortality risk by 2-3 fold and are associated with inadequate antimicrobial therapy in approximately two-thirds of cases [120].
Despite these advantages, culture retains important roles in diagnostic microbiology. Culture enables phenotypic antimicrobial susceptibility testing, provides viable isolates for further characterization, and remains widely available and cost-effective for many laboratories [119] [123]. Rather than complete replacement, an integrated approach leveraging the speed and sensitivity of molecular methods for initial detection followed by culture for susceptibility testing may represent the optimal diagnostic pathway.
Future directions in microbial diagnostics include the refinement of multiplex panels targeting broader pathogen ranges, integration of resistance gene detection, and the incorporation of artificial intelligence algorithms to interpret complex molecular data [123]. Additionally, technological advances continue to improve the accessibility, speed, and cost-effectiveness of molecular methods, promising to narrow current detection gaps further and transform the landscape of clinical microbiology.
Statistical Approaches for Method Comparison and Correlation Analysis
The comparison of microbiological test methods is a critical process in clinical and research laboratories, particularly within the evolving paradigm of culture-dependent versus culture-independent techniques. Method comparison studies are performed to assess whether two methods can be used interchangeably without affecting patient results and clinical outcomes [126]. These investigations are essential when introducing new methodologies to replace existing ones, ensuring that the transition does not compromise the quality of data or medical decisions based on these results [126]. The fundamental question these studies address is whether a significant bias exists between methods, and if this bias is large enough to affect their interchangeability [126].
The statistical approaches used in these comparisons must be carefully selected to avoid common pitfalls and misinterpretations. Traditional methods like correlation analysis and t-tests, while commonly reported, are often inadequate for properly assessing method agreement [126] [127]. This guide examines appropriate statistical techniques, experimental designs, and interpretation frameworks for comparing microbiological methods, with particular emphasis on the ongoing transition between culture-based and culture-independent diagnostic approaches.
Fundamental Statistical Concepts in Method Comparison
Key Performance Metrics
When comparing two methodological approaches, several statistical metrics provide insight into their agreement and reliability. Accuracy represents the degree to which a measurement agrees with the true or accepted value, while precision reflects how closely repeated measurements cluster together [16]. These concepts are visually represented in Figure 1, which illustrates the relationship between accuracy and precision in methodological comparisons.
Bias refers to the systematic difference between a measurement and the parameter's true value. Without a reference standard, only relative bias—the difference between test results obtained by different methods—can be assessed [16]. Repeatability measures variability when a single analyst tests replicate specimens from a single sample using the same apparatus, while reproducibility assesses variability among multiple analysts using different equipment and reagents [16].
Inappropriate Statistical Methods
A common misconception in method comparison is that correlation analysis adequately assesses agreement between methods. The correlation coefficient measures the strength of linear association between two variables but reveals nothing about their actual agreement [126] [127]. A high correlation can exist even when there is substantial bias between methods, as correlation is unaffected by changes in measurement scale [127]. Similarly, t-tests (both paired and independent) are inadequate for assessing method comparability, as they may fail to detect clinically meaningful differences with small sample sizes or detect statistically significant but clinically irrelevant differences with large samples [126].
Experimental Design for Method Comparison Studies
Sample Selection and Handling
Proper experimental design is crucial for generating valid method comparison data. According to established guidelines, at least 40 and preferably 100 patient samples should be used to compare two methods [126]. Larger sample sizes help identify unexpected errors due to interferences or sample matrix effects. Samples should be carefully selected to cover the entire clinically meaningful measurement range and should be analyzed within their stability period, preferably within two hours of collection and on the day of sampling [126].
To minimize variability, duplicate measurements for both current and new methods are recommended, with randomized sample sequences to avoid carry-over effects [126]. Measurements should be performed over several days (at least five) and multiple runs to mimic real-world laboratory conditions [126]. These protocols ensure that observed differences reflect true methodological variations rather than artifacts of experimental design.
Defining Acceptance Criteria
Before conducting a comparison study, acceptable bias should be defined based on one of three models in accordance with the Milano hierarchy: (1) the effect of analytical performance on clinical outcomes, (2) components of biological variation of the measurand, or (3) state-of-the-art technological capabilities [126]. This a priori establishment of performance specifications ensures that methodological comparisons address clinically relevant differences rather than merely statistical significance.
Appropriate Statistical Techniques for Method Comparison
Graphical Methods: Difference Plots
Difference plots, particularly Bland-Altman plots, provide intuitive graphical representations of method agreement [126] [128]. These plots display the differences between paired measurements on the y-axis against the average of the two measurements on the x-axis [126]. The visual representation allows immediate identification of systematic biases, proportional errors, and outliers that might affect methodological agreement.
Difference plots offer several advantages over correlation analysis by directly visualizing the magnitude of disagreement between methods and revealing any relationship between the differences and the measurement magnitude [128]. The plot typically includes horizontal lines representing the mean difference (bias) and limits of agreement (mean difference ± 1.96 standard deviations of the differences), providing both a visual and quantitative assessment of method comparability.
Regression Analysis Techniques
While ordinary least squares regression is commonly used in method comparison studies, it has limitations when both methods contain measurement error. Deming regression and Passing-Bablok regression are more appropriate techniques that account for errors in both variables [126]. These methods provide better estimates of the constant and proportional bias between methods, though they require more complex calculations than standard linear regression.
The selection between Deming and Passing-Bablok regression depends on the distribution of errors and the data range. Deming regression assumes normally distributed errors, while Passing-Bablok is non-parametric and more robust for data with outliers or non-normal error distributions [126]. Both approaches provide more reliable information about methodological agreement than correlation coefficients or simple linear regression.
Comparative Analysis: Culture-Dependent vs. Culture-Independent Methods
Performance Characteristics of Major Method Categories
Table 1: Comparison of Culture-Dependent and Culture-Independent Method Characteristics
| Characteristic | Culture-Dependent Methods | Culture-Independent Molecular Methods | Automated Culture Systems |
|---|---|---|---|
| Sensitivity | Limited to culturable organisms (typically <1-5% of total microbiota) [60] [129] | High sensitivity for detectable DNA; can identify >95% of specimens [60] | Enhanced sensitivity compared to conventional culture (52.2% additional detection in pleural infection) [20] |
| Turnaround Time | Days to weeks [5] | Hours to days [5] | Typically 1-7 days [20] |
| Identification Capability | Limited to phenotypic characteristics | Comprehensive community analysis; can detect unculturable, fastidious, and viable but non-culturable bacteria [60] | Similar limitations to conventional culture but with improved detection of culturable organisms [20] |
| Quantification | Semi-quantitative (CFU/mL) | Relative abundance; absolute quantification with specific protocols [60] | Quantitative measures available [20] |
| Cost | Lower equipment costs; labor-intensive | Higher reagent and equipment costs [17] | Moderate to high equipment investment [20] |
| Bias Sources | Selection bias based on growth conditions [129] | DNA extraction efficiency, PCR amplification bias [129] | Similar to conventional culture but with improved detection sensitivity [20] |
Experimental Evidence of Performance Differences
Substantial evidence demonstrates the complementary strengths and limitations of different methodological approaches. In respiratory diagnostics, a study of 46 bronchoalveolar lavage fluid specimens found that culture-independent sequencing identified bacteria in 44 specimens (95.7%), significantly more than the 37 specimens (80.4%) detected by culture [60]. Similarly, in pleural infection diagnosis, automated blood culture systems (ABCS) detected pathogens in 52.2% of patients that were missed by conventional culture methods [20].
The integration of multiple approaches often provides the most comprehensive understanding of microbial communities. In industrial water systems, comparison of culture-dependent biological activity reaction tests (BARTs) with next-generation sequencing (NGS) showed general agreement, though the most abundant taxa sometimes differed between the original sample and the culture-dependent test [50]. This highlights that culture-based methods may not always accurately represent the original sample composition.
Experimental Protocols for Method Comparison
Protocol for Comparing Culture and Molecular Methods
Sample Preparation: Divide samples immediately after collection at the bedside or in the laboratory. For pleural fluid studies, approximately 5-10 mL is inoculated into each aerobic and anaerobic blood culture bottle, while another 5-10 mL is placed in a sterile tube for conventional culture [20]. Promptly transport all samples to the laboratory for processing.
Culture Methods: For conventional culture, inoculate solid media including blood agar plate, MacConkey agar, and Brucella agar. Incubate plates under both aerobic and anaerobic conditions at 37°C for up to 7 days [20]. For automated systems, incubate culture bottles at 37°C for up to 7 days before terminal subculture.
Molecular Methods: Extract DNA from samples using optimized protocols for the specific matrix. For NGS analysis, amplify the V3-V5 hypervariable regions of the bacterial 16S rRNA gene using barcoded primer sets [60]. Perform sequencing using an appropriate platform (e.g., Illumina MiSeq, Roche 454) following established protocols [50] [60].
Data Analysis: Process sequence data using appropriate bioinformatics pipelines (e.g., mothur, USEARCH) [50] [60]. Compare results between methods using difference plots, regression analysis, and quantitative comparison of detection rates and microbial community composition.
Protocol for Statistical Comparison
Data Collection: Ensure paired measurements cover the entire clinically relevant range. Include quality control samples and replicates to assess measurement variability.
Graphical Analysis: Begin with difference plots (Bland-Altman plots) to visualize the agreement between methods and identify any systematic biases or trends [126] [128]. Create scatter plots to assess the relationship between methods across the measurement range.
Statistical Analysis: Perform appropriate regression analysis (Deming or Passing-Bablok) to quantify constant and proportional bias [126]. Calculate the mean difference between methods (bias) and the standard deviation of differences to establish limits of agreement.
Interpretation: Compare the observed bias and limits of agreement to pre-defined acceptability criteria. Determine whether the methods can be used interchangeably based on clinical rather than solely statistical considerations.
Research Reagent Solutions for Method Comparison Studies
Table 2: Essential Research Reagents and Materials for Method Comparison Experiments
| Reagent/Material | Function | Application Examples |
|---|---|---|
| Blood Culture Bottles (Aerobic/Anaerobic) | Enriched medium for microbial growth in automated systems | Automated blood culture systems for body fluid analysis [20] |
| Selective Agar Media (Blood agar, MacConkey, Chromogenic media) | Isolation and differentiation of specific microbial groups | Conventional culture methods for specimen processing [20] |
| DNA Extraction Kits (MoBio PowerSoil, Qiagen DNeasy) | Nucleic acid purification from complex samples | Culture-independent molecular methods [50] [60] |
| 16S rRNA Gene Primers (e.g., 515F/806R) | Amplification of taxonomic marker genes | Microbial community profiling via NGS [50] |
| PCR Master Mixes | Enzymatic amplification of target DNA sequences | Library preparation for sequencing [50] |
| Quantitative PCR Reagents | Absolute quantification of specific targets | Bacterial load assessment [60] |
| Sequence Library Preparation Kits | Preparation of amplicons for high-throughput sequencing | NGS-based microbial identification [50] |
| Preservation Buffers | Stabilization of nucleic acids before processing | Sample storage and transport for molecular assays [50] |
Methodological Workflows and Signaling Pathways
The following diagram illustrates the conceptual relationship and decision pathway for selecting appropriate statistical approaches in method comparison studies:
The statistical comparison of microbiological methods requires careful experimental design and appropriate analytical techniques to yield meaningful conclusions. While culture-dependent and culture-independent methods each have distinct strengths and limitations, their comparison must extend beyond simple correlation analysis to include difference plots and proper regression techniques. The integration of multiple methodological approaches, coupled with rigorous statistical analysis against clinically relevant acceptance criteria, provides the most comprehensive framework for advancing microbiological diagnostics and research.
As technological innovations continue to emerge in both culture-based and molecular methodologies, the principles outlined in this guide will remain essential for validating new approaches and ensuring their appropriate implementation in clinical and research settings. The ongoing evolution of microbiological testing underscores the importance of robust method comparison protocols to guide evidence-based laboratory practice.
Conclusion
The comparison between culture and non-culture microbiological methods reveals a complementary rather than replacement relationship. While non-culture methods offer unprecedented speed, sensitivity, and ability to detect uncultivable or fastidious organisms, culture remains indispensable for antimicrobial susceptibility testing, public health surveillance, and outbreak investigation. Future directions include developing standardized frameworks for validating new technologies, establishing clinical significance thresholds for molecular detection, creating refined algorithms that leverage the strengths of both approaches, and advancing point-of-care applications. For researchers and drug development professionals, strategic integration of both methodologies will be crucial for advancing diagnostic precision, therapeutic development, and patient outcomes in infectious diseases.
References
- 1. Current and Past Strategies for Bacterial Culture in Clinical ... [https://pmc.ncbi.nlm.nih.gov/articles/PMC4284306/]
- 2. Non-culture methods for detecting infection - PMC [https://pmc.ncbi.nlm.nih.gov/articles/PMC5079790/]
- 3. Is it time to substitute culture with molecular diagnostics for ... [https://www.thermofisher.com/blog/clinical-conversations/is-it-time-to-substitute-culture-with-molecular-diagnostics-for-infectious-diseases/]
- 4. Real-time PCR has advantages over culture-based methods ... [https://pmc.ncbi.nlm.nih.gov/articles/PMC10000296/]
- 5. An overview of rapid non-culture-based techniques in ... [https://www.frontiersin.org/journals/cellular-and-infection-microbiology/articles/10.3389/fcimb.2025.1591429/full]
- 6. Evaluation of swabbing methods for culture and non- ... [https://pmc.ncbi.nlm.nih.gov/articles/PMC12422522/]
- 7. Microbiological Safety of Donor Human Milk [https://www.mdpi.com/2076-2607/13/10/2259]
- 8. Limitations of current techniques in clinical antimicrobial ... [https://www.nature.com/articles/s44259-024-00033-8]
- 9. ASTM E 1326 : 2025 Standard Guide for Evaluating Non - culture Microbi [https://www.intertekinform.com/en-au/standards/astm-e-1326-2025-139689_saig_astm_astm_3617929/]
- 10. ASTM E1326 : 2025 Standard Guide for Evaluating Non - culture ... [https://www.bsbedge.com/standard/standard-guide-for-evaluating-non-culture-microbiological-tests-astm-e1326-25/ASTM120659]
- 11. Microbiological Non-Culture-Based Methods for ... [https://www.mdpi.com/2075-4418/13/16/2718]
- 12. 5 Characteristics Of Forward-Thinking Microbiology Labs In ... [https://www.pharmaceuticalonline.com/doc/characteristics-of-forward-thinking-microbiology-labs-in-2025-0001]
- 13. Clinical Microbiology in the Year 2025 - PMC - PubMed Central [https://pmc.ncbi.nlm.nih.gov/articles/PMC139721/]
- 14. Diagnostic accuracy of non-culture methods for the ... [https://pubmed.ncbi.nlm.nih.gov/40596932/]
- 15. Culture-free detection of bacteria from blood for rapid ... [https://www.nature.com/articles/s41746-025-01948-w]
- 16. COMPARING MICROBIOLOGICAL TEST METHODS – PART 1 [https://biodeterioration-control.com/comparing-microbiological-test-methods-part-1/]
- 17. Comparative evaluation of microbial community and ... [https://www.sciencedirect.com/science/article/pii/S0717345825000053]
- 18. Which is a Better Lab Test, PCR or Culture? [https://americanpharmacogenomicsassociation.com/li-newsletter/pcr-or-culture/]
- 19. Comparative analysis of three experimental methods for ... [https://bmcmicrobiol.biomedcentral.com/articles/10.1186/s12866-025-03985-7]
- 20. Comparison of conventional culture and automated blood ... [https://pmc.ncbi.nlm.nih.gov/articles/PMC12323579/]
- 21. Comparative Performance Evaluation of Continuous ... [https://pmc.ncbi.nlm.nih.gov/articles/PMC11854677/]
- 22. Gold standard (test) [https://en.wikipedia.org/wiki/Gold_standard_(test)]
- 23. What is gold standard and what is ground truth? - PMC [https://pmc.ncbi.nlm.nih.gov/articles/PMC4296658/]
- 24. A Comparative Evaluation of Different Diagnostic Modalities in ... [https://pmc.ncbi.nlm.nih.gov/articles/PMC5121673/]
- 25. Comparing culture and molecular methods for the ... - PMC [https://pmc.ncbi.nlm.nih.gov/articles/PMC5100109/]
- 26. gold standard for viruses, but don't let culture go just yet? [https://pubmed.ncbi.nlm.nih.gov/25719855/]
- 27. Challenging the “gold standard” of colony-forming units [https://www.sciencedirect.com/science/article/pii/S0168160521003767]
- 28. Antimicrobial Susceptibility Testing: A Comprehensive Review ... [https://pmc.ncbi.nlm.nih.gov/articles/PMC9024665/]
- 29. Personalised antimicrobial susceptibility testing with ... [https://www.nature.com/articles/s41467-024-54192-3]
- 30. Microbiology Culture Market Boosted by Pharma Innovation [https://www.towardshealthcare.com/insights/microbiology-culture-market-sizing]
- 31. Microbial Culture Market Size, Share & Growth Trends ... [https://www.researchnester.com/reports/microbial-culture-market/2774]
- 32. Next generation sequencing as a panacea for antibiotic ... [https://pmc.ncbi.nlm.nih.gov/articles/PMC12399536/]
- 33. Comparative analysis of metagenomic next-generation ... [https://bmcmicrobiol.biomedcentral.com/articles/10.1186/s12866-025-03887-8]
- 34. Ensuring accuracy in the development and application of ... [https://www.sciencedirect.com/science/article/pii/S0098299724000347]
- 35. Analytical performance evaluation of a multiplex real-time RT ... [https://pmc.ncbi.nlm.nih.gov/articles/PMC12317686/]
- 36. Development of a Melting-Curve-Based Multiplex Real ... [https://pmc.ncbi.nlm.nih.gov/articles/PMC10672821/]
- 37. Smart-Plexer: a breakthrough workflow for hybrid ... [https://www.nature.com/articles/s42003-023-05235-w]
- 38. Development of multiplex real-time PCR for simultaneous ... [https://peerj.com/articles/18238/]
- 39. Leveraging digital technologies to enhance multiplexing in ... [https://www.sciencedirect.com/science/article/pii/S016599362300050X]
- 40. Four-color multiplex real-time PCR assay prototype ... [https://pmc.ncbi.nlm.nih.gov/articles/PMC6757406/]
- 41. A MALDI-ToF mass spectrometry database for identification ... [https://www.nature.com/articles/s41597-025-04504-z]
- 42. Evaluation of the identification performance of MALDI-TOF ... [https://pmc.ncbi.nlm.nih.gov/articles/PMC12323580/]
- 43. Global MALDI TOF Mass Spectrometry Market Report 2025 ... [https://www.cognitivemarketresearch.com/maldi-tof-mass-spectrometry-market-report]
- 44. Evaluation of MALDI-TOF systems (autof MS 1000) in ... [https://www.sciencedirect.com/science/article/pii/S0167701225002258]
- 45. MALDI-TOF Mass Spectrometer Market Size & Share 2025- ... [https://www.360iresearch.com/library/intelligence/maldi-tof-mass-spectrometer]
- 46. An antimicrobial drug recommender system using MALDI- ... [https://elifesciences.org/reviewed-preprints/93242v1]
- 47. Evaluation of the identification performance of MALDI-TOF ... [https://pubmed.ncbi.nlm.nih.gov/40503826/]
- 48. Comparative Evaluation of Conventional Methods Versus ... [https://healthcare-bulletin.co.uk/article/comparative-evaluation-of-conventional-methods-versus-maldi-tof-for-identification-of-fungal-isolates-in-covid-19-associated-mucormycosis-3712/]
- 49. Performance of Short‐Term Culture and Direct MALDI‐TOF ... [https://pmc.ncbi.nlm.nih.gov/articles/PMC12379042/]
- 50. A Comparison of the Microbial Populations in a Culture ... [https://www.mdpi.com/2673-8007/4/3/73]
- 51. Evaluation and Comparison of Serological Methods for COVID ... [https://pmc.ncbi.nlm.nih.gov/articles/PMC8343015/]
- 52. Immunoassay Methods - Assay Guidance Manual - NCBI - NIH [https://www.ncbi.nlm.nih.gov/books/NBK92434/]
- 53. Immunoassays: Analytical and Clinical Performance ... [https://www.mdpi.com/1422-0067/25/4/2080]
- 54. An Indirect Comparison of Diagnostic Accuracy for Seven ... [https://pmc.ncbi.nlm.nih.gov/articles/PMC12418076/]
- 55. Development of Immunoassays for Foodborne Pathogenic ... [https://www.mdpi.com/2079-6374/15/5/318]
- 56. Recent Advances in the Evaluation of Serological Assays ... [https://www.frontiersin.org/journals/public-health/articles/10.3389/fpubh.2020.620222/full]
- 57. Comparison of six COVID-19 serology assays for detection ... [https://pmc.ncbi.nlm.nih.gov/articles/PMC12282051/]
- 58. Detection of pathogenic bacteria by magneto-immunoassays [https://pmc.ncbi.nlm.nih.gov/articles/PMC8383173/]
- 59. Advantages and Limitations of 16S rRNA Next-Generation ... [https://pmc.ncbi.nlm.nih.gov/articles/PMC7602188/]
- 60. Analysis of Culture-Dependent versus ... [https://pmc.ncbi.nlm.nih.gov/articles/PMC4187760/]
- 61. Comparative evaluation of sequencing platforms [https://pmc.ncbi.nlm.nih.gov/articles/PMC12365774/]
- 62. Advantages and challenges of metagenomic sequencing ... [https://pmc.ncbi.nlm.nih.gov/articles/PMC9527156/]
- 63. 16S vs Metagenomics: What's the Difference? [https://www.cosmosid.com/blog/16s-vs-metagenomics-whats-the-difference/]
- 64. 16S rRNA Gene Sequencing vs. Shotgun Metagenomic ... [https://blog.microbiomeinsights.com/16s-rrna-sequencing-vs-shotgun-metagenomic-sequencing]
- 65. Performance and Application of 16S rRNA Gene Cycle ... [https://pmc.ncbi.nlm.nih.gov/articles/PMC7484979/]
- 66. Evaluation of 16S-Based Metagenomic NGS as Diagnostic ... [https://pmc.ncbi.nlm.nih.gov/articles/PMC11434932/]
- 67. Comparative diagnostic performance of metagenomic and ... [https://www.nature.com/articles/s41598-025-11834-w]
- 68. Comparison of microbial culture, metagenomic next ... [https://pmc.ncbi.nlm.nih.gov/articles/PMC12343261/]
- 69. Novel technologies for the diagnosis of urinary tract infections [https://pmc.ncbi.nlm.nih.gov/articles/PMC11837515/]
- 70. Syndromic diagnostic testing: a new way to approach patient ... [https://pmc.ncbi.nlm.nih.gov/articles/PMC8460095/]
- 71. Uncovering the value of syndromic testing | LabLeaders [https://diagnostics.roche.com/global/en/article-listing/lab-leaders/article/syndromic-testing-respiratory-infections.html]
- 72. Systematic review Performance of molecular tests ... [https://www.sciencedirect.com/science/article/pii/S1198743X24005937]
- 73. Comparison of three cartridge-based platforms for ... [https://www.sciencedirect.com/science/article/pii/S0732889324001378]
- 74. Performance of the QIAstat-Dx Gastrointestinal Panel for ... [https://pmc.ncbi.nlm.nih.gov/articles/PMC7041566/]
- 75. A comparative study using Xpert MTB/RIF and culture ... [https://www.frontiersin.org/journals/cellular-and-infection-microbiology/articles/10.3389/fcimb.2025.1539240/full]
- 76. Clinical utility of PCR compared to conventional culture ... [https://www.sciencedirect.com/science/article/pii/S0732889324004255]
- 77. PCR vs. Microbial Culture: Is it Time for a Diagnostic ... [https://www.reviewofophthalmology.com/article/pcr-vs-microbial-culture-is-it-time-for-a-diagnostic-paradigm-shift]
- 78. Microbial culture vs. mNGS: diagnostic variations in ... [https://www.frontiersin.org/journals/cellular-and-infection-microbiology/articles/10.3389/fcimb.2025.1611332/full]
- 79. Bacterial gastroenteritis in the world of culture-independent ... [https://pmc.ncbi.nlm.nih.gov/articles/PMC12210883/]
- 80. Detection of β-lactam resistance genes in Gram-negative ... [https://www.frontiersin.org/journals/cellular-and-infection-microbiology/articles/10.3389/fcimb.2025.1597700/full]
- 81. Comparative analysis of three experimental methods for ... [https://pmc.ncbi.nlm.nih.gov/articles/PMC12039119/]
- 82. Rapid Identification of Microorganisms Directly from Blood ... [https://brieflands.com/journals/jjm/articles/161075]
- 83. Polymicrobial Infections: A Comprehensive Review on ... [https://www.mdpi.com/2813-9054/70/4/39]
- 84. Molecular Methodologies for Improved Polymicrobial Sepsis ... [https://pmc.ncbi.nlm.nih.gov/articles/PMC9104822/]
- 85. Detection of bacterial pathogens from clinical specimens ... [https://bmcinfectdis.biomedcentral.com/articles/10.1186/s12879-017-2727-8]
- 86. Antimicrobial Susceptibility Testing - StatPearls - NCBI - NIH [https://www.ncbi.nlm.nih.gov/books/NBK539714/]
- 87. Preanalytical Errors in Clinical Laboratory Testing at a ... [https://pmc.ncbi.nlm.nih.gov/articles/PMC10981510/]
- 88. Pre-Analytical Phase - an overview [https://www.sciencedirect.com/topics/immunology-and-microbiology/pre-analytical-phase]
- 89. Pre-Analytical Variables [https://www.practical-haemostasis.com/Quality%20Assurance/pre_analytical_variables.html]
- 90. Comparison of culture-independent and dependent ... [https://www.sciencedirect.com/science/article/pii/S0147651320311052]
- 91. The Era of Molecular and Other Non-Culture-Based Methods ... [https://pmc.ncbi.nlm.nih.gov/articles/PMC2806664/]
- 92. Comprehensive Microbial Control Strategy [https://www.bioprocessintl.com/qa-qc/beyond-traditional-microbiology-testing-developing-a-comprehensive-strategy-for-microbial-control-and-detection]
- 93. E1326 Standard Guide for Evaluating Non-culture ... [https://www.astm.org/e1326-20.html]
- 94. Comparison of conventional culture and automated blood ... [https://pubmed.ncbi.nlm.nih.gov/40503837/]
- 95. August 1st 2025: Cost/Benefit Analysis of Drug Screening ... [https://www.proscreening.com/newsletter/august-1st-2025-costbenefit-analysis-of-drug-screening-methods]
- 96. Understanding Cost Benefit Analysis: A Comprehensive ... [https://www.labmanager.com/cost-benefit-analysis-19939]
- 97. Cost-Benefit Analysis of Laboratory Automation [https://www.wakoautomation.com/cost-benefit-analysis-of-laboratory-automation-unveiling-the-financial-advantages]
- 98. Avalon 2025 Lab Trend Report: Genetic Testing Soars as ... [https://www.avalonhcs.com/newsroom/avalon-2025-lab-trend-report-genetic-testing-soars-as-routine-testing-stabilizes/]
- 99. Effective Resource Allocation Models in Pharmaceutical R&D [https://www.linkedin.com/pulse/resource-allocation-models-pharmaceutical-rd-kiran-kumar-y-v-ljlcc]
- 100. Accuracy, Precision, Sensitivity, Specificity, and F1 | Sabor Edge [https://saboredge.com/accuracy-precision-sensitivity-specificity-F1]
- 101. Accuracy, precision, specificity & sensitivity [https://labtestsonline.org.uk/articles/accuracy-precision-specificity-sensitivity]
- 102. Diagnostic Testing Accuracy: Sensitivity, Specificity, Predictive ... [https://www.ncbi.nlm.nih.gov/books/NBK557491/]
- 103. Sensitivity and specificity [https://en.wikipedia.org/wiki/Sensitivity_and_specificity]
- 104. New test bests culture method by quickly detecting 3 fungal ... [https://www.cidrap.umn.edu/fungal-infection/new-test-bests-culture-method-quickly-detecting-3-fungal-pathogens-once]
- 105. Microbial testing in food safety: effect of specificity and ... [https://www.sciencedirect.com/science/article/abs/pii/S2214799316300790]
- 106. ASTM E1326-20 评估非文化微生物测试标准指南引用关系 [https://m.antpedia.com/standard/1406693195-7.html]
- 107. 生物负载测试 [https://www.sigmaaldrich.com/HK/zh/applications/microbiological-testing/bioburden-testing?srsltid=AfmBOooJtKSBCXx2h5Q_bDph5ucDUxNOnt2r-VsUZjWGGEgwpAWNT8lF]
- 108. mNGS会颠覆我们在感染性疾病上的认知吗?三个小故事看它与 ... [https://www.kanhuxi.com/documents/%E5%AD%A6%E6%9C%AF/6826/]
- 109. 侵袭性真菌病病原学非培养实验室诊断方法 [http://www.sysucc.org.cn/node/6024]
- 110. 生物负载测试与无菌测试:有什么区别? [https://namsa.com/zh-CN/resources/blog/bioburden-testing-vs-sterility-testing-what-is-the-difference/]
- 111. Microbiology & Its Role In Drug Development [https://www.quotientsciences.com/blog/what-role-does-microbiology-play-supporting-drug-development]
- 112. The Importance of Microbiology Testing for ... [https://infinitylaboratories.com/the-importance-of-microbiology-testing-for-pharmaceuticals-and-medical-devices/]
- 113. Molecular techniques v. conventional culture: Should there ... [https://pmc.ncbi.nlm.nih.gov/articles/PMC12490501/]
- 114. Comparison of Multiplex Gastrointestinal Pathogen Panel and ... [https://pmc.ncbi.nlm.nih.gov/articles/PMC6970129/]
- 115. A systematic review of diagnostic test accuracy studies [https://pubmed.ncbi.nlm.nih.gov/37574778/]
- 116. Wound infection: A review of qualitative and quantitative ... [https://www.sciencedirect.com/science/article/abs/pii/S1748681521006057]
- 117. Comparative Study of Radiological vs Microbiological ... [https://healthcare-bulletin.co.uk/article/comparative-study-of-radiological-vs-microbiological-diagnostics-in-necrotizing-soft-tissue-infections-a-retrospective-review-3673/]
- 118. Diagnostic performance of MRI and CT in diagnosing ... [https://pubmed.ncbi.nlm.nih.gov/34302500/]
- 119. The changing culture of the microbiology laboratory - PMC [https://pmc.ncbi.nlm.nih.gov/articles/PMC3852448/]
- 120. A 'Culture' Shift: Application of Molecular Techniques for ... [https://pmc.ncbi.nlm.nih.gov/articles/PMC6447436/]
- 121. Real-time PCR has advantages over culture-based ... [https://www.frontiersin.org/journals/microbiology/articles/10.3389/fmicb.2022.1098133/full]
- 122. Comparative analysis between digital PCR and blood ... [https://pmc.ncbi.nlm.nih.gov/articles/PMC12515817/]
- 123. Beyond Cultures: The Evolving Role of Molecular ... [https://www.mdpi.com/2077-0383/14/19/6886]
- 124. Experimental design and quantitative analysis of microbial ... [https://genomebiology.biomedcentral.com/articles/10.1186/s13059-017-1359-z]
- 125. A Comparison of Molecular Methods for Microbial Testing [https://krakensense.com/blog/a-comparison-of-molecular-methods-for-microbial-testing]
- 126. Statistical analysis in method comparison studies part one [https://acutecaretesting.org/en/articles/statistical-analysis-in-method-comparison-studies-part-one]
- 127. Correlation coefficient (method comparison) [https://analyse-it.com/docs/user-guide/method-comparison/correlation-coefficient]
- 128. Method comparison--a different approach [https://pubmed.ncbi.nlm.nih.gov/1444169/]
- 129. Culture-independent methods for identifying microbial ... [https://www.sciencedirect.com/science/article/abs/pii/S074000200800107X]