Beyond 16S: Leveraging Comparative Genomics for Advanced PCR Primer Development in Biomedical Research
This article provides a comprehensive overview of the application of comparative genomics for developing highly specific PCR primers, moving beyond traditional targets like the 16S rRNA gene.
Beyond 16S: Leveraging Comparative Genomics for Advanced PCR Primer Development in Biomedical Research
Abstract
This article provides a comprehensive overview of the application of comparative genomics for developing highly specific PCR primers, moving beyond traditional targets like the 16S rRNA gene. It covers the foundational principles of pan-genome analysis, detailing methodological workflows and bioinformatics tools for target selection and primer design. The content further addresses critical troubleshooting and optimization strategies to enhance assay performance and emphasizes rigorous validation protocols and comparative analyses against existing methods. Aimed at researchers, scientists, and drug development professionals, this guide synthesizes recent advances to enable the creation of robust, specific detection assays for pathogens and probiotics, with significant implications for diagnostics, public health, and therapeutic development.
From Core Genome to Unique Markers: The Foundational Principles of Comparative Genomics in Primer Design
In the fields of molecular biology and genetics, a pan-genome (or pangenome) represents the entire set of genes from all strains within a clade, capturing the full genetic repertoire of a species or group of organisms [1]. This concept was originally developed for bacteria and archaea but has since been extended to eukaryotic species, including plants and humans [1] [2]. The pan-genome framework provides a powerful lens for understanding genetic diversity, evolution, and adaptation, with particularly valuable applications in developing precise molecular detection tools such as PCR primers for pathogens [3]. This guide explores the structure of the pan-genome and objectively compares how its different components are leveraged in modern genomic analysis.
The Architectural Divisions of the Pan-Genome
The pan-genome is conceptually divided into three main parts based on their distribution across individual strains: the core genome, the accessory genome, and the strain-specific genes [1] [4].
The Core Genome
The core genome comprises genes shared by every single genome within the analyzed set [1]. These genes are fundamental to the basic biology and survival of the species, typically encoding functions related to central metabolism, DNA replication, transcription, and translation [4]. In practice, the core genome is often subdivided. The hard core includes gene families present in 100% of genomes, while a soft or extended core may include genes present above a high frequency threshold, such as 90% or 95% of genomes [1]. The size of the core genome is highly dependent on the phylogenetic similarity of the strains being compared; comparing very diverse strains or an entire genus will yield a smaller core than comparing closely-related strains of a single species [1].
The Accessory Genome
Also known as the shell genome, the accessory genome consists of genes present in two or more, but not all, strains [1]. This pool of genes reflects the genetic flexibility of a species and is often enriched for functions related to niche adaptation, such as virulence factors, antibiotic resistance genes, and specialized metabolic pathways [1] [4]. Genes can move into this category from the core genome through lineage-specific gene loss or can be incorporated from the strain-specific cloud via horizontal gene transfer and subsequent fixation in a population [1].
The Cloud Genome (Strain-Specific Genes)
The cloud genome, or strain-specific genome, contains genes found in only a single strain [1]. These singleton genes are a major driver of genetic diversity and are frequently acquired through horizontal gene transfer from other species or through rapid evolution from existing genes [4]. They are crucial for understanding the unique ecological adaptations and functional capabilities of individual strains.
Table: Summary of Pan-Genome Components
| Component | Definition | Typical Functions | Presence Across Strains |
|---|---|---|---|
| Core Genome | Genes shared by all strains [1]. | Primary metabolism, essential housekeeping [4]. | 100% (Hard core) or >95% (Soft core) [1]. |
| Accessory (Shell) Genome | Genes present in some, but not all, strains [1]. | Niche adaptation, virulence, antibiotic resistance [1] [4]. | 2 to 95% of strains [1]. |
| Cloud (Strain-Specific) Genome | Genes unique to a single strain [1]. | Ecological specialization, recent horizontal gene transfer [1] [4]. | < 10% of strains, often just one [1]. |
Comparative Analysis: Open vs. Closed Pan-Genomes
A critical classification in pan-genomics is whether a group of organisms has an open or closed pan-genome. This is determined by applying Heaps' law ((N=kn^{-\alpha})), where (N) is the number of gene families, (n) is the number of genomes, and (k) and (\alpha) are constants [1].
- Open Pan-Genome: Characterized by (\alpha \leq 1). In this state, the total number of gene families continues to increase significantly with every new genome sequenced, suggesting a vast and diverse gene pool [1]. Species with large population sizes and high niche versatility, such as Escherichia coli (with a pan-genome of ~89,000 gene families), typically have open pan-genomes [1].
- Closed Pan-Genome: Characterized by (\alpha > 1). Here, the rate of new gene discovery drops off rapidly, and the total pan-genome size approaches an asymptote after a certain number of sequenced genomes [1]. This is often observed in obligate pathogens or specialist species like Staphylococcus lugdunensis [1].
Table: Comparison of Open and Closed Pan-Genome Characteristics
| Feature | Open Pan-Genome | Closed Pan-Genome |
|---|---|---|
| Heap's Law Alpha (α) | α ≤ 1 [1] | α > 1 [1] |
| New Gene Discovery | High with each new genome [1] | Low to zero with new genomes [1] |
| Genetic Diversity | High | Low |
| Typical Niches | Multiple, versatile environments [1] | Restricted, specialist environments [1] |
| Example Organism | Escherichia coli [1] | Streptococcus pneumoniae [1] |
Experimental Protocols for Pan-Genome Analysis
The standard workflow for a pan-genome analysis involves several key steps, from data preparation to computational analysis [4].
Genome Annotation Homogenization
The first critical step is to (re)annotate all genomes using the same software pipeline (e.g., GeneMark or RAST) to ensure consistency in gene calling and functional prediction, which is essential for accurate ortholog identification [4].
Orthology Analysis and Pan-Genome Calculation
Homogenized genomes are then processed by specialized software to identify groups of orthologous genes. This step is highly sensitive to parameters like percentage identity and alignment coverage used to define orthologs [4]. For instance, an analysis of E. coli showed that increasing these parameters from 50%/50% to 90%/90% can expand the predicted pan-genome from 13,000 to 18,000 gene families and alter the Heap's law alpha value [4]. Commonly used tools include:
- Roary: A fast tool for prokaryotic pan-genome analysis, though it may have lower sensitivity with highly divergent genomes [3].
- BPGA (Bacterial Pan Genome Analysis Pipeline): Incorporates functional annotation and is user-friendly [3].
- PGAP-X: A scalable and modular pipeline suitable for large datasets but with higher computational demands [3].
- panX: Integrates phylogenetic and genomic analyses with interactive visualization [3].
Open vs. Closed Pan-Genome Determination
The gene presence/absence matrix generated by the software is used to model pan-genome size as a function of the number of genomes sampled. The fitted Heaps' law parameters determine whether the pan-genome is classified as open or closed [1].
Application in PCR Primer Development: A Comparative Guide
The pan-genome concept is revolutionizing PCR primer design by enabling a shift from single, often imperfect markers like the 16S rRNA gene to highly specific targets derived from comparative genomics [3]. The choice of which pan-genome component to target depends on the desired specificity of the diagnostic assay.
Table: Comparison of Primer Design Strategies Based on Pan-Genome Components
| Target Region | Specificity Level | Advantages | Limitations | Experimental Validation Data |
|---|---|---|---|---|
| Core Genome | Species or Genus | High sensitivity; detects all strains [3]. | Cannot differentiate between sub-species or serovars [3]. | The ssaQ gene (core) was used for LAMP-based detection of Salmonella with higher sensitivity than conventional PCR [3]. |
| Accessory Genome | Sub-species, Serogroup, or Ecotype | Enables discrimination below the species level [3]. | May miss strains lacking the target accessory gene. | Primers for the Salmonella E serogroup were designed using Roary and validated on artificially contaminated food samples [3]. |
| Strain-Specific Cloud | Single Strain | Ultimate specificity for tracking outbreaks or specific pathogens [5]. | Very narrow detection range. | PathoGD pipeline uses k-mer analysis of entire genomes (including strain-specific regions) to design highly specific gRNAs for CRISPR diagnostics [5]. |
Experimental Protocol for Comparative Genomics-Based Primer Design
- Genome Dataset Curation: A comprehensive set of genome sequences for the target organism(s) and related non-target organisms is assembled [3] [5].
- Pan-Genome Analysis: Software like BPGA, Roary, or panX is used to compute the pan-genome and identify genes belonging to the core, accessory, or strain-specific compartments [3].
- Target Gene Selection: A gene is selected based on the desired specificity. For broad detection, a universal core gene is chosen. For specific detection, an accessory gene unique to a serogroup or a strain-specific marker is selected [3] [5].
- Primer Design and In Silico Validation: Primers are designed for the selected gene. Tools like PathoGD can automate this and include an in silico PCR step against all target and non-target genomes to estimate sensitivity and specificity before lab testing [5].
- Laboratory Validation: The designed primers are tested in the lab using real-time or conventional PCR against a panel of confirmed target and non-target strains to determine analytical specificity and sensitivity, often in relevant matrices like food samples [3].
Successful pan-genome analysis and subsequent primer design rely on a suite of bioinformatics tools and laboratory reagents.
Table: Key Research Reagent Solutions for Pan-Genome Analysis and Primer Validation
| Item Name | Function/Brief Explanation | Example Tools/Products |
|---|---|---|
| Genome Annotation Pipeline | Provides consistent gene predictions across all genomes in the study, forming the basis for orthology analysis. | RAST, GeneMark [4] |
| Pan-Genome Analysis Software | Computes the core, accessory, and strain-specific gene sets from multiple annotated genomes. | BPGA, Roary, PGAP-X, panX [3] |
| Primer/gRNA Design Algorithm | Designs specific oligonucleotide sequences for PCR amplification or CRISPR-based detection of selected genomic targets. | PathoGD, PrimedRPA [5] |
| Polymerase Chain Reaction (PCR) Mixes | Enzymes, buffers, and nucleotides used in the laboratory to experimentally validate the sensitivity and specificity of designed primers. | Real-time PCR kits, conventional PCR master mixes [3] |
| Reference Genomic DNA | High-quality DNA from target and non-target strains, essential as positive and negative controls during assay validation. | Genomic DNA from ATCC/DSMZ strains |
For decades, the 16S ribosomal RNA (rRNA) gene has served as the cornerstone of microbial identification and phylogenetic studies. Its conserved nature allows for broad phylogenetic comparisons, while its variable regions provide species-specific signatures. However, the very features that made it ubiquitous—conserved regions for primer binding and variable regions for differentiation—also constitute its fundamental weaknesses. As microbiome research advances toward more precise diagnostic and therapeutic applications, the limitations of 16S rRNA gene sequencing have become increasingly apparent, driving the field toward comparative genomic approaches for developing assays with superior specificity. This guide objectively compares the performance of traditional 16S rRNA-based methods against emerging genomics-powered alternatives, providing researchers with the experimental data needed to inform their molecular tool selection.
Fundamental Limitations of 16S rRNA Gene Sequencing
Primer-Dependent Biases and Variable Region Selection
The choice of which hypervariable region(s) of the 16S rRNA gene to amplify significantly influences the observed microbial composition, making cross-study comparisons problematic.
- Lack of Consensus Protocol: Research reveals that characterization of genital tract taxa is hindered by a lack of a consensus protocol and 16S rRNA gene region target, preventing meaningful comparison between studies [6].
- Primer-Specific Clustering: In human gut samples, the use of different primer pairs led to primer-specific clustering rather than donor-specific clustering. These composition differences were more pronounced at lower taxonomic levels (e.g., genus) compared to higher levels (e.g., phylum) [7].
- Critical Taxon Omission: Specific but important taxa can be missed entirely by certain primer pairs. For example, primers 515F-944R fail to detect Bacteroidetes, a major phylum in the human gut [7].
Table 1: Impact of Variable Region Selection on Microbial Community Profiling
| Targeted V-Region | Key Limitations | Representative Affected Taxa |
|---|---|---|
| V1-V2 | Reduced off-target human DNA amplification in biopsy samples [8] | More suitable for low-biomass human samples |
| V3-V4 | Susceptible to off-target human DNA amplification; wastes sequencing reads [8] | Homo sapiens mitochondrial DNA (common off-target) |
| V4 | Commonly used but offers intermediate taxonomic resolution [7] | Varies by ecosystem and primer design |
| V4-V5 | Can miss major bacterial phyla entirely [7] | Bacteroidetes |
| V6-V8 | Lower discrimination power for certain Lactobacillus species [6] | L. iners, L. crispatus |
Insufficient Taxonomic Resolution
A primary failure of 16S rRNA sequencing is its frequent inability to resolve identities at the species or strain level, which is critical for understanding pathogenicity and function.
- Species-Level Discrimination: The discriminatory power of the 16S rRNA gene is often too low to confidently distinguish between closely related species, such as different Lactobacillus species in the genital tract [6]. This casts doubt on the long-held view that a healthy female genital tract is universally characterized by a Lactobacillus sp.-dominant microbiota, as all lactobacilli may not provide the same protective function [6].
- False Positives/Negatives in Detection: When used for PCR detection of specific pathogens, the 16S rRNA gene has been associated with false-positive and false-negative results. This is because the gene may not contain sufficient sequence variation to distinguish between pathogenic and non-pathogenic close relatives [3] [9].
Technical and Analytical Challenges
Beyond biology, technical and bioinformatic workflows introduce their own set of biases and artifacts.
- Off-Target Amplification: In samples with an overwhelming ratio of human to bacterial DNA (e.g., breast tumor biopsies), 16S rRNA primers can erroneously amplify human DNA. One study found that 77.2% of all Amplicon Sequence Variants (ASVs) from breast tumor samples aligned to the human genome, predominantly mitochondrial DNA, when using the common V3-V4 primer set [8].
- Bioinformatic Processing Variations: The choice of clustering methods (OTUs vs. ASVs), reference databases (GreenGenes, SILVA, RDP), and analysis parameters (e.g., sequence truncation length) drastically influences taxonomic outcomes. For instance, ASV algorithms like DADA2 can suffer from over-splitting of sequences from the same strain, while OTU algorithms like UPARSE may over-merge genetically distinct sequences [10] [7].
- Database Discrepancies: Comparing datasets across studies can be misleading due to differences in database nomenclature and classification precision. For example, the same organism may be classified as Enterorhabdus in one database and Adlercreutzia in another [7].
The Paradigm Shift: Comparative Genomics for Primer Development
The limitations of single-gene targeting have catalyzed a shift towards comparative genomics, which leverages entire genome sequences to discover highly specific genetic markers.
Core Principles of the Approach
Comparative genomics differentiates between the core genome (genes shared by all strains of a species) and the accessory genome (genes unique to specific strains or subspecies) [3]. Pan-genome analysis, a key method in this field, systematically identifies these regions across a large collection of genomes, allowing for the selection of target sequences that are uniquely present in the pathogen of interest and entirely absent from near neighbors.
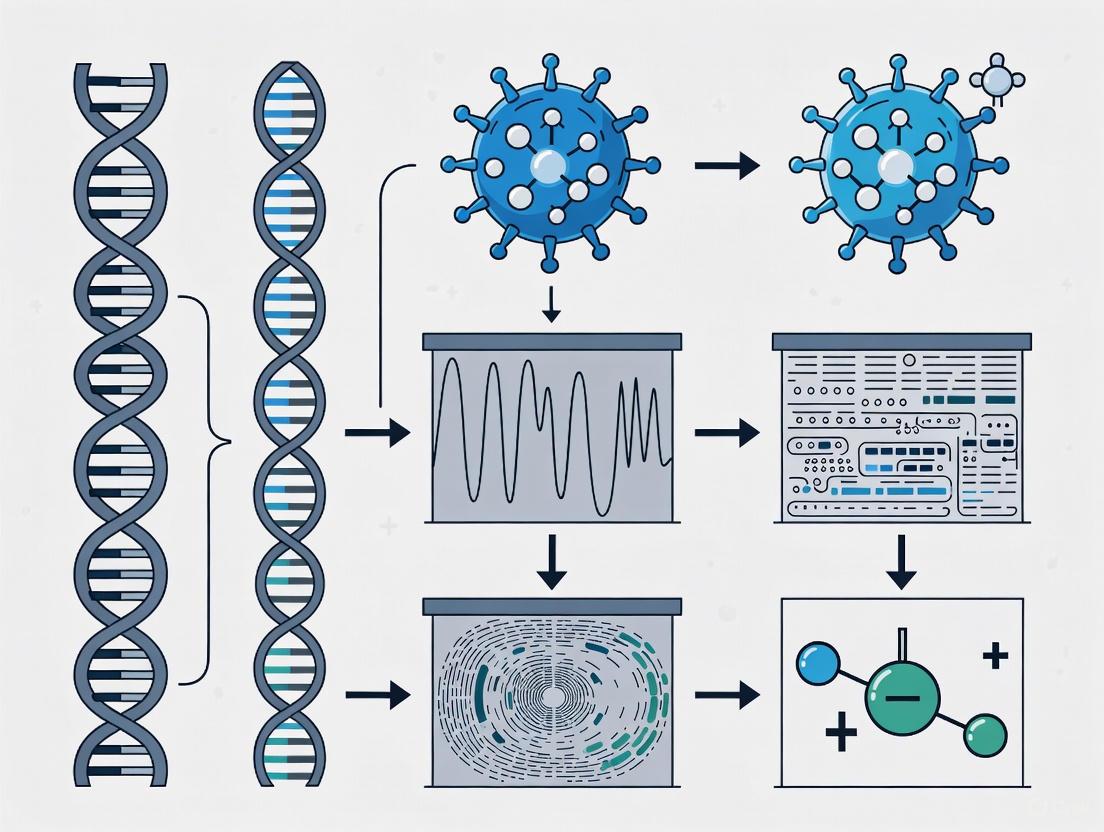
Experimental Workflow: From Genomes to Validated Assays
The following diagram illustrates the comprehensive workflow for developing subspecies-specific PCR assays through comparative genomics.
Figure 1: Workflow for Comparative Genomics-Based PCR Assay Development
Key Experimental Protocols
Protocol 1: Pan-Genome Analysis for Marker Discovery
- Genome Curation: Collect a diverse set of high-quality genome assemblies for the target organism (e.g., Salmonella Montevideo) and its close relatives [3] [11].
- Annotation and Pan-Genome Construction: Annotate all genomes using a tool like Prokka. Input the resulting GFF files into a pan-genome analysis tool such as Roary or BPGA to cluster genes into orthologous groups [3] [11].
- Identification of Specific Markers: Use software like Scoary to identify genes that are present in >90% of the target subspecies' genomes but in <10% of the other subspecies' genomes. These genes become candidate targets for specific PCR assay development [11].
Protocol 2: In silico and In vitro Validation
- In silico Specificity Check: Test the designed primer sequences in silico against a large database of public genomes (e.g., using BLAST against the NCBI database or a custom database) to calculate preliminary sensitivity and specificity. A well-designed assay should show >97% sensitivity and >98% specificity at this stage [11].
- Wet-Lab PCR Specificity Testing: Perform conventional or real-time PCR with the candidate primers against a panel of genomic DNA from the target organism and a wide range of non-target species (e.g., 33 species across related genera) to confirm no false positives occur [9].
- Sensitivity Determination: Establish the detection limit of the assay by performing PCR with serial dilutions of pure genomic DNA from the target organism (e.g., down to 2 pg/μL) and/or with samples artificially inoculated with a known concentration of bacterial cells (e.g., 8.8 × 10³ CFU/gram) [9].
Head-to-Head Comparison: 16S rRNA vs. Comparative Genomics
The following tables synthesize experimental data from published studies, providing a direct performance comparison between the two approaches.
Table 2: Performance Comparison for Bacterial Detection
| Performance Metric | 16S rRNA Gene Approach | Comparative Genomics Approach |
|---|---|---|
| Taxonomic Resolution | Often limited to genus level [6] | Species and subspecies level [9] [11] |
| Specificity (Experimental) | Prone to false positives with closely related species [3] | High; distinguishes target from >30 related species [9] |
| Sensitivity (Detection Limit) | Varies with primer set and biomass | As low as 2 pg/μL genomic DNA [9] |
| Cross-Study Comparability | Low; highly variable due to primer and protocol differences [6] [7] | High; based on absolute genetic markers |
| Application in Complex Matrices | Affected by host DNA in low-biomass biopsies [8] | Validated in spiked food samples (e.g., chicken, pepper) [3] |
Table 3: Analysis of Developed Assays for Specific Pathogens
| Target Pathogen | Method Used | Key Outcome | Reference |
|---|---|---|---|
| Mycobacterium abscessus subsp. | Comparative Genomics (Roary) | Developed multiplex PCR discriminating all 3 subspecies with >97% sensitivity, >98% specificity [11] | Frontiers in Cellular and Infection Microbiology, 2022 |
| Clavibacter michiganensis subsp. nebraskensis (Cmn) | Comparative Genomics | Specific detection with a limit of 2 pg/μL; no cross-reaction with 33 related species [9] | The Plant Pathology Journal, 2018 |
| Salmonella enterica serovar Montevideo | Comparative Genomics (panX) | Primer-probe sets showed high sensitivity/selectivity in food matrices (raw chicken, peppers) [3] | Foods, 2025 |
| Lactobacillus species in genital tract | 16S rRNA (V5-V8 regions) | Hindered species-level characterization due to lack of discriminatory power [6] | Frontiers in Cell and Developmental Biology, 2021 |
Table 4: Key Research Reagent Solutions for Advanced Primer Development
| Tool/Reagent Category | Specific Examples | Function in Workflow |
|---|---|---|
| Pan-Genome Analysis Software | Roary, BPGA, panX, PGAP-X [3] | Rapid identification of core and accessory genomes from large genomic datasets. |
| In silico Validation Databases | NCBI GenBank, RefSeq, SILVA [7] [12] | Provides comprehensive sequence data for specificity testing against non-target organisms. |
| Specificity Testing Panels | Genomic DNA from target and related species (e.g., 33+ species) [9] | Experimental confirmation of primer specificity across a broad phylogenetic range. |
| Online Primer Design Tools | NCBI Primer-BLAST [12] | Integrates primer design with specificity checking against selected databases. |
| Validated Primer Databases | PrimerBank [13] [14] | Repository of experimentally validated primers for gene expression (though primarily mammalian). |
The evidence demonstrates that 16S rRNA gene sequencing, while a revolutionary tool for initial microbial ecology surveys, possesses inherent limitations in resolution, specificity, and reproducibility that render it insufficient for precise diagnostic applications. The drive for higher specificity is powerfully addressed by comparative genomics, which provides a robust framework for developing PCR assays capable of distinguishing pathogens at the subspecies level even in complex sample matrices. While 16S sequencing retains utility for broad, discovery-phase studies, the future of molecular detection and diagnostics in research and drug development lies in leveraging the full power of genomic data to create assays whose accuracy meets the demands of modern science and medicine.
Comparative genomics has revolutionized the development of PCR assays for microbial detection and identification. The core concept underpinning this approach is the pangenome, which describes the full complement of genes in a species, comprising the core genome (genes shared by all strains) and the accessory genome (genes present in some strains) [15]. Pangenome analysis enables researchers to identify unique genetic markers that are specific to a pathogen, a serovar, or even a particular subspecies, thereby providing the foundation for highly specific PCR assays [3]. This methodology overcomes the limitations of traditional targets, such as the 16S rRNA gene, which can lack sufficient resolution for distinguishing between closely related microbial species and has been associated with false-positive results [3]. This guide provides a comparative overview of four key bioinformatics tools—PGAP-X, Roary, BPGA, and panX—that enable researchers to conduct these essential analyses.
Tool Comparison at a Glance
The table below summarizes the core characteristics, strengths, and limitations of the four bioinformatics tools, providing a quick reference for researchers to evaluate which tool might best suit their project needs.
Table 1: Key Features of PGAP-X, Roary, BPGA, and panX
| Tool | Core Methodology & Model | Primary Strengths | Primary Limitations | Typical Use-Case |
|---|---|---|---|---|
| PGAP-X | Integrates whole-genome alignment and orthologous clustering using a synteny-based algorithm [16]. | Provides visualization of genome structure variation and alignment; distinguishes paralogs using conserved genomic location [16]. | Has higher computational demand and requires more advanced bioinformatics skills [3]. | In-depth comparative analysis visualizing structural dynamics and specific marker discovery. |
| Roary | Clusters protein sequences based on sequence similarity (BLAST/DIAMOND) and pre-defined identity thresholds [17] [18]. | Extremely fast and efficient; easy to use with a low learning curve and extensive community support [3] [18]. | Sensitive to annotation quality; provides fewer corrections for fragmented genes or contamination [17] [18]. | Rapid baseline pangenome analysis for pilot surveys or when speed is a priority. |
| BPGA (Bacterial Pan Genome Analysis Pipeline) | Clusters orthologous genes and incorporates extensive functional profiling and annotation [3] [15]. | User-friendly with comprehensive functional analysis modules (e.g., COG, GO, pathway mapping) [15]. | Has limited scalability for very large datasets and demands high-quality genome assemblies [3]. | Projects where functional interpretation of core and accessory genes is a primary goal. |
| panX | Clusters gene families and visualizes them within a phylogenetic context [15] [18]. | Interactive web interface for exploring pangenome, phylogeny, and genetic variation; excellent for collaboration [3] [18]. | Limited scalability; requires setup and storage for the interactive platform [3] [18]. | Collaborative projects and exploratory analysis where visual data sharing is valuable. |
Performance and Experimental Data
Different tools employ distinct algorithms for orthologous gene clustering, which is a fundamental step in pangenome construction that directly impacts the identification of specific genetic targets for PCR assays.
Table 2: Comparative Analysis of Tool Methodologies and Outputs
| Tool | Clustering Method | Paralog Handling | Typical Outputs for Primer Development | Scalability |
|---|---|---|---|---|
| PGAP-X | Novel in-house algorithm based on whole-genome alignment with progressiveMauve [16]. | Synteny-based; uses conserved genomic location to differentiate paralogs [16]. | Genome-wide alignment views, high-substitution region identification, orthologous clusters. | Suited for small to medium-sized datasets [3]. |
| Roary | BLAST/DIAMOND for all-vs-all alignment, then MCL clustering [17]. | Limited; primarily relies on sequence similarity with user-defined thresholds [18]. | Presence-absence matrix of genes, core genome alignment, phylogenetic tree. | Fast for small-medium bacterial cohorts [18]. |
| BPGA | Supports multiple algorithms (USEARCH, CD-HIT, OrthoMCL) for clustering [15]. | Not a central feature; focuses on functional characterization of clusters. | Functional profiles (COG, GO), phyletic patterns, pangenome profile curves. | Limited by its functional analysis depth; best for focused datasets [3]. |
| panX | DIAMOND for alignment followed by Markov Clustering (MCL) [15]. | Phylogenetic tree-based visualization to interpret gene gain and loss [18]. | Interactive pangenome browser, phylogenetic tree mapped with gene presence/absence. | Limited scalability, but interactive for explored datasets [3]. |
A practical example of this workflow comes from a study on Mycobacterium abscessus, where researchers used Roary to analyze 318 genomes and identify 15 subspecies-specific genes. These genes were subsequently used to design PCR assays with high sensitivity and specificity [11]. In another study on Xanthomonas citri pv. citri, comparative genomic analysis of 30 target and 30 non-target genomes led to the identification of a specific DNA marker, which was then used to develop a highly specific qPCR assay [19].
Experimental Protocols for Primer Development
Standard Workflow for Pangenome-Driven PCR Assay Development
The following diagram outlines the generalized experimental protocol for developing a PCR assay using pangenome analysis.
Detailed Protocol for Pangenome Analysis and Marker Identification
The general workflow can be broken down into the following key experimental steps:
Genome Collection and Curation: Assemble a diverse and high-quality set of genome sequences for the target organism. This dataset should include both the strains you aim to detect and closely related non-target strains to ensure marker specificity. As per Vernikos et al., a minimum of five genomes is recommended, though larger numbers (dozens to hundreds) are preferable for robust results [15]. Genome quality should be assessed using tools like QUAST to filter out low-quality assemblies based on criteria such as the number of contigs and N50 values [11].
Genome Annotation: Consistent and accurate annotation of all genomes is critical. This can be achieved using rapid standalone tools like Prokka [20] or web-based systems like RAST [20]. Using the same annotation tool and parameters across all genomes minimizes technical variation that could artificially inflate the accessory genome [18].
Pangenome Construction and Orthologous Clustering: Execute the pangenome analysis using your chosen tool (e.g., PGAP-X, Roary, BPGA, or panX). This step clusters all coding sequences from the input genomes into orthologous groups. Key parameters to consider include the sequence identity cut-off for clustering and the method for handling paralogous genes [17]. The output will classify genes into core, accessory, and strain-specific sets.
Identification of Specific Markers: Analyze the pangenome output to find genes meeting your specificity criteria. For a species-specific assay, look for genes present in all target genomes but completely absent from all non-target genomes. Tools like Scoary can be used to perform association analysis and statistically link genes to a particular subspecies or phenotype [11].
In Silico Primer Design and Validation: Design primer sequences for the selected specific gene markers. The primer sequences should then be validated in silico by checking for matches against a large database of both target and non-target genomes, for example, using BLAST or tools like Abricate [11]. This step confirms the theoretical specificity and sensitivity of the assay before moving to the laboratory.
The Scientist's Toolkit: Essential Research Reagents and Materials
The following table lists key reagents, software, and data resources required for pangenome analysis and the subsequent development and validation of PCR assays.
Table 3: Essential Resources for Pangenome-Driven PCR Assay Development
| Category | Item | Specific Examples | Function in Workflow |
|---|---|---|---|
| Bioinformatics Software | Pangenome Analysis Tool | PGAP-X, Roary, BPGA, panX [3] [16] [18] | Core analysis to identify orthologous gene clusters and specific markers. |
| Genome Annotation Tool | Prokka [20], RAST [20] | Provides consistent gene calling and functional annotation for all input genomes. | |
| Primer Design & Validation | Primer-BLAST [21], Abricate [11] | Designs primers and checks for specificity against public databases. | |
| Data Resources | Genome Sequence Database | NCBI GenBank, RefSeq [21] [22] | Source for public genome sequences of both target and non-target strains. |
| Variant/Presence Database | CARD (resistance genes) [20] | Used for screening out mobile genetic elements or known resistance genes. | |
| Laboratory Reagents | DNA Extraction Kit | Monarch Genomic DNA Purification Kit [11] | High-quality DNA extraction from bacterial strains or infected plant material. |
| PCR Reagents | PCR Master Mix, qPCR Probes [19] | Enzymes, buffers, and fluorescent probes for conventional and real-time PCR. | |
| Positive Control DNA | Genomic DNA from target strain [19] | Essential for validating and optimizing the PCR assay conditions. |
The selection of a pangenome tool is a strategic decision that directly influences the success of PCR assay development. PGAP-X offers deep insights into genomic context and structural variation, while Roary is unmatched for rapid, large-scale analyses. BPGA excels in functional interpretation, and panX provides an unparalleled platform for collaborative exploration and data sharing. By understanding the comparative strengths, methodologies, and outputs of these tools, researchers can make an informed choice, ensuring the identification of robust genetic markers for highly specific and sensitive PCR diagnostics.
Comparative genomics has revolutionized the development of precise molecular detection methods for differentiating genetically similar bacterial species. This is particularly critical in food safety and clinical diagnostics for pathogens like Listeria monocytogenes, a serious foodborne pathogen, and its non-pathogenic counterpart Listeria innocua. These two species share approximately 88.4% of their protein-coding genes and exhibit a high degree of genomic synteny, making differentiation through conventional methods challenging [23] [24]. This case study examines how comparative genomic analyses have enabled researchers to identify genetic targets for accurate differentiation, develop specific PCR-based assays, and overcome limitations of traditional detection methods that often yield false positives or require time-consuming culturing processes [25].
The significance of proper differentiation between these species extends beyond academic interest. L. monocytogenes causes listeriosis, a disease with mortality rates reaching up to 40% in vulnerable populations, while L. innocua is generally considered non-pathogenic [26]. Regulatory requirements, such as the "zero tolerance" policy for L. monocytogenes in ready-to-eat foods in the USA, necessitate highly accurate detection methods to prevent unnecessary product recalls while ensuring public health protection [26]. This case study explores how comparative genomics has provided solutions to these challenges through the identification of species-specific genetic markers.
Background on Listeria Species
Biological and Genomic Characteristics
The genus Listeria comprises diverse species, with L. monocytogenes and L. innocua representing two closely related members of the Listeria sensu stricto group [27]. Both species are Gram-positive, facultatively anaerobic, non-spore forming rods found in similar environmental niches [23] [26]. Despite their genetic similarity, they differ profoundly in their pathogenic potential, with L. monocytogenes possessing specialized virulence mechanisms absent in L. innocua.
Key genomic comparisons reveal that L. monocytogenes and L. innocua share 2,523 orthologous genes, representing 88.4% of L. monocytogenes protein-coding genes [23]. The fundamental genetic differences lie primarily in pathogenicity islands and virulence-associated genes. L. monocytogenes contains critical virulence genes such as hly (encoding listeriolysin O) and actA, which enable intracellular survival and actin-based motility, while L. innocua lacks these determinants of pathogenicity [24]. Recent research has also identified significant divergence between the species in their repertoire of non-coding RNAs, with L. monocytogenes possessing 113 small RNAs and 70 antisense RNAs, some of which regulate virulence processes [23].
The Diagnostic Challenge
Traditional methods for differentiating Listeria species rely on biochemical profiling and phenotypic characteristics, including hemolysis patterns, sugar fermentation tests, and the CAMP test [26] [28]. These methods are laborious, time-consuming (requiring up to 5 days for confirmation), and occasionally yield ambiguous results due to atypical strains [26] [25].
The primary challenge in molecular differentiation stems from the high degree of DNA sequence similarity between L. monocytogenes and L. innocua. Early PCR methods targeting conserved genes like 16S rRNA often failed to provide sufficient discriminatory power [3]. More concerningly, recent comparative genomic studies have identified a novel subgroup of L. innocua with even closer genomic affiliations to L. monocytogenes, leading to false positives with conventional iap gene-based PCR tests [25]. These limitations highlighted the urgent need for more sophisticated approaches to genetic marker selection.
Comparative Genomics Approaches
Fundamental Principles
Comparative genomics for primer development relies on identifying genetic regions that are conserved within a target species but divergent in non-target species. This approach utilizes several key analytical frameworks:
Pan-genome analysis: Categorizes genomic content into core genes (shared by all strains), accessory genes (present in some strains), and unique genes (specific to particular strains) [3]. The core genome provides potential targets for genus-level detection, while species-specific genes enable differentiation.
Phylogenetic profiling: Identifies genes with distinct evolutionary patterns between pathogenic and non-pathogenic species, often revealing virulence-associated genetic elements.
Sequence divergence mapping: Pinpoints variable regions within otherwise conserved genes, allowing for the design of primers that target hypervariable segments with maximum discriminatory power [28].
These approaches have been facilitated by the development of specialized bioinformatics tools such as Roary for rapid pan-genome analysis, BPGA (Bacterial Pan Genome Analysis pipeline) for functional annotation, and panX for interactive phylogenetic visualization [3] [29].
Application to Listeria Differentiation
In applying comparative genomics to Listeria differentiation, researchers have employed multiple strategies. One successful approach involved analyzing the iap gene, which encodes the p60 protein common to all Listeria species but contains species-specific internal portions [28]. By targeting these variable regions, researchers developed a multiplex PCR system capable of simultaneously detecting and differentiating multiple Listeria species with a single reaction [28].
More recently, comprehensive pan-genomic analysis of 343 L. monocytogenes strains from different geographical regions identified novel target genes (bglF_1 and davD) that show absolute specificity for L. monocytogenes [29]. These genes, involved in fundamental metabolic processes, were present in 100% of L. monocytogenes strains but completely absent in non-target bacteria, including L. innocua and other related species [29].
Table 1: Bioinformatics Tools for Comparative Genomics in Primer Development
| Tool | Primary Function | Advantages | Limitations |
|---|---|---|---|
| Roary | Pan-genome analysis & visualization | Fast and efficient; suitable for prokaryotes | Lower sensitivity with highly divergent genomes [3] |
| BPGA | Functional annotation & orthologous group clustering | User-friendly; provides functional insights | Limited scalability for large datasets [3] |
| panX | Phylogenetic & genomic integration | Interactive visualization; combines evolutionary context | Limited customization options [3] |
| PGAP-X | Whole-genome alignments & variation analysis | High scalability for large datasets | High computational demands; requires bioinformatics expertise [3] |
Experimental Protocols and Data
Pan-Genome Analysis for Target Identification
A 2024 study by Zhang et al. provides a comprehensive protocol for identifying novel diagnostic targets through comparative genomics [29]. The methodology proceeds through several key stages:
Genome retrieval and annotation: Researchers retrieved 343 L. monocytogenes genomes from NCBI databases, prioritizing strains isolated from cerebrospinal fluid to ensure clinical relevance. Additionally, 12 other Listeria species and non-Listeria bacterial genomes were selected as outgroups. All genomes were annotated using Prokka v1.14.6 to identify protein-coding sequences [29].
Pan-genome construction and analysis: The annotated genomes were analyzed using Roary v3.11.2 with a BLASTP identity cutoff of 85% to define the pan-genome. Genes were categorized as:
- Core genes: Present in all isolates
- Soft-core genes: Present in ≥95% of isolates
- Shell genes: Present in 15-95% of isolates
- Cloud genes: Present in <15% of isolates [29]
Target gene screening: Potential target genes were selected based on 100% presence in all L. monocytogenes strains and complete absence in non-target bacterial strains. Candidate genes were further validated by BLAST analysis against nucleotide collection (nr/nt) databases to confirm specificity [29].
This systematic approach identified bglF_1 and davD as highly specific targets for L. monocytogenes detection. Subsequent PCR validation demonstrated excellent specificity, with no cross-reactivity to L. innocua or other related species [29].
Multiplex PCR Development Based on iap Gene
An earlier but influential study by Bubert et al. (1999) developed a multiplex PCR system targeting the iap gene [28]. The experimental workflow included:
Primer design: Through comparative analysis of iap gene sequences from all known Listeria species, researchers identified both conserved and species-specific regions. They designed a single conserved downstream primer (Lis1B) derived from the 3' end that binds to all Listeria species, and four species-specific upstream primers targeting:
- L. monocytogenes (MonoA)
- L. innocua (Ino2)
- L. grayi (MugraI)
- A group comprising L. ivanovii, L. seeligeri, and L. welshimeri (Siwi2) [28]
PCR conditions: Reaction mixtures contained 100 ng of each primer, 200 μM dNTPs, 1.5 mM MgCl₂, 1× PCR buffer, 50-100 ng of chromosomal DNA, and 1.5 U of Taq polymerase. Amplification was performed with an initial denaturation at 94°C for 5 minutes, followed by 35 cycles of denaturation (94°C, 1 minute), annealing (52°C, 1 minute), and extension (72°C, 1 minute), with a final extension at 72°C for 7 minutes [28]
Product detection: Amplification products were separated by agarose gel electrophoresis, with species identification based on distinct band sizes: L. grayi (480 bp), L. monocytogenes (660 bp), L. innocua (870 bp), and the L. ivanovii/seeligeri/welshimeri group (1.2 kb) [28].
This multiplex PCR system enabled simultaneous detection and differentiation of multiple Listeria species in a single reaction, significantly reducing processing time compared to cultural methods.
Table 2: Comparison of Detection Methods for L. monocytogenes and L. innocua
| Method Type | Time to Result | Key Differentiating Features | Limitations |
|---|---|---|---|
| Traditional Culture (ISO 11290-1) | Up to 5 days [26] | Biochemical profiles, hemolysis patterns, CAMP test [26] | Lengthy process; requires confirmatory testing |
| Single iap Gene PCR | 24-48 hours [28] | Amplification of species-specific iap regions [28] | False positives with novel L. innocua subgroups [25] |
| Comparative Genomics-Based PCR | <30 hours [26] [29] | Targets pan-genome identified markers (e.g., bglF_1, davD) [29] | Requires extensive genomic analysis prior to implementation |
| Duplex Real-time PCR | <24 hours [25] | Simultaneous detection with specific primer-probe sets | Potential matrix effects in complex food samples [25] |
Visualization of Experimental Workflows
The following diagram illustrates the comprehensive workflow for developing species-specific detection methods using comparative genomics:
Comparative Genomics Workflow for Diagnostic Development
The Scientist's Toolkit: Research Reagent Solutions
Successful implementation of comparative genomics for species differentiation requires specialized reagents and bioinformatics tools. The following table outlines essential resources referenced in the studies analyzed:
Table 3: Essential Research Reagents and Tools for Comparative Genomics-Based Detection
| Reagent/Tool | Specific Application | Function/Purpose | Example Sources/Platforms |
|---|---|---|---|
| Pan-genome Analysis Software | Identification of core/accessory genes | Determines species-specific genetic targets | Roary, BPGA, PGAP-X, panX [3] [29] |
| Primer Design Tools | PCR assay development | Designs species-specific primers with optimal properties | Primer-BLAST, OligoAnalyzer, specific algorithms for multiplex PCR [28] |
| Enrichment Media | Food/environmental sample processing | Selective growth of Listeria while inhibiting competitors | Buffered Listeria Enrichment Broth (BLEB), Fraser Broth, ONE Broth [26] |
| Chromogenic Agar Media | Culture confirmation | Differentiation of Listeria species by colony appearance | ALOA, OCLA, CHROMagar Listeria [26] |
| DNA Polymerase Systems | PCR amplification | Enzymatic amplification of target sequences | Taq polymerase with optimized buffer systems [28] |
| Real-time PCR Master Mixes | Quantitative detection | Fluorescence-based detection of amplification products | Probe-based chemistries (e.g., TaqMan) with internal controls [25] |
The application of comparative genomics to the differentiation of genetically similar species like L. monocytogenes and L. innocua represents a significant advancement over traditional detection methods. By moving from single-gene targets to pan-genome analyses, researchers can identify highly specific genetic markers that enable accurate, rapid, and simultaneous detection of multiple species [29] [25]. These approaches have proven particularly valuable for addressing challenges such as the emergence of novel subspecies that confound conventional PCR methods [25].
The implications extend beyond Listeria detection, establishing a paradigm for differentiating closely related species across microbiology. As genomic databases expand and bioinformatics tools become more sophisticated, comparative genomics-driven assay development will likely become the standard for molecular diagnostics in food safety, clinical microbiology, and public health surveillance. Future directions may include real-time metagenomic detection directly from complex samples, further reducing the reliance on culture-based methods and shortening detection times from days to hours.
A Step-by-Step Workflow: Applying Comparative Genomics for Primer and Probe Development
This guide outlines the computational and experimental workflow for identifying specific genetic markers for PCR primer development through comparative genomics. This methodology enables researchers to move beyond traditional targets, like the 16S rRNA gene, which can sometimes yield false-positive results, toward highly specific markers for detecting individual strains, serotypes, or species [3].
Core Workflow and Key Stages
The process of identifying a specific marker, from initial genome collection to final primer validation, can be broken down into six key stages. The following diagram illustrates this logical workflow and the relationships between each stage.
Bioinformatics Tools for Comparative Genomics
The computational phase relies on specialized software for pan-genome analysis. The table below compares the properties, advantages, and limitations of commonly used tools [3].
| Tool | Property | Advantage | Limitation |
|---|---|---|---|
| Roary | Core genome analysis with pre-clustering approach (High speed) | - Fast and efficient- Visualization of output data | - Limited to bacterial genome- Low sensitivity in highly divergent genome |
| BPGA (Bacterial Pan Genome Analysis pipeline) | Incorporation of functional annotation and orthologous group clustering | - Identification of functional insight- Ease to use | - Limited scalability- Demand of high-quality genome assemblies |
| PGAP-X | Scalable and modular architecture | - High scalability- Suitable for large dataset and customization | - High computational demand- High bioinformatics skill demand |
| EDGAR | Web-based tool focusing on visualization | - Intuitive (web interface)- Comprehensive visualization- Small genome set handling | - Limited scalability- Dependency on web interface |
| panX | Integration of phylogenetic and genomic visualization | - Interactive visualization- Combination of evolutionary context with genomic insight | - Limited scalability |
These tools help categorize genomic content into a core genome—shared by all strains and crucial for basic growth and survival—and an accessory genome—unique to specific strains and informative for genomic adaptability and specialized lifestyles [3]. For marker development, targets can be chosen from either category, depending on the desired specificity (e.g., universal for a species vs. specific to a single serotype).
Experimental Protocols and Validation
After bioinformatics identification, candidate markers require rigorous laboratory testing. The following methodologies are commonly used for validation.
Diagnostic PCR and Specificity Testing
Once a candidate gene is selected and primers are designed, the first experimental step is to verify the primer set's specificity.
- Protocol Objective: To confirm that primers amplify only the DNA of the target organism and not from closely related non-target strains [30].
- Methodology Details:
- DNA Extraction: Purify genomic DNA from both the target organism and a panel of non-target, closely related strains using standard kits or laboratory protocols (e.g., CTAB method for plants [30]).
- PCR Setup: Prepare PCR reactions containing the designed primers and template DNA from each strain in the panel.
- Amplification Conditions: Run PCR using optimized cycling conditions (e.g., initial denaturation at 95°C for 5 min; 35 cycles of 95°C for 30 s, specific annealing temperature for 30 s, 72°C for 1 min; final extension at 72°C for 10 min) [30].
- Analysis: Visualize PCR products on an agarose gel. A successful result shows a clear band of the expected size only for the target organism and no amplification for non-targets [3] [30].
Sensitivity and Reactivity Testing
After establishing specificity, it is critical to determine the lowest amount of target DNA that can be detected and how the primers perform with mixed samples.
- Protocol Objective: To determine the detection limit of the assay and its ability to identify the target in a background of non-target DNA [30].
- Methodology Details:
- DNA Dilution Series: Create a serial dilution of purified target DNA, typically ranging from nanograms (ng) down to picograms (pg) per PCR reaction [30].
- Mixed DNA Reactions: Prepare reactions where the amount of target DNA is very low (e.g., 0.1% or 0.01%) and the remainder is filled with non-target DNA (e.g., from a common adulterant or a related benign strain) to simulate a contaminated or mixed sample [30].
- PCR and Analysis: Amplify the dilution and mixed series. The detection limit is defined as the lowest DNA concentration that yields a visible PCR product. The reactivity threshold is the lowest proportion of target DNA in a mixture that can be consistently detected [30].
Application Testing in Complex Samples
The final validation step tests the primers against real-world samples to assess practical applicability.
- Protocol Objective: To validate the primer set's performance in authentic or artificially contaminated samples [3].
- Methodology Details:
- Sample Preparation: Artificially contaminate a relevant matrix (e.g., food samples like raw chicken meat, black pepper, or red pepper for foodborne pathogens; authentic market samples for herbal plants) with the target organism [3] [30].
- DNA Extraction and PCR: Extract DNA directly from the complex matrix and perform PCR with the designed primers.
- Comparison to Culture-Based Methods: Compare the results to traditional detection methods (e.g., growth on XLD media for Salmonella) to demonstrate superior sensitivity and selectivity [3].
Case Studies and Experimental Data
The following table summarizes quantitative results from published studies that successfully employed this workflow, demonstrating its application across different targets.
| Target Organism | Pan-Genome Tool | Key Experimental Result | Application Matrix |
|---|---|---|---|
| Salmonella Montevideo [3] | panX | Developed primer-probe sets showed higher effectiveness than conventional XLD media. | Raw chicken meat, red pepper, black pepper |
| Salmonella E serogroup (Weltevreden, London, etc.) [3] | Roary (v3.11.2) | Verified sensitivity and selectivity in artificially contaminated food via conventional PCR. | Chicken, pork, beef, eggs, fish, vegetables |
| Portulaca oleracea (Purslane) Medicinal Plant [30] | ITS2 DNA Barcode | Detection limit of 10 pg; able to detect 0.1% adulteration in mixed samples. | Commercial herbal market samples |
| Salmonella Infantis [3] | BPGA (v1.3) | Designed marker distinguished S. Infantis with 100% accuracy. | N/A (In silico and pure culture validation) |
The Scientist's Toolkit: Research Reagent Solutions
This table details essential materials and resources used throughout the workflow.
| Item / Resource | Function / Application in the Workflow |
|---|---|
| Pan-Genome Analysis Tools (e.g., Roary, BPGA, panX) | To perform large-scale genomic comparisons, identify core and accessory genomes, and pinpoint unique gene targets for primer design [3]. |
| PrimerBank | A public database of over 306,800 pre-designed PCR primers for gene expression detection and quantification in human and mouse genes, useful for control experiments or non-microbial targets [13]. |
| Diagnostic PCR Reagents | Standard laboratory reagents including Taq DNA polymerase, dNTPs, buffer, and MgCl₂ for amplifying and testing the designed primers [30]. |
| bacLIFE Workflow | An integrated computational framework for genome annotation, comparative genomics, and prediction of lifestyle-associated genes (LAGs) in bacteria, helping to generate hypotheses about gene function [31]. |
| CLUSTERED GENOMES | Input data of 16,846 bacterial genomes from Burkholderia and Pseudomonas analyzed with bacLIFE, identifying hundreds of candidate genes for experimental validation [31]. |
In the field of molecular diagnostics and pathogen genotyping, the accuracy of polymerase chain reaction (PCR) assays is fundamentally dependent on the precise selection of target genes and the strategic design of primers. Comparative genomics has emerged as a powerful approach for identifying genetic regions that exhibit sufficient sequence divergence to distinguish between closely related species and even subspecies. This methodology leverages the vast amount of genomic data now available to pinpoint unique sequences that serve as reliable markers for detection and identification. The application of this approach is particularly critical in diagnostic microbiology, where distinguishing between pathogenic and non-pathogenic strains, or tracking specific subtypes during disease outbreaks, has direct implications for public health interventions and treatment strategies.
The development of specific PCR assays requires a methodical process that begins with the selection of appropriate target sequences based on comprehensive genomic comparisons. This involves analyzing whole-genome sequences of target and non-target organisms to identify genes or genomic regions that are universally present in the target group but absent from or highly divergent in non-target groups. For subspecies-level discrimination, this process demands even greater resolution, often targeting single nucleotide polymorphisms (SNPs) or short indels that define specific lineages. The integration of bioinformatics tools into this process has dramatically enhanced our ability to identify these subtle genetic differences and design robust assays that can be deployed in both research and clinical settings.
Core Principles of Target Selection
Genetic Resolution Requirements
The strategy for selecting target genes varies significantly depending on the taxonomic level of discrimination required. For species-level identification, target genes typically need to exhibit 95-98% sequence conservation within the target species while showing <85% similarity to non-target species. At the subspecies level, the requirements become more stringent, often focusing on single nucleotide polymorphisms (SNPs) or short insertions/deletions (indels) in otherwise highly conserved genes. These subtle differences can be sufficient for discrimination when properly targeted.
Table: Target Selection Criteria by Taxonomic Level
| Taxonomic Level | Genetic Targets | Sequence Conservation Requirements | Common Analysis Methods |
|---|---|---|---|
| Species | Housekeeping genes, core genome | High within species (>95%), low between species (<85%) | Whole-genome comparison, PAN-genome analysis |
| Subspecies | Non-core genome, variable regions | Moderate within subspecies, key discriminatory SNPs | SNP analysis, comparative genomics |
| Strain | Accessory genome, mobile genetic elements | Variable, unique genetic signatures | Virulence factor analysis, plasmid profiling |
Comparative genomics approaches systematically identify these targets by analyzing the pan-genome of bacterial groups, which comprises the core genome (genes shared by all strains) and the accessory genome (genes present in some strains but not others). For subspecies discrimination, genes in the accessory genome often provide the most specific targets, as they may be associated with adaptations to specific niches or environments. For instance, a study on Lactobacillus delbrueckii demonstrated that the six subspecies could be distinguished by specific gene contents that explain their differences in habitat and nutritional requirements, with subspecies such as bulgaricus and lactis adapted to dairy environments while other subspecies were isolated from non-dairy sources [32].
Bioinformatic Workflows for Target Identification
The process of identifying species- and subspecies-specific genes follows a structured bioinformatic workflow that integrates multiple computational tools and analysis steps. This systematic approach ensures that candidate targets are thoroughly evaluated before proceeding to primer design.
Diagram: Bioinformatic Workflow for Target Gene Identification
This workflow begins with the collection of high-quality genome sequences for both target and closely related non-target organisms. The quality control step is critical, as assembly errors or incomplete sequences can lead to false conclusions about gene presence or absence. Following quality assessment, genomes are annotated to identify all coding sequences and other genomic features. Pan-genome analysis then categorizes genes into core (shared by all isolates) and accessory (variable presence) components. For subspecies-level discrimination, the accessory genome often provides the most promising targets, as these regions may reflect recent adaptations that distinguish subgroups.
The identification of unique regions relies on multiple alignment tools and similarity assessment algorithms. For example, in a study distinguishing Lactobacillus plantarum group subspecies, researchers analyzed 70 genome sequences using Anvi'o software with microbial pan-genomics workflow to identify specific genes present in all strains of target species but absent from non-target species [33]. These specific marker genes—which included genes encoding a transporter, major facilitator family protein, and hypothetical proteins—were then validated as robust targets for subspecies discrimination.
Primer Design and Specificity Validation
Computational Tools for Primer Design
Once candidate target regions have been identified, the next critical step is designing primers that will specifically amplify these regions while avoiding cross-reactivity with non-target sequences. Several bioinformatics tools are available for this purpose, each with distinct strengths and applications.
Table: Bioinformatics Tools for Primer Design and Validation
| Tool Name | Primary Function | Specificity Checking Method | Key Features | Best Use Cases |
|---|---|---|---|---|
| Primer-BLAST | Integrated primer design and specificity checking | BLAST + Global alignment (Needleman-Wunsch) | Combines Primer3 with BLAST search, considers exon/intron boundaries | General purpose specific primer design |
| Primer3 | Primer design | None (requires external validation) | Highly configurable parameters, widely used | Initial primer generation before specificity check |
| AutoPrime | Primer design for mRNA targets | Limited specificity checking | Focus on primers spanning exon junctions | RT-PCR assays targeting mRNA |
| QuantPrime | Specialized primer design | Local alignment (BLAST) | Optimized for real-time PCR primer design | Quantitative PCR assays |
Primer-BLAST represents a particularly powerful tool as it combines the primer design capabilities of Primer3 with a sophisticated specificity-checking algorithm that uses BLAST followed by a global alignment step to ensure complete primer-target alignment [34]. This tool allows researchers to design target-specific primers in a single step, significantly streamlining the assay development process. Unlike tools that rely solely on local alignment algorithms, Primer-BLAST is sensitive enough to detect targets that have a significant number of mismatches to primers yet might still be amplified under permissive PCR conditions [35].
The algorithm behind Primer-BLAST addresses a critical limitation of standard BLAST search for primer validation. As a local alignment algorithm, BLAST does not necessarily return complete match information over the entire primer range, potentially missing partial matches that could lead to non-specific amplification [34]. Primer-BLAST incorporates a global alignment step that ensures a full primer-target alignment, providing more accurate assessment of potential cross-reactivity.
Advanced Primer Design Considerations
Effective primer design must balance multiple competing parameters to ensure both specificity and efficiency of amplification. Key considerations include:
- Melting temperature (Tm): Primers in a pair should have similar Tm values (typically within 1-2°C) to ensure balanced amplification efficiency for both primers [36].
- GC content: Ideally between 40-60% to provide sufficient stability without promoting non-specific binding [36].
- Secondary structures: Primers should be checked for self-complementarity, hairpin formation, and dimerization potential that can interfere with amplification [36].
- 3'-end stability: The last 5 bases at the 3' end, particularly the final base, are critical for specificity and should perfectly match the target sequence [34].
For multiplex PCR assays, where multiple targets are amplified simultaneously, additional challenges must be addressed. Primers must be designed to have similar Tm values across all pairs to work under uniform thermal cycling conditions, and must not interact with each other to form primer dimers [36]. The development of such assays requires careful optimization of primer concentrations and cycling conditions to ensure balanced amplification of all targets.
Experimental Validation Protocols
Specificity Testing Methodology
Following computational design, experimental validation is essential to confirm primer specificity under actual assay conditions. The protocol below outlines a comprehensive approach for validating species- and subspecies-specific primers:
Protocol: Primer Specificity Validation
DNA Panel Preparation: Assemble a collection of DNA samples representing the target species/subspecies and closely related non-target organisms. Include at least 3-5 representative strains of the target taxon and 10-15 non-target species that are phylogenetically proximal or likely to be present in the same sample matrix [33].
PCR Amplification: Perform PCR reactions using standardized conditions:
- Reaction volume: 25 μL
- Template DNA: 10-50 ng
- Primer concentration: 0.2-0.5 μM each
- Thermal cycling: Initial denaturation at 95°C for 2-5 minutes; 35 cycles of 95°C for 30 seconds, appropriate annealing temperature (typically 55-65°C) for 30 seconds, and 72°C for 1 minute/kb; final extension at 72°C for 5-10 minutes [33].
Specificity Assessment: Analyze PCR products by agarose gel electrophoresis. Specific primers should produce a single band of expected size only with target DNA, with no amplification from non-target species. For real-time PCR assays, specific amplification should show early amplification curves (low Cq values) only for target templates [33].
Sensitivity Determination: Perform limit of detection (LOD) testing using serial dilutions of target DNA to establish the minimum template quantity that can be reliably detected [36].
Cross-reactivity Testing: Test primers against an extended panel of non-target organisms, particularly those with high genomic similarity to the target, to confirm absence of cross-reactivity.
In the Lactobacillus plantarum group study, this approach demonstrated 100% specificity when validated against 55 lactic acid bacterial strains, with no cross-reactivity observed between closely related subspecies [33]. The successful application of this protocol resulted in specific detection of L. plantarum subspecies in probiotic products and fermented foods, even identifying mislabeled products where L. pentosus was present instead of the declared L. plantarum.
Quantitative PCR Validation
For quantitative applications, additional validation steps are required:
Protocol: Real-time PCR Assay Validation
Standard Curve Generation: Prepare a dilution series of target DNA with known concentrations (typically spanning 6-8 orders of magnitude) to create a standard curve for quantifying amplification efficiency [33].
Efficiency Calculation: Plot Cq values against log DNA concentration. The slope of the standard curve should be between -3.1 and -3.6, corresponding to PCR efficiencies of 90-110% [33].
Reproducibility Assessment: Perform replicate reactions (minimum of 3) across different runs to determine intra-assay and inter-assay variability.
Application to Real Samples: Test the assay on actual samples (e.g., clinical, environmental, or food samples) to validate performance in complex matrices [33].
This comprehensive validation approach ensures that primers selected through comparative genomics not function in silico but also perform reliably in practical applications where sample complexity and potential inhibitors may affect amplification.
Case Study: Lactobacillus plantarum Group Discrimination
Experimental Design and Implementation
A comprehensive study on the Lactobacillus plantarum group provides an illustrative example of successful application of comparative genomics for subspecies-specific primer design. The research aimed to distinguish four closely related species/subspecies: L. plantarum subsp. plantarum, L. plantarum subsp. argentoratensis, L. paraplantarum, and L. pentosus [33].
The experimental workflow followed these key steps:
Genome Collection and Analysis: 70 genome sequences of L. plantarum group species were obtained from NCBI and analyzed using Anvi'o software with microbial pan-genomics workflow [33].
Identification of Specific Genes: Comparative genomics revealed specific protein-coding genes present in all strains of target species/subspecies but absent from non-target strains. These included genes encoding a transporter, major facilitator family protein, and hypothetical proteins [33].
Primer Design and Specificity Testing: Primers targeting these specific genes were designed and validated against 55 lactic acid bacterial strains, demonstrating 100% specificity with no cross-reactivity [33].
Application to Real Samples: The developed real-time PCR assay was successfully applied to probiotic products and fermented food samples, correctly identifying and quantifying L. plantarum group species at the subspecies level [33].
Results and Applications
The implementation of this comparative genomics approach yielded several important findings:
- Mislabeling Identification: The assay detected L. pentosus in a product labeled as containing L. plantarum, demonstrating the practical value of precise subspecies identification in quality control [33].
- Quantitative Capability: The real-time PCR assay enabled both qualification and quantification of L. plantarum group species/subspecies in complex food matrices [33].
- Superior Resolution: The method provided discrimination capability beyond what is possible with traditional 16S rRNA sequencing, which shows >99% similarity among these closely related subspecies [33].
This case study illustrates the power of comparative genomics to enable precise microbial identification at the subspecies level, with significant implications for product quality control, regulatory compliance, and accurate attribution of functional properties to specific microbial strains.
The Scientist's Toolkit
Table: Essential Research Reagents and Resources
| Resource Category | Specific Examples | Function/Purpose | Key Considerations |
|---|---|---|---|
| Bioinformatics Tools | Primer-BLAST, Primer3, Anvi'o, OrthoMCL | Primer design, pan-genome analysis, ortholog clustering | Database coverage, algorithm specificity, update frequency |
| Genomic Databases | NCBI GenBank, RefSeq, UniProt, COG | Source of genome sequences and functional annotations | Data quality, completeness, annotation consistency |
| Laboratory Reagents | Taq DNA polymerase, dNTPs, buffer systems, DNA extraction kits | PCR amplification, nucleic acid purification | Lot-to-lot consistency, compatibility with sample type |
| Reference Strains | Type strains from culture collections (ATCC, DSMZ) | Specificity testing, assay validation | Authenticity, purity, proper storage conditions |
| Analytical Instruments | Real-time PCR systems, electrophoresis equipment, spectrophotometers | Amplification detection, product visualization, quantification | Sensitivity, precision, maintenance requirements |
This toolkit represents the essential resources required for implementing the target selection and validation strategies described in this guide. The selection of appropriate tools and reagents at each stage of the process is critical for generating reliable, reproducible results that can be confidently applied in both research and diagnostic contexts.
The integration of comparative genomics approaches with careful primer design and thorough experimental validation provides a powerful framework for developing highly specific PCR assays capable of distinguishing closely related species and subspecies. As genomic databases continue to expand and bioinformatics tools become more sophisticated, these strategies will enable even finer discrimination between microbial taxa, supporting advances in diagnostic microbiology, epidemiology, and microbial ecology. The systematic approach outlined in this guide—from target selection through experimental validation—provides a roadmap for researchers seeking to develop robust molecular assays with the specificity required for their particular application needs.
In the context of comparative genomics for PCR primer development, the transition from sequence-based to thermodynamics-driven primer design represents a fundamental paradigm shift. Traditional approaches that rely on counting nucleotide mismatches or prioritizing 3' end conservation are increasingly revealing their limitations, as they fail to accurately predict hybridization behavior under actual reaction conditions. Contemporary research demonstrates that oligonucleotides with fewer mismatches can paradoxically exhibit lower binding affinity than those with more mismatches, with temperature differences exceeding 15°C in documented cases [37]. This discrepancy highlights the critical need for design principles that incorporate the actual physicochemical forces governing molecular interactions.
The integration of thermodynamic principles is particularly valuable for applications within comparative genomics, where researchers must develop primers capable of detecting target organisms across diverse genetic backgrounds. This approach enables the creation of assays with enhanced specificity and sensitivity, especially for challenging targets such as highly divergent viral genomes and genetically diverse bacterial populations. By leveraging thermodynamic calculations to assess binding interactions, researchers can overcome the limitations of traditional methods and develop robust detection assays that perform reliably across various laboratory conditions and sample types [3] [37].
Core Thermodynamic Principles in Primer Design
Fundamental Parameters and Their Interactions
Successful primer design requires careful balancing of multiple interdependent thermodynamic parameters. While basic guidelines provide a starting point, optimal performance requires understanding how these factors interact under specific experimental conditions:
Melting Temperature (Tm): The optimal Tm for PCR primers typically falls between 60-75°C, with forward and reverse primers ideally within 2°C of each other to ensure synchronized annealing [38] [39]. For qPCR probes, the Tm should be 5-10°C higher than the corresponding primers to ensure probe binding precedes amplification [39]. Tm calculations must account for specific reaction conditions, particularly cation concentrations (50 mM K+, 3 mM Mg2+ are common), as these significantly impact actual melting temperatures [39].
GC Content and Distribution: Aim for GC content of 35-65% (ideal: 50%), which provides sufficient sequence complexity while minimizing secondary structure formation [39]. Implement a GC clamp by ending the 3' terminus with G or C bases to strengthen binding through enhanced hydrogen bonding [38]. Avoid stretches of 4 or more consecutive G residues, which can promote non-specific interactions [39].
Secondary Structure Potential: Analyze potential hairpins and self-dimers using tools like OligoAnalyzer, with ΔG values weaker than -9.0 kcal/mol indicating acceptable structures [39]. Primer-dimer formations consume reagents and compete with target amplification, significantly reducing assay efficiency [40].
Table 1: Optimal Thermodynamic Parameters for Primer Design
| Parameter | Ideal Range | Impact on Assay Performance |
|---|---|---|
| Primer Length | 18-30 bases | Shorter primers anneal more efficiently; longer primers may reduce annealing efficiency [38] [40] |
| Melting Temperature (Tm) | 60-75°C (primers); 5-10°C higher for probes | Ensures specific binding; mismatched Tm causes asynchronous primer binding [38] [39] |
| GC Content | 35-65% (ideal: 50%) | Balanced distribution prevents extreme melting temperatures [39] |
| 3' End Stability | G or C bases in last 5 positions | Enhances initiation of polymerase extension [40] |
| ΔG of Secondary Structures | > -9.0 kcal/mol | Preforms stable dimers/hairpins that reduce primer availability [39] |
Thermodynamic Limitations of Traditional Approaches
Traditional primer design methods often rely on simplified heuristics that fail to accurately predict molecular behavior. Research demonstrates that evaluating hybridization efficiency based solely on mismatch counting can be profoundly misleading. One study documented that a 25bp oligonucleotide with three mismatches had a 20.3% probability of exhibiting higher Tm than one with five mismatches when considering a 5°C temperature window [37]. Similarly, the common practice of emphasizing 3' end conservation based on polymerase extension requirements does not always correlate with optimal binding affinity, as mutations in the 3' end sometimes result in more favorable thermodynamics than internal mutations [37].
These findings underscore why thermodynamics must serve as the primary design driver rather than relying on sequence similarity alone. Binding affinity between two DNA strands depends on the cumulative energy contributions of all nucleotide interactions, local sequence context, and environmental conditions—complex relationships that cannot be accurately captured through simple mismatch counting or positional rules [37].
Comparative Genomics Approaches for Primer Development
Pan-Genome Analysis for Target Selection
Comparative genomics provides powerful methodologies for identifying optimal target sequences across diverse organisms. Pan-genome analysis categorizes genomic content into core genomes (shared by all strains) and accessory genomes (unique to specific strains), enabling strategic primer targeting depending on application requirements [3]. This approach is particularly valuable for detecting pathogens like Salmonella, Cronobacter, Staphylococcus, and Listeria, where assay specificity across strains is critical [3].
Multiple bioinformatics tools support this comparative approach, each with distinct advantages:
- Roary: Enables rapid pan-genome visualization specifically for prokaryotes, though sensitivity decreases with highly divergent genomes [3].
- BPGA (Bacterial Pan Genome Analysis pipeline): Incorporates functional annotation and orthologous group clustering, providing valuable functional insights [3].
- panX: Integrates phylogenetic and genomic analyses with interactive visualization, offering intuitive exploration of pan-genomic data [3].
- EDGAR: Web-based tool focusing on comparative genomics visualization with limited computational requirements [3].
Table 2: Bioinformatics Tools for Comparative Genomics in Primer Design
| Tool | Primary Function | Advantages | Limitations |
|---|---|---|---|
| Roary | Core genome analysis with pre-clustering | Fast and efficient; visualization of output data | Limited to bacterial genome; low sensitivity in highly divergent genome [3] |
| BPGA | Functional annotation and orthologous group clustering | Identification of functional insight; ease to use | Limited scalability; demand of high-quality genome assemblies [3] |
| panX | Integration of phylogenetic and genomic visualization | Interactive visualization; combination of evolutionary context with genomic insight | Limited scalability [3] |
| EDGAR | Web-based comparative genomics | Intuitive interface; comprehensive visualization | Limited scalability; dependency on web interface [3] |
| PGAP-X | Scalable and modular pan-genome analysis | High scalability; suitable for large dataset and customization | High computational demand; advanced bioinformatics skills required [3] |
Practical Implementation Workflows
Implementing a comparative genomics workflow for primer design involves multiple stages. The following diagram illustrates a generalized approach applicable to various organisms:
Comparative Genomics Primer Design Workflow
This workflow successfully applies to both closely and distantly related species. Research demonstrates that primers designed through comparative genomics enable amplification of polymorphic genomic fragments across diverse taxa, including montane brown frogs, anole lizards, guppies, and fruit flies [41]. The success rate correlates with sequence identity between primer sites in reference genomes, with exonic primers generally exhibiting higher amplification success than intronic primers [41].
Experimental Validation and Case Studies
Bacterial Detection Assays
Comparative genomics combined with thermodynamic optimization has yielded significant improvements in detecting challenging bacterial pathogens. A notable example comes from Neisseria meningitidis detection, where traditional ctrA gene-based PCR missed approximately 16% of carriage isolates due to sequence variations [42]. Researchers developed an alternative assay targeting the sodC gene, which demonstrated superior detection capabilities by correctly identifying all 49 culture-positive isolates, while the ctrA-based method detected only 33 [42]. This highlights how target selection based on genomic stability rather than traditional markers enhances assay reliability.
In Salmonella detection, pan-genome analysis using the panX tool facilitated the development of primer-probe sets specifically for Salmonella enterica serovar Montevideo [3]. When validated in challenging food matrices like raw chicken meat, red pepper, and black pepper, these primers demonstrated enhanced detection capability compared to conventional culture methods [3]. Similarly, BPGA-based analysis enabled the identification of serovar-specific markers for Salmonella Infantis (SIN_02055) that distinguished target strains with 100% accuracy across 60 profiled Salmonella serovars [3].
Viral Detection in Divergent Genomes
Highly mutable viruses represent perhaps the most challenging targets for PCR assay development. A novel thermodynamic method addressing this challenge processes thousands of whole genomes to identify optimal primer sequences for detecting highly divergent viruses including Hepatitis C (HCV), Human Immunodeficiency Virus (HIV), and Dengue virus [37]. This approach uses local alignment followed by thermodynamic interaction assessment rather than traditional multiple sequence alignment, which often fails with highly variable sequences [37].
The methodology achieved remarkable in silico detection rates: 99.9% of 1,657 HCV genomes, 99.7% of 11,838 HIV genomes, and 95.4% of 4,016 Dengue genomes [37]. For subspecies identification, the method maintained more than 99.5% true positive rates with less than 0.05% false positive rates across HCV genotypes 1-6 and Dengue virus genotypes 1-4 [37]. These results demonstrate the power of thermodynamics-based approaches for targets where conventional methods fail due to excessive genetic diversity.
Implementation Protocols and Reagent Solutions
Thermodynamic Analysis Workflow
The transition from sequence-based to thermodynamics-based primer design follows a structured protocol:
Thermodynamic Primer Selection Process
This protocol emphasizes that sequence similarity serves only as an intermediate step to reduce computational load, with final selection based primarily on thermodynamic parameters [37]. The critical innovation involves using lenient similarity thresholds initially, then applying rigorous thermodynamic analysis to candidate sequences identified through local alignment against comprehensive genome databases.
Essential Research Reagents and Tools
Successful implementation of thermodynamics-based primer design requires specific reagents and computational tools:
Table 3: Essential Research Reagent Solutions for Thermodynamic Primer Design
| Reagent/Tool | Function | Application Note |
|---|---|---|
| High-Fidelity DNA Polymerase (e.g., Pfu, KOD) | PCR amplification with 3'→5' proofreading | Reduces error rate to 1×10⁻⁶ to 1×10⁻⁷ for accurate amplification [40] |
| Buffer Additives (DMSO, Betaine) | Modify template secondary structure | DMSO (2-10%) resolves strong secondary structures; Betaine (1-2 M) homogenizes GC/AT stability [40] |
| Mg²⁺ Solution | Essential polymerase cofactor | Concentration typically 1.5-2.5 mM; requires optimization as it affects enzyme activity and fidelity [40] |
| OligoAnalyzer Tool | Analyze Tm, hairpins, dimers, and mismatches | Incorporates nearest neighbor calculations; includes BLAST analysis for specificity checking [39] |
| PrimerQuest Tool | Generate customized designs for qPCR assays | Uses sophisticated algorithms considering multiple thermodynamic parameters [39] |
| UNAFold Tool | Analyze oligonucleotide secondary structure | Predicts stable secondary structures that might interfere with primer binding [39] |
The integration of thermodynamic principles with comparative genomics represents the current state-of-the-art in PCR primer design. This approach moves beyond simplistic sequence matching to address the actual physicochemical forces governing molecular interactions, resulting in substantially improved assay robustness, particularly for challenging targets like highly divergent viruses or genetically diverse bacterial populations. The demonstrated success of these methods across various applications—from food safety testing to clinical diagnostics—highlights their transformative potential in molecular assay development.
As genomic databases continue to expand and computational power increases, thermodynamics-based primer design will likely become the standard methodology for researchers developing detection assays. The protocols and case studies presented here provide a framework for implementing these advanced design principles, enabling the creation of highly specific and sensitive PCR assays that perform reliably across diverse laboratory applications. By adopting these sophisticated design strategies, researchers can overcome traditional limitations and achieve new levels of precision in molecular detection.
The accurate detection of specific microbial species, whether for identifying pathogens or quantifying beneficial probiotics, is a cornerstone of public health, food safety, and pharmaceutical development. For years, detection methods relied on conserved genetic regions, such as the 16S rRNA gene, which often lack the resolution to distinguish between closely related species or strains, leading to false-positive and false-negative results [3]. The emergence of comparative genomics has fundamentally transformed this landscape. This approach involves the comprehensive analysis of multiple whole genomes to identify the core genome, shared by all strains of a species, and the accessory genome, which contains unique sequences [3]. By leveraging pan-genome analysis, researchers can now design PCR primers with unparalleled specificity, targeting genetic regions that are unique to a single serovar, species, or even strain. This guide objectively compares the performance of various detection platforms and primer design strategies, highlighting how comparative genomics enhances accuracy in the detection of Salmonella, the analysis of probiotics like Bifidobacterium, and by extension, pathogens like Xanthomonas.
Pan-Genome Analysis Tools for Targeted Primer Design
The first step in modern primer development is the selection of a unique genetic target using comparative genomic tools. Various bioinformatics pipelines are available, each with distinct advantages and limitations suited for different research scenarios [3].
Table 1: Comparison of Pan-Genome Analysis Tools for Primer Development
| Tool | Primary Property | Advantage for Primer Design | Key Limitation |
|---|---|---|---|
| Roary | High-speed pan-genome analysis | Fast and efficient for prokaryotic genomes; enables visualization of core and accessory genomes [3]. | Lower sensitivity when analyzing highly divergent genomes [3]. |
| BPGA (Bacterial Pan Genome Analysis pipeline) | Functional annotation and orthologous group clustering | User-friendly; provides functional insights which can aid in target gene selection [3]. | Limited scalability for very large datasets [3]. |
| PGAP-X | Scalable, modular architecture | Highly customizable and suitable for analyzing large genomic datasets [3]. | High computational demand and requires advanced bioinformatics expertise [3]. |
| panX | Integration of phylogenetic and genomic visualization | Interactive interface that combines evolutionary relationships with genomic data for informed target selection [3]. | Limited scalability for extremely large numbers of genomes [3]. |
These tools facilitate the identification of species-specific genes. For instance, a study aiming to detect Bifidobacterium animalis used comparative genomic analysis against other Bifidobacterium type strains to reveal significant collinearity differences. This process identified several genomic regions with low collinearity, which are potential candidates for specific detection, leading to the discovery of a unique cell surface protein (csp) gene [43]. Similarly, a specific gene region encoding a hypothetical protein with an LPXTG cell wall anchor domain was identified for Listeria monocytogenes through a comparative analysis of its genome with that of L. innocua [44].
The following diagram illustrates the standard workflow for developing specific detection methods using comparative genomics.
Pathogen Detection: The Case of Salmonella
Salmonella is a formidable foodborne pathogen with numerous serovars, necessitating detection methods with varying levels of specificity, from genus-level to serovar-level identification. Comparative genomics has been widely applied to meet this need.
Experimental Data and Performance Comparison
Research has demonstrated the development and validation of primers targeting different levels of Salmonella classification.
Table 2: Performance of Genomics-Based Detection Methods for Salmonella
| Target | Pan-Genome Tool | Detection Method | Key Experimental Findings | Limit of Detection (LOD) | Year/Ref. |
|---|---|---|---|---|---|
| S. Montevideo (Serovar) | panX | Real-time qPCR | Primer-probe sets showed high sensitivity/selectivity in food samples (raw chicken, peppers) [3]. | Not Specified | 2022 [3] |
| S. Infantis (Serovar) | BPGA | Real-time qPCR | Marker (SIN_02055) distinguished S. Infantis with 100% accuracy from 60 other serovars [3]. | Not Specified | 2020 [3] |
| Viable Salmonella (Species) | N/A | PMA-RPA-CRISPR/Cas12a | Combined propidium monoazide (PMA) with isothermal amplification to distinguish viable cells; detected in wastewater [45]. | 10¹ CFU/mL [45] | 2025 [45] |
| Salmonella Genus | Roary | LAMP & PCR | Identified ssaQ gene as a target; LAMP showed higher sensitivity than conventional PCR [3]. | Higher than conventional PCR [3] | 2021 [3] |
Detailed Experimental Protocol: PMA-RPA-CRISPR/Cas12a for Viable Salmonella
A 2025 study developed a rapid, visual method to detect specifically viable Salmonella in wastewater, addressing a critical limitation of DNA-based tests that cannot distinguish live from dead cells [45].
Methodology:
- Sample Pre-treatment: Propidium monoazide (PMA) was added to samples at an optimized concentration (e.g., 20 µM) and incubated in the dark. PMA selectively penetrates the membranes of dead cells and cross-links their DNA upon photoactivation, preventing its amplification.
- Photoactivation: Samples were exposed to LED light (465-475 nm) for 15 minutes to activate PMA.
- DNA Extraction: Genomic DNA was extracted from the PMA-treated samples using a commercial bacterial genomic DNA kit.
- Isothermal Amplification: The DNA was amplified using Recombinase Polymerase Amplification (RPA), an isothermal method that operates at 37-42°C for 15-20 minutes, targeting the fimY gene.
- CRISPR/Cas12a Detection: The RPA product was added to a reaction containing the Cas12a enzyme and a specific crRNA. If the target DNA was present, Cas12a was activated and cleaved a fluorescent single-stranded DNA reporter, generating a signal.
- Result Visualization: Fluorescence was measured with a plate reader or visualized by naked eye under a blue light transilluminator.
Key Reagents:
- Propidium Monoazide (PMA): Viability dye to suppress DNA amplification from dead cells.
- RPA Kit (TwistAmp): Contains enzymes and reagents for isothermal amplification.
- CRISPR/Cas12a Enzyme: Provides the sequence-specific cleavage activity.
- Target-specific crRNA: Guides Cas12a to the fimY amplicon.
- Fluorescent ssDNA Reporter (e.g., FAM-TTATT-BHQ1): Substrate for trans-cleavage, producing the detectable signal.
Probiotic Analysis: Quantifying Bifidobacterium animalis
In probiotic research, accurately quantifying specific strains within multi-strain products or complex matrices like feces is essential for quality control and clinical trial verification.
Comparative Genomics in Probiotic Detection
A prime example is the development of a novel RT-qPCR assay for Bifidobacterium animalis [43]. Researchers performed a comparative genomic analysis of B. animalis AR668-R1 against four other Bifidobacterium type strains (B. bifidum, B. breve, B. longum, B. pseudocatenulatum). The analysis revealed significant collinearity differences and identified five genomic regions with low collinearity. Primers were designed for these regions, and only the primer targeting the cell surface protein (csp) gene showed absolute specificity for B. animalis, with no amplification in other closely related species [43].
Performance Comparison: qRT-PCR vs. ddPCR
While qRT-PCR is a well-established standard, newer digital PCR (dPCR) technologies offer potential advantages. A 2025 clinical trial study directly compared quantitative real-time PCR (qRT-PCR) and droplet digital PCR (ddPCR) for detecting a multi-strain probiotic in human fecal samples [46] [47].
Table 3: Comparison of qRT-PCR and ddPCR for Probiotic Detection in Clinical Samples
| Parameter | qRT-PCR | Droplet Digital PCR (ddPCR) |
|---|---|---|
| Principle | Quantification based on cycle threshold (Ct) relative to a standard curve [46]. | Absolute quantification by counting positive/negative partitions (Poisson correction) [46] [47]. |
| Reported LOD | Varies with assay optimization | 10–100 fold lower than qRT-PCR [46] [47]. |
| Precision & Dynamic Range | High | Higher precision and wider dynamic range [46]. |
| Susceptibility to PCR Inhibitors | Can be affected by inhibitors in complex samples (e.g., feces) [46]. | Reduced susceptibility to PCR inhibitors [46]. |
| Throughput & Cost | Established, high-throughput; lower reagent cost. | Higher reagent cost per sample; requires specialized equipment [46]. |
| Key Finding in Clinical Trial | Performed well and comparably to ddPCR when properly optimized and validated [46] [47]. | Demonstrated superior LOD; both methods were largely congruent in classifying samples from verum and placebo groups [46] [47]. |
Experimental Protocol for Probiotic Detection in Feces [46] [47]:
- DNA Extraction: 200 mg of fecal sample was lysed using lysis buffer and bead beating. DNA was purified using a magnetic particle processor and quantified with a fluorimeter.
- PCR Amplification:
- qRT-PCR: Reactions were run using Taqman Fast Advanced mastermix on a 7500FAST Real-Time PCR System with 10 ng of fecal DNA.
- ddPCR: Reactions were run using ddPCR supermixes on a QX200 system (Automated Droplet Generator and Droplet Reader) with 10 ng of fecal DNA.
- Data Analysis:
- For qRT-PCR, quantification was based on a standard curve from pure culture bacterial DNA.
- For ddPCR, absolute copy numbers were calculated based on the fraction of positive droplets, without the need for a standard curve.
The Scientist's Toolkit: Essential Research Reagents
This table lists key reagents and their functions in developing and applying genomics-based detection methods, as cited in the research.
Table 4: Key Research Reagent Solutions for Detection Assays
| Reagent / Kit | Function / Application | Example Use Case |
|---|---|---|
| Propidium Monoazide (PMA) | Viability dye; selectively inhibits DNA amplification from dead cells with compromised membranes [45]. | Distinguishing viable from inactivated Salmonella in wastewater samples [45]. |
| RPA Kit (e.g., TwistAmp) | Isothermal nucleic acid amplification; enables rapid target amplification at constant temperature [45]. | Rapid field-deployable detection of Salmonella without a thermal cycler [45]. |
| CRISPR/Cas12a System | Sequence-specific detection and signal amplification; provides high specificity and enables visual readout [45]. | Fluorescent detection of Salmonella fimY gene post-RPA amplification [45]. |
| MagMax Nucleic Acid Isolation Kit | Automated magnetic bead-based purification of DNA/RNA from complex samples. | DNA extraction from inhibitory fecal samples for probiotic qRT-PCR/ddPCR [46] [47]. |
| Taqman Fast Advanced Mastermix | Optimized reagent mix for probe-based qRT-PCR; reduces run times and improves performance. | Quantification of Lactobacillus and Bifidobacterium strains in clinical trials [46] [47]. |
| ddPCR Supermix (for Probes/EvaGreen) | Reagent formulation for droplet generation and robust PCR amplification in oil-emulsion partitions. | Absolute quantification of Bifidobacterium animalis subsp. lactis Bl-04 without a standard curve [46] [47]. |
The integration of comparative genomics into PCR primer design represents a significant leap forward in molecular detection. As the data demonstrates, this approach enables the development of assays with exceptional specificity, from the serovar level in Salmonella to the species level in Bifidobacterium. The choice of detection platform—be it conventional PCR, qPCR, or the more sensitive and inhibitor-resistant ddPCR—depends on the specific application requirements for sensitivity, throughput, and cost. Furthermore, innovations like PMA-treatment coupled with isothermal amplification and CRISPR-based detection are pushing the boundaries towards rapid, viable-cell-specific, and field-deployable diagnostics. For researchers in drug development and public health, leveraging these genomics-guided strategies is key to achieving the accuracy and reliability required for modern microbial analysis.
Fine-Tuning Your Assay: Troubleshooting Primer Specificity and qPCR Efficiency
In the field of comparative genomics, the precision of polymerase chain reaction (PCR) is foundational, enabling everything from gene expression studies to genotyping. However, this precision is perpetually threatened by technical artifacts such as primer-dimers, secondary structures, and false-positive amplifications. These pitfalls can compromise data integrity, leading to erroneous conclusions in functional genomics studies and drug development pipelines. The increasing reliance on PCR in high-throughput and point-of-care diagnostics amplifies the consequences of these artifacts, making their mitigation a critical research area.
This guide provides a objective comparison of contemporary strategies and reagents designed to overcome these common challenges. By framing the discussion within the context of comparative genomics, we will explore how advanced polymerase technologies, sophisticated primer design algorithms, and novel biochemical approaches perform head-to-head in enhancing the specificity and reliability of PCR-based assays. The following sections will dissect the experimental data, providing a clear framework for selecting the optimal tools for robust genomic research.
Comparative Analysis of Mitigation Strategies
The table below summarizes the core problems and the primary strategies used to combat them, providing a high-level overview of the solutions compared in this guide.
Table 1: Overview of Common PCR Pitfalls and Mitigation Strategies
| Common Pitfall | Primary Mitigation Strategies | Key Comparative Metrics |
|---|---|---|
| Primer-Dimer Formation | Hot-Start Polymerases, Self-Avoiding Molecular Recognition Systems (SAMRS), Touchdown PCR, Optimized Primer Design | Specificity, Yield, Signal-to-Noise Ratio, Limit of Detection [48] [49] [50] |
| Secondary Structures | PCR Additives (DMSO, Betaine), High-Processivity Polymerases, Temperature Gradient Optimization | Amplification Efficiency, Success Rate with GC-Rich Templates, Fidelity [49] [51] |
| False Positives & Allele Dropout | High-Fidelity Proofreading Polymerases, Exon-Junction Spanning Primers, Multiplex Assay Designs with Internal Controls | Error Rate, Genotyping Accuracy, Allele Discrimination [49] [52] [12] |
Quantitative Performance Data of Selected Solutions
Experimental data from controlled studies allows for a direct comparison of the effectiveness of different solutions. The following table summarizes key performance indicators for several advanced strategies.
Table 2: Experimental Performance Data of Advanced Mitigation Technologies
| Technology / Reagent | Reported Performance Data | Impact on Specificity & Yield | Key Experimental Findings |
|---|---|---|---|
| Antibody-Based Hot-Start Taq | Near-zero polymerase activity at 50°C without heat activation; Room-temperature stability for >72 hours [49]. | Increased target yield; Elimination of nonspecific bands; Suitable for high-throughput setups [49]. | 100% specific amplification of a 2 kb fragment from human gDNA, even after 72-hour room-temperature setup [49]. |
| SAMRS-Modified Primers | Up to 5°C reduction in Tm per modified position; >50x improvement in SNP discrimination over conventional AS-PCR [50]. | Drastic reduction/elimination of primer-dimer artifacts; Enhanced sensitivity in multiplex PCR [50]. | Effective SNP discrimination with the added benefit of avoiding primer-dimer artifacts, dependent on polymerase choice [50]. |
| Engineered High-Fidelity Polymerase | Error rates as low as 1 in 1-5 million bases (50-300x greater fidelity than Taq) [49]. | High yields of accurate amplicons; Essential for cloning and sequencing applications [49]. | Successful amplification of long targets and GC-rich sequences without enhancers, and in the presence of common PCR inhibitors [49]. |
| Tailed Primer (Tagged) System | Effective suppression of primer-dimer accumulation in multiplex reactions [53]. | Enabled specific amplicon detection directly with intercalating dyes; Aided large multiplex reaction design [53]. | Formation of pan-handle structures outcompetes Tag primer annealing, preventing accumulation of non-specific products [53]. |
Experimental Protocols for Validation
To ensure the reliability of PCR results, researchers must employ rigorous experimental protocols designed to identify and prevent common artifacts. The following methodologies are critical for validating assay specificity and accuracy.
Protocol for No-Template Control (NTC) and No-RT Control
Objective: To detect contamination and primer-dimer formation independent of the target template [48]. Methodology:
- NTC Preparation: Include a control reaction where the template DNA is replaced with nuclease-free water in every PCR run.
- No-RT Control (for RT-PCR): For reverse transcription-PCR, include a control that omits the reverse transcriptase enzyme to detect contamination from genomic DNA.
- Analysis: Analyze the NTC and No-RT control on an agarose gel alongside experimental samples. The presence of amplification products (particularly low molecular weight smears around 50-100 bp) indicates primer-dimer formation or contaminating DNA [48] [54]. Interpretation: A clean NTC validates that the amplification signal in the test samples is derived from the intended template. Any amplification in the NTC necessitates re-optimization of primer design or reaction conditions.
Protocol for Melting Curve Analysis
Objective: To distinguish specific amplicons from nonspecific products like primer-dimers based on their dissociation characteristics [55]. Methodology:
- Post-Amplification Ramp: After the final PCR cycle, slowly increase the temperature from 60°C to 95°C while continuously monitoring fluorescence.
- Data Collection: Record the negative derivative of fluorescence over temperature (-dF/dT).
- Analysis: Plot -dF/dT against temperature. Specific amplicons will produce sharp, single peaks at a characteristic Tm. Primer-dimers typically manifest as broad peaks at a lower Tm [55]. Interpretation: A single, sharp peak at the expected Tm confirms specific amplification. Multiple peaks or peaks at unexpected temperatures indicate nonspecific amplification or the presence of primer-dimers.
Protocol for Allele-Specific PCR with SAMRS Primers
Objective: To achieve high-fidelity single nucleotide polymorphism (SNP) discrimination while suppressing primer-dimer formation [50]. Methodology:
- Primer Design: Incorporate SAMRS nucleotides (e.g., a, g, c, t) strategically at the 3'-end and internally in allele-specific primers. SAMRS bases pair with natural bases but not with each other.
- Thermal Cycling: Use a standard thermal cycling profile, but annealing temperature may require optimization based on the calculated Tm of the SAMRS-standard duplex.
- Detection: Analyze products by gel electrophoresis or real-time PCR. The use of SAMRS primers should yield a clear positive signal for the matched allele and no signal for the mismatched allele, with an absence of low molecular weight artifacts [50]. Interpretation: Successful SNP discrimination with minimal background signal demonstrates the efficacy of SAMRS technology in preventing mispriming and primer-dimer formation, which is superior to conventional allele-specific PCR.
Visualization of Workflows and Relationships
The following diagrams illustrate the core concepts and experimental workflows discussed in this article, providing a visual summary of the logical relationships between different strategies and artifacts.
Diagram 1: PCR Pitfalls and Solutions Map. This diagram outlines the logical relationship between common PCR pitfalls (red), their primary causes (yellow), and the effective solutions (green) that lead to successful outcomes (blue).
Diagram 2: Primer-Dimer Formation. This workflow visualizes the step-by-step process of how primer-dimers are formed during PCR and their negative consequences on the reaction.
The Scientist's Toolkit: Research Reagent Solutions
The successful implementation of the strategies described above relies on a set of key reagents and tools. The following table details this essential toolkit for developing robust PCR assays in comparative genomics.
Table 3: Essential Research Reagents and Tools for Overcoming PCR Pitfalls
| Reagent / Tool | Function & Mechanism | Key Considerations for Use |
|---|---|---|
| Hot-Start DNA Polymerase | Remains inactive at room temperature, preventing nonspecific priming and primer-dimer formation during reaction setup. Activated by high initial denaturation temperature [49]. | Choose between antibody-based, aptamer-based, or chemically modified versions. Antibody-based hot-starts offer true inhibition at room temperature [49]. |
| High-Fidelity Polymerase | Incorporates proofreading (3'→5' exonuclease) activity to correct misincorporated nucleotides, drastically reducing mutation rates and ensuring sequence accuracy in amplicons [49]. | Often slower than non-proofreading enzymes. Engineered versions now combine high fidelity with high processivity. Essential for cloning and sequencing [49]. |
| PCR Additives (DMSO, Betaine) | DMSO disrupts secondary structures in GC-rich templates. Betaine equalizes the stability of AT and GC base pairs, aiding in the amplification of difficult templates [51]. | Titrate concentration for optimal performance (e.g., DMSO 1-10%, Betaine 0.5-2.5 M). High concentrations can inhibit polymerase activity [51]. |
| SAMRS Nucleotides | Synthetic nucleotides that base-pair with natural nucleotides but not with other SAMRS nucleotides. When incorporated into primers, they prevent primer-primer interactions and dimer formation [50]. | Strategic placement within the primer is crucial. The number of modifications should be limited as they weaken overall primer binding strength [50]. |
| Primer Design Software (e.g., Primer-BLAST) | Algorithms to design primers with optimal length, Tm, and GC content, while checking for self-complementarity, cross-dimer formation, and specificity against genomic databases [12]. | Always use the "Primer must span an exon-exon junction" option when designing from mRNA to avoid genomic DNA amplification [12]. |
The journey toward flawless PCR amplification in comparative genomics is navigated by making informed choices about enzyme selection, primer design, and experimental validation. As the comparative data and protocols in this guide demonstrate, technologies like hot-start and high-fidelity polymerases provide a solid foundation for specificity and accuracy. Meanwhile, emerging approaches such as SAMRS-modified primers offer a revolutionary path to eliminating primer-dimer artifacts at their source, particularly in challenging applications like highly multiplexed PCR and SNP detection.
The choice of strategy is not one-size-fits-all but should be guided by the specific application. For routine genotyping, a robust hot-start polymerase may suffice. In contrast, for building complex multiplex assays or detecting rare alleles, the integration of advanced primer chemistries like SAMRS with high-performance enzymes becomes critical. By leveraging the experimental frameworks and reagent toolkit outlined herein, researchers and drug development professionals can significantly mitigate the most common PCR pitfalls, thereby ensuring the generation of reliable, reproducible, and meaningful genomic data.
Optimizing Primer and Probe Concentrations for Maximum Sensitivity
In the field of comparative genomics, the development of robust polymerase chain reaction (PCR) assays is fundamental for accurate genomic analysis, from gene expression studies to species identification. The exquisite specificity and sensitivity that make quantitative PCR (qPCR) a powerful tool are critically dependent on its most central components: the primers and probes. Achieving maximum sensitivity—the ability to detect low-abundance targets—is not a matter of chance but of meticulous optimization, particularly of primer and probe concentrations. Failure to optimize these parameters can lead to reduced technical precision, false positives, or false negatives, ultimately compromising genomic comparisons [56]. This guide objectively compares the performance of different optimization strategies and reagent solutions, providing researchers with the experimental protocols and data necessary to achieve superior assay sensitivity.
The Critical Role of Concentration in Assay Performance
Primers and probes are the linchpins of any PCR assay. Their concentrations directly influence the kinetics, efficiency, and specificity of the reaction. Suboptimal concentrations are a primary cause of poor sensitivity and specificity [56] [57].
- High Primer Concentrations can lead to increased non-specific amplification and primer-dimer formation, which consumes reaction components and competes with the target amplicon, thereby reducing sensitivity [58].
- Low Primer Concentrations may result in insufficient hybridization to the target, leading to low yield and poor efficiency, making it difficult to detect rare targets [57].
- Probe Concentration must be balanced to ensure sufficient signal generation without inhibiting the PCR reaction through steric hindrance or excessive cost.
The goal of optimization is to find the concentration "sweet spot" that produces the earliest detection cycle (Cq), high reproducibility, and a negative no-template control (NTC), all while maintaining a reaction efficiency between 90–110% [58].
Comparative Analysis of Optimization Methodologies
We evaluated three common optimization approaches, summarizing their principles, experimental requirements, and relative performance in the table below.
Table 1: Comparison of Primer and Probe Optimization Methods
| Method | Key Principle | Experimental Workflow | Sensitivity & Specificity | Cost & Time Efficiency | Best Suited For |
|---|---|---|---|---|---|
| Primer Concentration Matrix [59] [58] | Independently varies forward and reverse primer concentrations to find the optimal balance. | Test a range of concentrations (e.g., 50-800 nM for each primer) in a checkerboard pattern. Select the combination with the lowest Cq, highest RFU, and no primer-dimer in NTC. | High sensitivity and specificity when combined with melt curve or probe validation. | Moderate cost; requires multiple reactions but uses standard reagents. | Assay development for novel targets; troubleshooting underperforming assays. |
| Annealing Temperature Gradient [58] | Identifies the optimal temperature for specific primer binding across a range (e.g., 55–65°C). | Uses a thermal cycler with a gradient function to test different annealing temperatures in a single run with a fixed primer concentration. | Can achieve high specificity by selecting a temperature that minimizes non-specific binding. | Low cost; fast, single-run optimization. | Initial assay validation; improving specificity when primer design is suboptimal. |
| Design of Experiments (DOE) [60] | A statistical approach that simultaneously tests multiple factors (e.g., primer and probe concentration, Mg2+) to find global optima. | Uses fractional factorial designs to systematically vary multiple input factors in a reduced set of experiments. | Can uncover complex interactions for maximized sensitivity and robustness. | Higher initial planning cost; ultimately reduces total experiments and time. | Multiplex assay development; fine-tuning complex assays for ultimate performance. |
Detailed Experimental Protocols for Maximum Sensitivity
Protocol 1: Primer Concentration Optimization using a Matrix Approach
This robust method is considered the gold standard for establishing optimal primer concentrations [59] [58].
Methodology:
- Preparation: Resuspend primers to a high concentration (e.g., 100 µM). Prepare a working mix of forward and reverse primers at 10 µM.
- Matrix Setup: In a 96-well plate, set up a series of reactions where the forward primer concentration varies across rows (e.g., 50, 100, 200, 400, 600 nM) and the reverse primer concentration varies down columns. A template with a known, medium copy number should be used.
- Reaction Mix: Each 20 µL reaction should contain 1X master mix, a fixed probe concentration (if used, typically 100-250 nM), and the variable primer concentrations according to the plate layout.
- qPCR Run: Use a standardized two-step or three-step cycling protocol with a fixed annealing temperature (often 60°C is a good starting point).
- Data Analysis: Analyze the amplification plots. The optimal concentration combination is identified by the lowest Cq value, highest endpoint fluorescence (RFU), and minimal Cq variation between replicates [58]. The No-Template Control (NTC) for this combination must be negative.
Protocol 2: Probe Optimization via Design of Experiments (DOE)
For hydrolysis probe assays, probe performance is critical. DOE efficiently optimizes probe concentration alongside other factors [60].
Methodology:
- Define Factors and Levels: Identify key factors to optimize (e.g., Probe Concentration: 50, 100, 200 nM; Primer Concentration: 200, 400 nM; Annealing Temperature: 58, 60, 62°C).
- Experimental Design: Use statistical software to generate an experimental design matrix (e.g., a fractional factorial design) that covers all factor combinations in a minimal number of runs.
- Run Experiments: Execute the qPCR reactions as specified by the design matrix.
- Analyze Results: Model the response (e.g., Cq value or reaction efficiency) as a function of the input factors. The model will identify the factor settings that produce the maximum efficiency and lowest Cq, indicating highest sensitivity [60].
The Scientist's Toolkit: Essential Research Reagent Solutions
The following reagents and tools are indispensable for performing the optimizations described above.
Table 2: Essential Reagents and Tools for PCR Optimization
| Tool / Reagent | Function & Role in Optimization |
|---|---|
| qPCR Master Mix | A pre-mixed solution containing DNA polymerase, dNTPs, MgCl₂, and buffer. Its composition directly impacts Tm and efficiency. Consistency is key during optimization [56]. |
| Double-Quenched Probes | Hydrolysis probes (e.g., TaqMan) with an internal quencher (ZEN/TAO) in addition to the 3' quencher. They provide lower background and higher signal-to-noise ratios, which is crucial for detecting weak signals [39]. |
| Nuclease-Free Water | The solvent for preparing primer and probe stocks. Guarantees the absence of RNases and DNases that could degrade reagents and skew results. |
| Synthetic Target DNA/RNA | A defined copy number standard used to create a standard curve for precisely calculating PCR efficiency, sensitivity, and dynamic range during optimization [61] [58]. |
| Oligo Design & Analysis Software | Tools like IDT's OligoAnalyzer or PrimerQuest are used in silico to check for dimer formation, hairpins, and Tm before synthesis, saving time and resources [39]. |
Visual Guide to the Optimization Workflow
The following diagram illustrates the logical, step-by-step workflow for a systematic approach to primer and probe optimization, integrating the methods discussed.
Achieving maximum sensitivity in PCR is a deliberate and essential process in comparative genomics research. While standardized reagent concentrations provide a starting point, they are rarely optimal for any given assay. As the comparative data shows, a systematic approach—beginning with a primer concentration matrix and potentially advancing to more sophisticated DOE for multiplex assays—is required to unlock an assay's full potential. This process ensures that the resulting data on gene expression, genetic variation, or pathogen load are accurate, reproducible, and sensitive enough to support robust genomic comparisons and confident scientific conclusions.
In the field of comparative genomics and PCR primer development, the traditional approach to ensuring specificity has heavily relied on counting nucleotide mismatches between primers and their potential off-target binding sites. This method operates on the simple premise that fewer mismatches correlate with reduced off-target binding. However, this perspective fails to capture the complex thermodynamic realities that govern nucleic acid hybridization. As research advances, it becomes increasingly clear that a paradigm shift toward energy-based modeling is necessary for accurate prediction of primer behavior. This guide examines the critical limitations of mismatch counting and demonstrates how thermodynamic approaches provide superior predictive power for PCR primer performance, leveraging experimental data from recent studies to substantiate these claims.
The Limitations of Mismatch Counting
Conceptual Shortcomings
Mismatch counting as a specificity metric suffers from fundamental oversimplifications of molecular interactions. This approach treats all nucleotide mismatches as equivalent, disregarding the significant energetic variations that depend on mismatch type, sequence context, and position within the primer-template duplex. For instance, a terminal cytosine-thymine mismatch has been shown to be far more detrimental to Recombinase Polymerase Amplification (RPA) efficiency than other mismatch types [62]. Similarly, the stability reduction caused by a mismatch depends considerably on its flanking nucleotides due to stacking interactions [63]. Mismatch counting also ignores the position-dependent effects on amplification efficiency; mismatches near the 3' terminus generally cause greater amplification failure than those at the 5' end, a critical nuance that simple counting cannot capture [62].
Practical Consequences in Genomics Research
The practical implications of relying solely on mismatch counting are particularly pronounced in complex genomic contexts. In repetitive genomes like maize (approximately 85% repetitive content), primers selected based solely on mismatch counts would be predicted to produce substantial off-target priming—from 1 to 215 potential sites per primer according to one analysis [64]. This limitation extends to diagnostic applications; during the SARS-CoV-2 pandemic, mismatch counting would have failed to predict that approximately 75% of cross-reactive primer sets also aligned to SARS-CoV-1 and non-SARS viruses when thermodynamic stability was considered [63]. Such cross-reactivity poses significant risks of false-positive results in diagnostic settings.
Thermodynamic Principles in Nucleic Acid Hybridization
Foundations of Energy-Based Modeling
Thermodynamic modeling of nucleic acid interactions operates on the principle that hybridization is an equilibrium process governed by free energy changes (ΔG). Unlike mismatch counting, these models quantitatively account for the sequence-dependent stability of DNA duplexes by considering all possible molecular configurations and their corresponding energies. The nearest-neighbor model has served as the foundational framework, where the total folding energy of DNA is calculated by summing the energies of each two neighboring base pairs [65]. This approach incorporates parameters for not only Watson-Crick pairs but also the diverse sequence dependence of secondary structural motifs including mismatches, bulges, and hairpin loops.
Advanced Modeling Techniques
Recent advances have enhanced these fundamental principles with more sophisticated computational approaches. The Pythia algorithm employs chemical reaction equilibrium analysis to integrate multiple binding energy computations into a conservative measure of PCR efficiency [66]. This method computes the free energy of all possible duplex and folded forms at a late stage in an idealized PCR, then determines equilibrium concentrations of all molecular species to predict priming efficiency [66]. More recently, graph neural network (GNN) models have demonstrated the ability to identify relevant interactions within DNA beyond nearest neighbors, showing improved accuracy in predicting DNA folding thermodynamics [65].
Comparative Experimental Data
Quantitative Impact of Mismatches on Hybridization Temperatures
The table below summarizes experimental data on how mismatches impact hybridization temperatures, demonstrating that not all mismatches have equivalent effects:
Table 1: Experimentally Observed Effects of Mismatches on DNA Hybridization
| Mismatch Configuration | Impact on Tm (°C) | Experimental Context | Reference |
|---|---|---|---|
| Single mismatches | Variable reduction (position and context-dependent) | SARS-CoV-2 primer-genome alignment | [63] |
| Double consecutive mismatches | Variable reduction (position and context-dependent) | SARS-CoV-2 primer-genome alignment | [63] |
| Triple consecutive mismatches | Variable reduction (position and context-dependent) | SARS-CoV-2 primer-genome alignment | [63] |
| Terminal cytosine-thymine | Most detrimental | RPA amplification | [62] |
| Terminal guanine-adenine | Highly detrimental | RPA amplification | [62] |
| Specific combinations (e.g., penultimate C-C + terminal C-A) | Complete reaction inhibition | RPA amplification | [62] |
| 15% of mismatch contexts | Increased stabilization (higher than AT base pair) | Systematic analysis of 4032 sequences | [63] |
Performance Comparison of Specificity Evaluation Methods
The table below compares the performance of different specificity evaluation methods as implemented in various primer design tools:
Table 2: Comparison of Specificity Evaluation Methods in Primer Design
| Method/Tool | Specificity Basis | Coverage in Repetitive Regions | Laboratory Validation | Reference |
|---|---|---|---|---|
| Mismatch counting | Number of non-complementary bases | Limited (e.g., 51% in RepeatMasked human genome) | Not specifically reported | [66] [64] |
| ThermoAlign | Thermodynamics of full-length primer-template hybridization | High (e.g., 89% in RepeatMasked human genome) | 100% specificity in maize genome | [64] |
| Pythia | DNA binding affinity computations + equilibrium analysis | High (89% in RepeatMasked sequences) | Comparable success to standard methods with higher coverage | [66] |
| Primer3 | Multiple metrics including Smith-Waterman alignment | Lower (51% in RepeatMasked sequences) | Widely used but lower recall (48%) | [66] |
| SDSS | 3'-end complementarity | Moderate | Some off-target amplification in yeast genome | [64] |
| PRIMEGENS | Not specified | Not specified | ~90% produced single amplicon | [64] |
Experimental Protocols and Methodologies
High-Throughput Thermodynamic Measurement (Array Melt)
The Array Melt technique represents a significant advancement in measuring DNA folding thermodynamics at scale [65]. This protocol involves:
- Library Design: A comprehensive library of 41,171 hairpin sequence variants is synthesized as an oligo pool, incorporating diverse structural motifs (Watson-Crick pairs, mismatches, bulges, and hairpin loops) into multiple constant hairpin scaffolds.
- Flow Cell Preparation: The library is amplified with sequencing adapter sequences and loaded onto a repurposed Illumina MiSeq flow cell, where single DNA molecules are amplified into clusters of approximately 1000 copies.
- Fluorescence Quenching Assay: A Cy3-labeled oligonucleotide is annealed to the 5'-end of each hairpin and a Black Hole Quencher (BHQ)-labeled oligonucleotide to the 3'-end.
- Thermal Melting: Temperature is increased from 20°C to 60°C while monitoring fluorescence, which increases as hairpins unfold and separate the fluorophore-quencher pair.
- Data Analysis: Melt curves are fitted to a two-state model to determine thermodynamic parameters (ΔH, Tm, ΔG37, and ΔS), with rigorous quality control excluding non-two-state variants.
This method has enabled the measurement of 27,732 sequence variants with high precision (uncertainty of ~0.1 kcal/mol for most variants), providing an extensive dataset for improving thermodynamic parameters [65].
Genome-Aware Primer Design with ThermoAlign
ThermoAlign implements a thermodynamic approach to ensure target-specific primer design through the following protocol [64]:
- Target Region Analysis: The tool identifies all possible primers in a target region and evaluates their occurrence across the genome.
- Thermoalignment Calculation: For each candidate primer, the thermodynamics of hybridization are computed for all full-length alignments across the genome, considering both perfect and imperfect matches.
- Specificity Evaluation: Primers are ranked based on the free energy difference (ΔΔG) between binding at the target site versus the most stable off-target site.
- Directed Graph Analysis: For tiling paths, a directed graph is constructed where nodes represent candidate primers and edges represent potential amplicons, with the shortest path identifying the minimum tiling set.
- Laboratory Validation: In maize genome tests, this approach achieved 100% specificity despite the genome's 85% repetitive content.
Visualization of Concepts and Workflows
Diagram 1: Conceptual comparison of mismatch counting versus thermodynamic approaches to primer design, showing the limitations of the former and advantages of the latter, culminating in experimental validation results.
Diagram 2: Array Melt experimental workflow for high-throughput thermodynamic parameter determination, showing the process from library design to model application.
The Scientist's Toolkit: Essential Research Reagents and Tools
Table 3: Key Research Reagent Solutions for Thermodynamic Primer Design
| Category | Specific Tool/Reagent | Function/Application | Reference |
|---|---|---|---|
| Bioinformatics Tools | ThermoAlign | Genome-aware primer design using thermoalignments | [64] |
| Pythia | Primer design with chemical reaction equilibrium analysis | [66] | |
| PanX (for pan-genome analysis) | Comparative genomics for target-specific marker identification | [3] | |
| BPGA (Bacterial Pan Genome Analysis) | Identification of core and accessory genomes for marker development | [3] | |
| Experimental Systems | Array Melt Platform | High-throughput measurement of DNA folding thermodynamics | [65] |
| RPA Assay Systems | Isothermal amplification for mismatch impact characterization | [62] | |
| Reference Resources | SantaLucia 2004 Parameters | Traditional nearest-neighbor parameters | [65] |
| dna24 Model | NUPACK-compatible model with improved accuracy | [65] | |
| Laboratory Reagents | Cy3-BHQ Labeled Oligos | Fluorophore-quencher pairs for melt curve measurements | [65] |
| High-Fidelity DNA Polymerases | Enzymes for PCR validation of designed primers | [67] [64] |
The evidence from comparative genomics and nucleic acid research unequivocally demonstrates that thermodynamic approaches to primer design significantly outperform traditional mismatch counting methods. By accounting for the nuanced sequence, position, and context dependencies of DNA hybridization energy, thermodynamic models can accurately predict primer behavior even in challenging genomic contexts. Tools like ThermoAlign and Pythia, supported by high-throughput experimental data from platforms like Array Melt, provide researchers with robust methods for developing highly specific PCR assays. As the field advances toward more sophisticated applications in diagnostics and genomics, embracing these energy-based modeling approaches will be essential for achieving reliable, specific, and efficient nucleic acid detection systems.
In the field of comparative genomics and PCR primer development, ensuring primer specificity stands as a fundamental prerequisite for successful experimental outcomes. Polymerase Chain Reaction (PCR) and its derivative techniques represent foundational in vitro methods in molecular biology, yet their utility remains entirely dependent on the identification and design of efficient, unique primer sequences [68]. In silico PCR has emerged as a powerful complementary strategy that addresses this challenge through computational means, enabling researchers to virtually test primers against extensive genomic databases before synthesizing oligonucleotides or conducting wet laboratory experiments [68] [69]. This computational approach allows for the identification of potential mismatches in primer binding sites due to known Single Nucleotide Polymorphisms (SNPs) and helps prevent the amplification of unwanted amplicons from pseudogenes or homologous sequences [68]. The strategic implementation of in silico validation provides researchers with a critical tool for enhancing assay reliability while conserving valuable resources.
The underlying principle of in silico PCR involves executing a virtual PCR amplification using bioinformatics tools that take primer sequences as input and search against intended genomes or sequence databases [69]. This process aims to test PCR specificity, identify the target location, and predict amplicon size within one or more target genomes [69]. As sequencing technologies have advanced and costs have decreased, the growing wealth of genomic information in public databases has made comprehensive in silico PCR analysis increasingly feasible and powerful [68]. This guide provides a systematic comparison of major in silico PCR tools, evaluates their performance across key metrics relevant to comparative genomics, and presents experimental protocols for validating computational predictions in biological contexts.
Tool Comparison: Capabilities and Applications of Major Platforms
Table 1: Feature Comparison of Major In Silico PCR Tools
| Tool | Access Method | Key Features | Specialized Applications | Limitations |
|---|---|---|---|---|
| Primer-BLAST [12] | Web-based | BLAST-based search, exon junction spanning, organism restriction | mRNA/genomic DNA discrimination, transcript-specific amplification | Web interface only, no stand-alone version |
| UCSC In-Silico PCR [68] | Web-based | Indexing strategy for speed, predefined genomes | cDNA analysis (human/mouse), large amplicon detection | Limited to predefined genomes, undocumented algorithm |
| FastPCR/Java Tool [69] [70] | Stand-alone Java & web | Multiple primer/probe searches, degenerate primer support, batch processing | DNA fingerprinting, multiplex PCR, bisulfite-treated DNA | Requires local installation for full features |
| ecoPCR [71] | Command-line | Efficient pattern matching (Agrep), taxonomic analysis | DNA barcoding evaluation, biodiversity assessment | Unix platforms only, less user-friendly |
| primerDigital Tools [72] [70] | Web-based | Linguistic complexity control, repeat masking, multiplex tiling panels | LAMP, KASP genotyping, Gibson assembly | Newer platform with less established track record |
Table 2: Performance Metrics Across Different In Silico PCR Applications
| Application Domain | Key Performance Metrics | Optimal Tool Choices | Typical Results |
|---|---|---|---|
| Gene Discovery | Taxonomic coverage, resolution capacity | ecoPCR, FastPCR | Up to 95% agreement with in vitro PCR [71] |
| Molecular Diagnostics | Specificity, mismatch tolerance | Primer-BLAST, primerDigital | Efficient detection of 3-14 target copies [60] |
| DNA Barcoding | Universality, species discrimination | ecoPCR, FastPCR | Strong variation in taxonomic coverage [71] |
| Multi-Exon Genes | Exon junction spanning, splice variant discrimination | Primer-BLAST | Striking resemblance to real experimental PCR [68] |
| Degenerate Primer | Sequence coverage, specificity balance | HYDEN (via FastPCR) | Effective amplification of target gene families [73] |
The selection of an appropriate in silico PCR tool depends heavily on the specific research context and technical requirements. For standard PCR applications focusing on well-annotated model organisms, Primer-BLAST offers a robust solution with its comprehensive specificity checking against NCBI databases and flexible parameters for experimental design [12]. When working with non-model organisms or requiring analysis against specific genome assemblies, UCSC In-Silico PCR provides targeted functionality, though its algorithm remains undocumented [68]. For advanced applications including DNA fingerprinting, bisulfite-treated DNA analysis, or multiplex PCR, FastPCR and its associated Java tools deliver extensive capabilities, including support for degenerate primers and batch processing [69] [70].
In biodiversity assessment and DNA barcoding studies, ecoPCR has demonstrated particular utility through its efficient pattern-matching algorithm and integration with taxonomic analysis pipelines [71]. The recently developed primerDigital platform offers a comprehensive web-based solution incorporating linguistic complexity analysis—a novel approach to characterizing primer uniqueness that moves beyond traditional melting temperature considerations [72]. This diversity of specialized tools enables researchers to select platforms optimized for their specific experimental needs within the broader context of comparative genomics.
Experimental Protocols: Methodologies for Validation
Protocol 1: In Silico PCR for Multi-Exon Gene Amplification
This protocol follows the approach successfully implemented for AMPK gamma subunit genes in chicken populations, demonstrating the application of in silico PCR for primer selection and validation [68].
Materials and Tools Required:
- UCSC In-Silico PCR web interface (genome.ucsc.edu/cgi-bin/hgPcr)
- Target nucleotide sequences (e.g., from GenBank)
- Primer design software (Oligo or Primer Premier)
Methodology:
- Sequence Acquisition: Retrieve multi-exon nucleotide sequences of target genes from GenBank. For the AMPK study, sequences included DQ212708.1, DQ212709.1, DQ212710.1, DQ212711.1 for PRKAG2 and DQ079814.2, DQ079815.2 for PRKAG3 [68].
- Primer Design: Design primers using specialized software, focusing on parameters including length (18-30 nucleotides), GC content, and melting temperature. Pay particular attention to the last 10-12 bases at the 3' end, as single mismatches in this region can significantly reduce PCR efficiency [68].
- In Silico PCR Execution:
- Access the UCSC In-Silico PCR tool and input forward and reverse primer sequences
- Select the appropriate target genome and assembly version from dropdown menus
- Set PCR parameters: Max Product Size (default 4000 bp), Min Perfect Match (default ≥15 bases at 3' end), Min Good Match (default two-thirds matching beyond perfect match region)
- Execute the in silico PCR and analyze results for target amplification and potential off-target products [68]
- Result Interpretation: Examine the output for expected amplicon size and location. Compare results across different primer pairs to select optimal candidates that yield the desired specific amplification.
Validation Approach: Researchers compared in silico PCR results with actual experimental PCR amplifications using chicken muscle tissue samples, finding "striking resemblance" between computational predictions and laboratory results [68].
Protocol 2: DNA Barcode Evaluation Using ecoPCR
This protocol outlines the systematic approach for evaluating potential DNA barcodes using the ecoPCR tool, as implemented for vertebrate identification [71].
Materials and Tools Required:
- ecoPCR software (Unix-based)
- Reference database of mitochondrial genomes
- OBITools package for analysis
Methodology:
- Database Construction: Create a representative reference database by retrieving all complete mitochondrial genomes for the taxon of interest from GenBank. Apply a filter to select one sequence per species to avoid overrepresentation [71].
- In Silico PCR Execution: Run ecoPCR with the following parameters:
- Maximum of 2 mismatches between each primer and template
- No mismatches tolerated on the last 3 bases of the 3' end
- Use the full IUPAC code for degenerate primers
- Taxonomic Coverage Calculation: Compute the coverage index Bc as the ratio between the number of amplified taxa and the total number of taxa in the reference database using the ecoTaxStat script [71].
- Resolution Capacity Assessment: Calculate the specificity index Bs using the ecoTaxSpecificity script to determine the proportion of unambiguously identified taxa [71].
Validation Approach: The correspondence between in silico and in vitro PCR was confirmed by designing specific primers for Felidae species and testing both computationally and experimentally [71].
Table 3: Essential Research Reagent Solutions for In Silico PCR Validation
| Reagent/Resource | Function/Purpose | Examples/Specifications |
|---|---|---|
| Genomic Databases | Template for in silico amplification | RefSeq mRNA, Representative genomes, core_nt, custom databases [12] [72] |
| Primer Design Tools | Generate candidate oligonucleotides | Oligo, Primer Premier, HYDEN for degenerate primers [68] [73] |
| In Silico PCR Platforms | Virtual amplification validation | Primer-BLAST, UCSC In-Silico PCR, FastPCR, ecoPCR [68] [12] [69] |
| Analysis Packages | Process and interpret results | OBITools (ecoTaxStat, ecoTaxSpecificity) [71] |
| Specificity Metrics | Quantify primer performance | Linguistic Complexity (LC), Bc (coverage), Bs (specificity) [71] [72] |
The effective implementation of in silico PCR validation requires access to comprehensive genomic databases that serve as templates for virtual amplification. The NCBI RefSeq collection provides curated mRNA sequences and representative genomes across broad taxonomy groups, while the core_nt database offers faster search speeds by excluding eukaryotic chromosomal sequences from genome assemblies [12]. For specialized applications, custom databases can be constructed from specific nucleotide accessions, assembly accessions, or FASTA sequences [12].
Primer design represents a critical initial step, with tools ranging from commercial solutions like Oligo and Primer Premier to specialized algorithms for degenerate primer design such as HYDEN [68] [73]. The linguistic complexity parameter, implemented in platforms like FastPCR and primerDigital Tools, provides a novel metric for characterizing primer uniqueness by measuring the diversity of nucleotide subsequences within oligonucleotides [72]. This represents an advancement beyond traditional melting temperature considerations alone.
Analysis packages such as the OBITools suite provide specialized scripts for calculating taxonomic coverage (Bc) and specificity indices (Bs), enabling quantitative comparison of different primer pairs [71]. These computational reagents form an essential toolkit for researchers pursuing robust PCR assay development in comparative genomics contexts.
Performance Analysis: Quantitative Comparison of Tool Capabilities
The evaluation of in silico PCR tools reveals significant variation in their performance characteristics across different applications. For basic PCR validation, Primer-BLAST demonstrates robust performance with its comprehensive BLAST-based search algorithm and flexible parameters for organism restriction and exon junction spanning [12]. The UCSC In-Silico PCR tool employs an indexing strategy that provides faster execution times compared to other platforms, though this comes at the cost of being limited to predefined genomes [68].
In DNA barcoding applications, ecoPCR has shown particularly strong performance through its implementation of the efficient Agrep pattern-matching algorithm. Studies evaluating vertebrate barcoding primers revealed "strong variation of taxonomic coverage," with barcodes based on highly degenerated primers and those corresponding to conserved regions of Cyt-b showing the highest coverage [71]. Longer barcodes consistently demonstrated better resolution capacity than shorter ones, though shorter barcodes remain more convenient for ecological studies analyzing environmental samples [71].
For specialized applications including bisulfite-treated DNA analysis and multiplex PCR, FastPCR and its associated Java tools provide comprehensive functionality as stand-alone software [69] [70]. These tools enable researchers to process batch files and automate analyses when working with large datasets, addressing a critical need in high-throughput genomics workflows. The recently developed primerDigital platform incorporates linguistic complexity analysis as a novel parameter for primer evaluation, moving beyond traditional melting temperature considerations to better characterize primer uniqueness [72].
Experimental validation of in silico PCR predictions consistently demonstrates strong correspondence between computational and laboratory results. In one study focused on chicken AMPK gamma subunit genes, researchers found that "results of in silico PCR analysis and the real experimental PCR amplifications were strikingly in resemblance" [68]. Similarly, validation of DNA barcoding primers for vertebrate identification confirmed the "correspondence between in silico and in vitro PCR" through experimental testing with Felidae species [71].
In silico PCR validation represents an indispensable component of modern primer development workflows in comparative genomics research. The comprehensive comparison presented herein demonstrates that current computational tools can effectively predict primer specificity and amplification efficiency across diverse applications, from basic gene amplification to sophisticated DNA barcoding systems. The strategic selection of appropriate tools based on experimental requirements—whether web-based platforms like Primer-BLAST for standard applications or specialized stand-alone software like FastPCR for complex analyses—enables researchers to optimize assay design while conserving valuable resources.
The integration of in silico validation into primer development pipelines provides a robust framework for enhancing experimental success rates. By leveraging the growing wealth of genomic information in public databases and implementing systematic validation protocols, researchers can address the fundamental challenge of ensuring primer specificity before embarking on laboratory work. As genomic databases continue to expand and computational algorithms become increasingly sophisticated, in silico PCR methodologies will undoubtedly play an ever more central role in advancing PCR-based research across biological disciplines.
Proving Performance: Validation Frameworks and Comparative Analysis of Genomic-Driven Assays
Analytical validation is a critical cornerstone in molecular diagnostics, ensuring that detection methods are reliable, accurate, and fit for their intended purpose. For researchers and drug development professionals, establishing robust validation parameters is fundamental for obtaining credible data, whether for diagnostic test development, pathogen surveillance, or basic research applications. Key performance criteria—including analytical sensitivity, often expressed as the Limit of Detection (LOD), inclusivity, and exclusivity—form the foundation of this process. The emergence of comparative genomics has further refined these parameters by enabling the design of highly specific molecular tools through in-depth genomic analysis. This guide examines the experimental approaches and performance data for establishing these vital validation parameters, providing a framework for objective comparison of molecular detection assays.
Core Parameters and Comparative Experimental Data
The table below summarizes quantitative data from various studies, illustrating the performance of different molecular assays across key validation parameters.
Table 1: Comparative Analytical Performance of Molecular Assays
| Pathogen / Assay Target | Method | LOD95% | Inclusivity | Exclusivity | Key Findings | Citation |
|---|---|---|---|---|---|---|
| Leishmania spp. (18S target) | qPCR | 0.1 parasite eq./mL | Species circulating in Colombia | High (No cross-reactivity detailed) | Recommended as the best performing marker for its balance of sensitivity and specificity. | [74] |
| Leishmania spp. (kDNA target) | PCR/qPCR | Highest Sensitivity | Not specified | Low (Criterion of exclusivity not met) | Highlights that highest sensitivity does not guarantee diagnostic utility if specificity is compromised. | [74] |
| Xanthomonas citri pv. citri (XAC1051) | qPCR | 15 cells/rxn | 100% (91/91 strains) | 97.2% | Duplex assay with an internal plant control; successfully detected pathogen in herbarium samples. | [19] |
| Xanthomonas citri pv. citri (XAC1051) | Conventional PCR | 105 cells/rxn | 100% | 100% | Demonstrated 100% exclusivity, outperforming the qPCR format for this specific parameter. | [19] |
| Respiratory Pathogens (SARS-CoV-2, Influenza, etc.) | Multiplex FMCA-PCR | 4.94-14.03 copies/µL | 47/47 reference strains | No cross-reactivity with 14 non-targets | High-throughput, cost-effective platform with 98.81% clinical agreement. | [75] |
| Human Cytomegalovirus (hCMV) | LAMP | 39.09 copies/rxn | Not specified | Not specified | LOD determined via probit analysis of 24 replicates at 8 concentrations, suitable for qualitative detection. | [76] |
| Spirometra mansoni (cytb target) | qPCR | 100 copies/µL | High (All positive samples) | 100% (No cross-reactivity) | Excellent repeatability (CV < 5%), suitable for quantitative detection. | [77] |
Experimental Protocols for Key Validation Parameters
The following section details the standard methodologies used to generate the performance data cited in comparative studies.
Determining the Limit of Detection (LOD)
The LOD is the lowest concentration of an analyte that can be reliably detected by an assay. The most rigorous method for its determination is probit analysis.
- Procedure:
- Preparation of Dilution Series: A stock solution of the target nucleic acid (from a reference strain or synthetic material) is serially diluted to create a panel of concentrations, typically spanning the expected detection limit [74] [75].
- Replicate Testing: Each dilution is tested across a high number of replicates (e.g., 20-24) to establish a detection frequency at each concentration level [75] [76].
- Data Analysis: The results (detected/not detected) are subjected to probit regression analysis. The LOD95% is statistically defined as the concentration at which 95% of the test replicates return a positive result [75] [76].
- Application Example: In a study on SARS-CoV-2 detection, the LOD for a multiplex PCR assay was determined by testing 20 replicates of plasmid dilutions, with the LOD95% calculated to be between 4.94 and 14.03 copies/µL for the different targets [75].
Establishing Inclusivity and Exclusivity
These parameters measure an assay's analytical specificity.
- Inclusivity (True Positive Rate): The ability of an assay to detect the intended target from a wide range of strains, isolates, or subspecies.
- Protocol: The assay is challenged against a well-characterized panel of target strains. For example, a validation study for an Xanthomonas assay tested 91 target strains to demonstrate 100% inclusivity [19]. Similarly, a respiratory panel assay was validated against 47 reference strains of the target pathogens [75].
- Exclusivity (True Negative Rate): The ability of the assay to avoid cross-reacting with non-target organisms, especially near-neighbors.
- Protocol: The assay is tested against a panel of non-target strains. The panel should include closely related species, species from the same habitat, and common contaminants. The Xanthomonas assay, for instance, was tested against 101 non-target strains, achieving 97.2% exclusivity, with cross-reactivity only observed with the closely related X. citri pv. cajani [19].
The Role of Comparative Genomics in Primer Design
The shift from traditional, often consensus-based primer design (e.g., using 16S rRNA) to genomics-driven approaches has significantly enhanced assay specificity.
- Pan-Genome Analysis: This comparative genomics technique categorizes the genomic content of a species into the core genome (shared by all strains) and the accessory genome (unique to some strains). This allows for the identification of unique, strain-specific genomic regions as targets for primer design [3].
- Bioinformatics Tools: Various tools facilitate this analysis:
- Case Study - Salmonella Detection: Researchers used the BPGA tool to analyze 60 Salmonella serovars. They identified the gene
SIN_02055as specific for Salmonella Infantis and designed a primer-probe set that distinguished it with 100% accuracy [3]. This demonstrates the power of genomics to develop highly specific detection assays for individual serovars.
Signaling Pathways and Workflows
The following diagram illustrates the integrated workflow for establishing analytical validation, highlighting the central role of comparative genomics.
The Scientist's Toolkit: Research Reagent Solutions
This table outlines essential materials and their functions for conducting analytical validation studies.
Table 2: Key Reagents and Materials for Validation Experiments
| Item | Function in Validation | Example/Note |
|---|---|---|
| Reference Strains | Serves as positive controls for inclusivity testing and for creating standard curves for LOD determination. | A wide panel of well-characterized target strains is crucial [74] [19]. |
| Non-Target Strain Panel | Used to challenge the assay and establish exclusivity. Should include phylogenetically close relatives. | The panel in [19] included 101 non-target strains. |
| Commercial DNA Extraction Kits | Standardizes the process of nucleic acid purification, reducing variability and the impact of inhibitors. | Kits like the High Pure PCR Template Preparation Kit are commonly used [74]. |
| Internal Control Genes | Co-extracted and co-amplified with the target to validate DNA extraction quality and detect PCR inhibition. | The 5.8S rDNA plant gene was used in a duplex qPCR for Xanthomonas [19]. |
| Probit Analysis Software | Statistical software used to calculate the LOD95% from the results of the dilution series replicate testing. | Used in studies such as [75] and [76]. |
| Automated Nucleic Acid Extraction System | Increases throughput, improves reproducibility, and reduces cross-contamination risk during sample processing. | Mentioned in the clinical validation of the multiplex respiratory assay [75]. |
The accurate and timely identification of bacterial pathogens is a cornerstone of effective clinical diagnostics and antimicrobial stewardship. For decades, culture-based techniques have served as the gold standard in microbiology laboratories, relying on the growth and phenotypic identification of organisms [78] [79]. The advent of molecular methods, particularly broad-range 16S ribosomal RNA (rRNA) gene PCR followed by sequencing, has provided a powerful culture-independent tool for pathogen detection [80] [81]. This guide provides an objective comparison of these two diagnostic paradigms, framing the discussion within the context of modern comparative genomics, which informs the development of more specific and reliable PCR assays [3].
The 16S rRNA gene is a preferred target for bacterial identification because it contains a unique combination of highly conserved regions, which allow for universal primer binding, and hypervariable regions, which provide species-specific signatures [79] [82]. While traditional culture remains a mainstay, its limitations in cases of prior antibiotic treatment, slow-growing, or fastidious organisms have created a critical niche for molecular methods [78] [83]. The following sections synthesize recent clinical evidence and experimental data to benchmark the performance of these techniques, detailing the protocols that generate these critical results.
Performance Comparison: Diagnostic Yield, Sensitivity, and Specificity
Numerous clinical studies have directly compared the performance of culture-based methods and 16S rRNA PCR across various sample types and patient populations. The data below summarize key performance metrics from recent research.
Table 1: Comparative Diagnostic Performance of Culture vs. 16S rRNA PCR/Sequencing
| Study & Sample Type | Key Performance Findings (Culture vs. Molecular Method) | Concordance Rate |
|---|---|---|
| 101 Clinical Samples (Various) [78] | Positivity Rate: 59% for Sanger sequencing vs. 72% for NGS (ONT).Polymicrobial Detection: NGS identified more polymicrobial samples (13) than Sanger (5). | 80% between Sanger and ONT sequencing |
| 86 IK Episodes [79] | Sensitivity: Direct culture (87.5%), Indirect culture (85.4%), PCR (73.5%).Specificity: All three tests demonstrated 100% specificity. | Substantial agreement (81.8–86.2%; Cohen's k = 0.67–0.72) |
| 123 Pediatric Samples [81] | Positivity Rate: Culture (29.3%), 16S NGS (57.7%).Impact of Antibiotics: 84 samples from patients on antibiotics; 16S NGS maintained higher sensitivity. | 54.5% between culture and 16S NGS |
| 123 Clinical Samples [83] | Sensitivity: Culture (36.4%), 16S NGS (68.7%).Specificity: Culture (100%), 16S NGS (87.5%).Utility: 16S NGS had diagnostic utility in >60% of confirmed infections. | 54.5% between culture and 16S NGS |
The data consistently demonstrate that 16S rRNA NGS offers a significantly higher sensitivity and positivity rate compared to traditional culture, particularly in challenging diagnostic scenarios. This advantage is most pronounced in patients who have received prior antibiotic therapy, as PCR detects microbial DNA from both viable and non-viable organisms [79] [83]. Furthermore, NGS methods vastly outperform culture and Sanger sequencing in identifying polymicrobial infections, which are a known limitation of Sanger sequencing due to uninterpretable chromatograms from mixed templates [78] [83].
However, traditional culture maintains a crucial role. It provides live isolates essential for conducting antimicrobial susceptibility testing (AST), which is critical for guiding targeted antibiotic therapy [83]. Culture also exhibits exceptionally high specificity, with some studies reporting 100% [79]. Molecular methods can have lower specificity due to their exquisite sensitivity, which may detect environmental contaminants or clinically insignificant DNA, requiring careful clinical correlation [83].
Experimental Protocols and Methodologies
A clear understanding of the experimental workflows is essential for interpreting the comparative data.
Culture-Based Protocol
The standard culture methodology involves the following key steps [79] [84]:
- Sample Collection and Processing: Clinical samples (e.g., tissue, fluid, swabs) are collected aseptically. Tissue and fluid samples are typically homogenized or vortexed.
- Inoculation and Incubation: Samples are inoculated onto a series of culture media, including:
- Aerobic agar plates (e.g., Blood agar, Chocolate agar).
- Anaerobic agar plates (e.g., Fastidious Anaerobe Agar).
- Enrichment broths to support the growth of fastidious organisms. Plates and broths are incubated under appropriate atmospheric conditions (aerobic, anaerobic, CO₂-enriched) for a period ranging from 24-48 hours up to 14 days for slow-growing pathogens [79].
- Isolate Identification: Bacterial growth is identified based on colony morphology, Gram staining, and biochemical tests. In modern laboratories, Matrix-Assisted Laser Desorption/Ionization Time-of-Flight Mass Spectrometry (MALDI-TOF MS) is the standard for rapid and accurate identification of isolates [78] [83].
16S rRNA Gene PCR and Sequencing Protocol
The molecular workflow consists of DNA-centric steps and bioinformatic analysis [78] [80] [81]:
- DNA Extraction: Total genomic DNA is extracted directly from the clinical sample using commercial kits, which also removes potential PCR inhibitors.
- PCR Amplification: Broad-range ("universal") primers targeting conserved regions of the bacterial 16S rRNA gene are used to amplify a specific segment. This can be a single hypervariable region (e.g., V3-V4 for Illumina) or the nearly full-length gene (for long-read sequencing).
- Sequencing: The amplified PCR products are sequenced using one of several platforms:
- Sanger Sequencing: Suitable for pure, monomicrobial samples. Becomes uninterpretable with mixed templates [78].
- Next-Generation Sequencing (NGS): Platforms like Illumina (short-read) or Oxford Nanopore Technologies (ONT) and PacBio (long-read) enable deep sequencing of complex mixtures. Long-read technologies improve species-level resolution by covering more variable regions [78] [80] [82].
- Bioinformatic Analysis: Sequencing reads are processed through a pipeline that includes:
- Quality filtering and denoising.
- Clustering into Operational Taxonomic Units (OTUs) or resolving Amplicon Sequence Variants (ASVs).
- Taxonomic assignment by comparing sequences to curated databases (e.g., NCBI, SILVA) using tools like BLAST.
Table 2: Key Research Reagent Solutions in 16S rRNA PCR and Sequencing
| Reagent/Material | Function in the Workflow | Specific Examples |
|---|---|---|
| DNA Extraction Kit | Isolates total genomic DNA from clinical samples, removing inhibitors. | Molzym Micro-Dx kit [78]; QIAamp DNA Blood Kit [80] |
| Broad-Range PCR Primers | Amplifies a specific region of the 16S rRNA gene from a wide range of bacteria. | 27F/1492R [84]; primers targeting V3-V4 [82] or V1-V9 [80] |
| Sequencing Platform | Determines the nucleotide sequence of the PCR amplicons. | Illumina MiSeq [80] [82]; Oxford Nanopore GridION/MinION [78] [80]; PacBio Sequel II [82] |
| Bioinformatics Software | Analyzes raw sequence data for quality control, taxonomic assignment, and diversity analysis. | EPI2ME Fastq 16S [78]; Pathogenomix [81]; DADA2 [82]; Cheryblast+ob [85] |
The Role of Comparative Genomics in Primer Development
While the 16S rRNA gene is a powerful tool, traditional primers targeting it can sometimes lead to false positives or negatives due to insufficient specificity [3] [86]. Comparative genomics and pan-genome analysis are now being leveraged to overcome these limitations and develop more robust diagnostic assays.
Pan-genome analysis classifies the genomic content of a species or genus into the core genome (shared by all strains) and the accessory genome (unique to some strains) [3]. This allows researchers to move beyond the 16S rRNA gene and identify novel, highly specific genomic targets for PCR primer design.
This approach has been successfully applied to develop detection assays for various foodborne and clinical pathogens. For instance:
- Salmonella enterica serovar Montevideo: Primers were designed using the panX tool, showing high sensitivity and selectivity in food samples like raw chicken meat and black pepper [3].
- Salmonella Infantis: The Bacterial Pan Genome Analysis (BPGA) pipeline identified a unique gene marker (SIN_02055) that distinguished this serovar with 100% accuracy [3].
- PCR Primer Refinement: Studies have redesigned universal 16S primers (e.g., creating Bac1f and UN1542r) to avoid overlapping variable sites that could introduce mismatches and artifacts during amplification, thereby improving functional analysis [86].
Tools like Roary, BPGA, and panX are instrumental in this process, enabling researchers to visualize whole-genome alignments, identify core and accessory genes, and integrate phylogenetic context to select optimal primer targets [3].
The benchmarking data presented in this guide clearly delineate the complementary strengths and limitations of culture-based techniques and 16S rRNA PCR.
- Culture remains indispensable for obtaining isolates for antimicrobial susceptibility testing and maintains high specificity.
- 16S rRNA NGS demonstrates superior sensitivity, particularly in culture-negative cases, patients on antibiotic therapy, and polymicrobial infections.
The future of microbial diagnostics lies in leveraging these methods synergistically, not as competitors. Furthermore, the integration of comparative genomics into diagnostic primer design represents a significant advancement, enabling the development of highly specific assays that overcome the limitations of traditional 16S rRNA targets. This evolution towards genome-informed diagnostics promises even greater accuracy and reliability in identifying bacterial pathogens, ultimately supporting improved patient management and drug development efforts.
The accurate detection and quantification of specific microorganisms in complex sample matrices is a critical challenge across food safety, clinical diagnostics, and environmental monitoring. Complex matrices—characterized by their diverse chemical composition, heterogeneous physical structure, and presence of inhibitory substances—can significantly compromise the sensitivity and specificity of molecular detection methods. For polymerase chain reaction (PCR)-based assays, the design of highly specific primers is paramount to achieving reliable results. Traditional approaches often targeted conserved genes, such as 16S rRNA, but increasing evidence reveals significant limitations, including false-positive results and an inability to distinguish between closely related strains [87].
Comparative genomics has emerged as a powerful alternative for developing precise detection methods. By analyzing the complete genetic material of organisms, researchers can identify unique genomic regions that serve as highly specific targets. This review objectively compares the performance of various genomics-based approaches for primer development, focusing on their validation across complex sample matrices. We examine experimental data, methodological protocols, and performance metrics to provide a comprehensive comparison of these advanced techniques.
Comparative Genomics Approaches for Primer Design
Pan-Genome Analysis for Target Identification
Pan-genome analysis, a core methodology in comparative genomics, categorizes genomic content into core genes (shared by all strains) and accessory genes (unique to specific strains) [87]. This approach enables the identification of species- or strain-specific genomic regions that serve as ideal targets for PCR primer design. Unlike conventional methods that rely on limited genetic markers, pan-genome analysis utilizes entire genomic datasets to discover targets with precisely defined specificity ranges.
Various bioinformatics tools facilitate pan-genome analysis, each with distinct strengths and computational requirements:
Table 1: Bioinformatics Tools for Pan-Genome Analysis in Primer Development
| Tool Name | Primary Features | Advantages | Limitations |
|---|---|---|---|
| Roary | Fast pan-genome visualization for prokaryotes | High-speed analysis | Lower sensitivity with highly divergent genomes |
| BPGA Pipeline | Phylogenetic generation predictions, unique gene identification | User-friendly | Limited visualization capabilities |
| PGAP-X | Whole-genome alignments, genetic variation analysis, functional annotation | Comprehensive feature set | Requires advanced bioinformatics expertise |
| EDGAR | Web-based comparative genomics | Intuitive visualizations, minimal computational requirements | Limited customization options |
| panX | Integrates phylogenetic and genomic analyses with interactive visualization | User-friendly interface for data exploration | -- |
The selection of appropriate analysis software directly impacts the specificity of subsequently designed primers. For instance, Roary has been successfully employed to design specific primers for Salmonella enterica serogroup E, while BPGA facilitated the development of markers for Salmonella Infantis with 100% specificity [87].
Genome-Wide Association Studies (GWAS) for Marker Discovery
Beyond pan-genome analysis, genome-wide association studies represent another powerful genomics approach for identifying genetic markers associated with specific phenotypes. In fruit research, GWAS identified a specific InDel (Ethd1) strongly associated with ethylene production phenotypes in pears [88]. This marker, located upstream of the ACS1 gene, enabled the development of PCR primers that could distinguish between ethylene-dependent and ethylene-independent fruit types with perfect accuracy across 118 pear accessions [88].
Performance Comparison Across Sample Matrices
Food Matrices
Food samples present particular challenges for molecular detection due to their complex biochemical composition, which often includes fats, proteins, carbohydrates, and PCR inhibitors. Comparative genomics-based primer systems have demonstrated superior performance in various food matrices compared to conventional methods:
Table 2: Performance Metrics of Genomics-Based Detection in Food Matrices
| Target Organism | Sample Matrix | Conventional Method | Genomics-Based Method | Limit of Detection (LOD) | Specificity | Citation |
|---|---|---|---|---|---|---|
| Bifidobacterium animalis | Skimmed milk, fermented milk | Plate counting method (PCM) | csp-based RT-qPCR | 7.2 × 10¹ CFU/mL | 100% (no cross-reactivity with other Bifidobacteria) | [43] |
| Salmonella enterica serovar Montevideo | Tomato, raw chicken, red pepper, black pepper | XLD media culture | Pan-genomics-based real-time PCR | -- | Effectively detected pathogens in challenging matrices | [87] |
| Cronobacter sakazakii | Powdered infant formula, milk | -- | Comparative genomics-based PCR (fimG, lpfA_1 targets) | -- | Effective detection in complex dairy matrices | [87] |
| Ochratoxins (OTA, OTB, OTC) | Roasted coffee, spices | -- | IAC-based HPLC-FLD/UHPLC-MS/MS | 0.3 µg/kg (HPLC-FLD), 0.1 µg/kg (UHPLC-MS/MS) | Mean recovery: 82.00-112.51% | [89] |
The experimental data demonstrate that comparative genomics approaches consistently outperform conventional methods in complex food matrices. The csp-based RT-qPCR method for Bifidobacterium animalis detection showed no significant difference in viable counts between skimmed milk and fermented milk samples, while traditional plate counting methods and previously reported recA methods yielded significantly higher counts due to non-specific detection [43]. This highlights the superior specificity of genomics-based primers in distinguishing target organisms within complex microbial communities.
Clinical and Environmental Matrices
In clinical and environmental settings, detection methods must contend with diverse inhibitors and often lower target concentrations. Whole Genome Sequencing (WGS) has revolutionized clinical pathogen detection, enabling high-resolution characterization of virulence and antimicrobial resistance genes in multidrug-resistant Bacillus cereus isolated from hospital wastewater [90]. WGS provided comprehensive AMR profiling, identifying genes conferring resistance to beta-lactams, tetracyclines, glycopeptides, and fosfomycin [90].
For environmental screening, advanced sequencing technologies have enabled pathogen detection even before clinical cases emerge. A study monitoring irrigation channels in an Italian regional park detected the fungal pathogen Batrachochytrium dendrobatidis months before the first case was reported in wild animals [91]. This early detection capability demonstrates the powerful predictive potential of genomics-based environmental monitoring.
Experimental Protocols and Workflows
Comparative Genomics Workflow for Primer Development
The development of specific primers through comparative genomics follows a systematic workflow that integrates bioinformatics analysis with laboratory validation:
Diagram 1: Comparative genomics workflow for primer development. The process begins with genome collection, proceeds through bioinformatics analysis (blue), and culminates in laboratory validation (green).
Laboratory Validation in Complex Matrices
Following the in silico phases, laboratory validation rigorously tests primer performance in complex matrices:
Diagram 2: Laboratory validation workflow for primer testing in complex matrices. This critical phase confirms analytical performance under realistic conditions.
Key considerations for matrix-specific validations include:
- Food matrices: Addressing inhibitors like fats, polyphenols, and polysaccharides through optimized extraction methods [43] [89]
- Clinical samples: Accounting for human DNA background and various clinical reagents
- Environmental samples: Handling diverse microbial communities and environmental inhibitors
For ochratoxin detection in complex coffee and spice matrices, researchers developed a novel 0.5% Tween-20-PBS immunoaffinity column load and wash procedure to overcome severe matrix interference [89]. This optimized protocol demonstrated excellent linearity (r > 0.999), accuracy (mean recovery 82.00-112.51%), and precision (RSD% ≤ 8.81%) across contamination levels from 0.3-10 µg/kg [89].
The Scientist's Toolkit: Essential Research Reagents
Successful implementation of comparative genomics-based detection methods requires specific reagents and tools optimized for complex matrices:
Table 3: Essential Research Reagents for Genomics-Based Detection in Complex Matrices
| Reagent/Tool Category | Specific Examples | Function in Workflow | Considerations for Complex Matrices |
|---|---|---|---|
| DNA/RNA Extraction Kits | Commercial kits with inhibitor removal steps | Nucleic acid purification | Must include matrix-specific protocols for removing PCR inhibitors |
| PCR Enzymes | Polymerases with inhibitor resistance (e.g., recombinant Taq) | DNA amplification | Should maintain activity in presence of matrix-derived inhibitors |
| Immunoaffinity Columns | OTA-Clean IACs (Meizheng Bio-tech) | Sample clean-up and target enrichment | Require cross-reactivity validation for analyte analogues [89] |
| Bioinformatics Tools | Roary, BPGA, panX | Target identification and primer design | Must handle large genomic datasets efficiently |
| Reference Materials | Certified matrix-matched reference materials | Method validation | Essential for accurate recovery calculations |
| Inhibition Resistant Buffers | Tween-20-PBS solutions [89], BSA supplements | Reduction of matrix effects | Critical for maintaining assay sensitivity in complex samples |
Comparative genomics has fundamentally advanced our ability to develop highly specific detection methods for complex matrices across food, clinical, and environmental applications. The experimental data comprehensively demonstrate that genomics-based primers consistently outperform conventional approaches in sensitivity, specificity, and reliability. Pan-genome analysis emerges as a particularly powerful approach, enabling the identification of unique genomic targets that facilitate precise detection even in challenging sample matrices.
The continued evolution of sequencing technologies, bioinformatics tools, and matrix-tolerant reagents will further enhance our capacity to detect and quantify biological targets across diverse sample types. As these methods become more accessible and standardized, they promise to significantly improve monitoring capabilities, risk assessments, and public health protection across multiple sectors.
The accurate and early detection of Xanthomonas citri pv. citri (Xcc), the causative agent of Asiatic Citrus Canker (ACC), is a critical component of global citrus disease management. ACC severely impacts citrus production worldwide, leading to significant economic losses due to reduced crop yield and quality, the cost of eradication campaigns, and restrictions on international trade [92] [19]. For instance, over one billion US dollars was spent over a decade in Florida in an attempt to eradicate the pathogen [19]. Effective surveillance, which depends on specific and sensitive detection protocols, is vital for preventing the introduction and establishment of Xcc in disease-free areas [92].
This case study explores the development and validation of a novel genomic-driven PCR assay for Xcc detection, framing it within the broader thesis of applying comparative genomics for advanced PCR primer development. We will objectively compare this method's performance against existing diagnostic alternatives, providing supporting experimental data and detailed methodologies to highlight its enhanced analytical specificity and sensitivity.
The Genomic Workflow for Primer Development
The development of highly specific molecular detection assays has been revolutionized by comparative genomics. This approach leverages the vast amount of data from publicly available microbial genomes to identify unique DNA markers that are specific to a target pathogen [3] [92].
Core Principles of Comparative Genomics in Primer Design
Traditional PCR detection often relied on conserved gene regions, such as the 16S rRNA gene, which can lead to false-positive and false-negative results due to insufficient specificity [3]. Comparative genomics overcomes this limitation through pan-genome analysis, which categorizes the entire gene repertoire of a species into:
- Core genome: Genes shared by all strains of a species, essential for basic growth and survival.
- Accessory genome: Genes unique to specific strains, which can provide insights into genomic adaptability and pathogenesis [3].
By analyzing both core and accessory genomes, researchers can identify genetic regions that are universally present within the target pathogen but absent in closely related non-target organisms. This ensures that developed primers will have high inclusivity (the ability to detect all target strains) and high exclusivity (the ability to avoid non-target detection) [3] [92].
Workflow for Genomic-Driven Assay Development
The following diagram illustrates the comprehensive workflow for developing a specific PCR assay through comparative genomics, from in silico analysis to laboratory validation.
Comparative Performance of Xcc Detection Assays
The table below summarizes key performance metrics for several PCR-based assays developed for detecting Xanthomonas citri pv. citri, highlighting the advancements achieved through genomic-driven approaches.
Table 1: Performance Comparison of PCR-Based Assays for Xcc Detection
| Target Gene / Assay | Method | Inclusivity | Exclusivity | Analytical Sensitivity (LOD95%) | Key Findings |
|---|---|---|---|---|---|
| XAC1051-2qPCR [92] [19] | Duplex qPCR (TaqMan) | 100% | 97.2% | 754 CFU/ml (15 cells/reaction) | Developed via comparative genomics; includes internal plant control; detected pathogen in herbarium samples. |
| XAC1051 Conventional PCR [92] [19] | Conventional PCR | 100% | 100% | 5234 CFU/ml (105 cells/reaction) | Developed via comparative genomics; high specificity. |
| hrpW-based PCR [93] | Conventional PCR | Specific for Xcc pathovar | Specific for Xcc pathovar | Not specified | Early pathovar-specific assay; used to detect pathogen in naturally or artificially infected leaves. |
The data demonstrates that the XAC1051-2qPCR assay offers a superior combination of high sensitivity and specificity, with the added robustness of an internal control system to validate the DNA extraction and amplification process [92] [19].
Experimental Protocol: The XAC1051-2qPCR Assay
This section provides the detailed methodology for the genomic-driven duplex qPCR assay, enabling replication and implementation in diagnostic laboratories.
Primer and Probe Sequences
The assay targets the XAC1051 gene, which encodes a putative transmembrane protein and was identified as highly specific through comparative genomics [92] [19].
Table 2: Primer and Probe Sequences for the XAC1051-2qPCR Assay
| Assay Component | Sequence (5' → 3') | Amplicon Size | Label |
|---|---|---|---|
| Forward Primer (qPCR-XAC1051-F) | AGAGGCGCACTATGGCTTTC | 58 bp | - |
| Reverse Primer (qPCR-XAC1051-R) | CAACCCAGGACCTGCAAGAA | 58 bp | - |
| Probe (P-XAC1051-MGB) | CGGTGAGAAGCTGTAC | 58 bp | 6-FAM |
| Forward Primer (citrus5.8S -F) | GCGAAATGCGATACTTGGTGTGA | 94 bp | - |
| Reverse Primer (citrus5.8S-R) | CGTGCCCTCGGCCTAATG | 94 bp | - |
| Probe (P-citrus5.8S- MGB) | ATCCCGTGAACCATCG | 94 bp | Vic |
Step-by-Step Procedure
- DNA Extraction: Extract total DNA from citrus leaf, fruit, or stem tissue (preferably symptomatic parts) using a commercial plant DNA extraction kit. The inclusion of an internal control (e.g., citrus 5.8S rDNA) co-extracted with the sample is crucial for identifying PCR inhibition or extraction failures [92] [19].
- qPCR Reaction Setup:
- Prepare a reaction mix containing:
- 1X TaqMan Universal PCR Master Mix
- 900 nM of each XAC1051 forward and reverse primer
- 200 nM of XAC1051 FAM-labeled TaqMan MGB probe
- 200 nM of each citrus 5.8S rDNA forward and reverse primer
- 100 nM of citrus 5.8S rDNA VIC-labeled TaqMan MGB probe
- 2-5 µL of template DNA
- Nuclease-free water to a final volume of 20-25 µL.
- Prepare a reaction mix containing:
- qPCR Amplification:
- Run the reaction on a real-time PCR instrument using the following cycling conditions:
- Initial Denaturation: 95°C for 10 minutes (1 cycle)
- Amplification: 95°C for 15 seconds, followed by 60°C for 1 minute (40 cycles)
- Run the reaction on a real-time PCR instrument using the following cycling conditions:
- Result Interpretation:
- A sample is considered positive for Xcc if an exponential amplification curve is detected in the FAM channel (XAC1051 target) with a cycle threshold (Ct) value below a predetermined cut-off (established via receiver-operating characteristic analysis) [92].
- The assay is valid only if a corresponding amplification curve is detected in the VIC channel (5.8S rDNA control), confirming the quality of the DNA extract and the absence of PCR inhibitors.
The Scientist's Toolkit: Essential Research Reagents
The following table lists key reagents and their functions essential for conducting comparative genomic analysis and developing PCR-based diagnostics.
Table 3: Research Reagent Solutions for Genomic-Driven Diagnostic Development
| Reagent / Tool | Function | Example Use Case |
|---|---|---|
| Bioinformatics Suites (e.g., Roary, BPGA, panX) | Perform pan-genome analysis to identify core and accessory genes. | Identifying subspecies-specific genes in Mycobacterium abscessus for diagnostic PCR assay development [3] [11]. |
| Primer/Probe Design Software (e.g., Primer Express) | Designs oligonucleotide sequences with optimal melting temperatures and specificity for qPCR assays. | Used to design the primer-probe sets for the XAC1051 and internal control targets [92]. |
| TaqMan Universal PCR Master Mix | Provides the necessary enzymes, dNTPs, and buffer for efficient probe-based qPCR amplification. | Forms the core reaction mixture for the XAC1051-2qPCR assay [92]. |
| Commercial Plant DNA Extraction Kits | Isolate high-quality, PCR-grade DNA from complex plant tissues while removing inhibitors. | Used to prepare template DNA from citrus leaves and fruit for detection assays [92] [19]. |
| Whole-Genome Sequence Databases (e.g., NCBI) | Provide the raw genomic data required for in silico comparative analyses and marker discovery. | Sourced 30 Xcc and 30 non-target Xanthomonas genomes to identify the XAC1051 marker [92]. |
This case study demonstrates the transformative power of comparative genomics in developing precise diagnostic tools. The genomic-driven XAC1051-2qPCR assay for Xanthomonas citri pv. citri represents a significant advancement over previous methods, offering a validated combination of high specificity, sensitivity, and reliability for use in complex plant samples. This approach provides a robust framework for the future development of detection assays for other agriculturally and clinically significant pathogens, ultimately strengthening disease surveillance and management efforts worldwide.
Conclusion
Comparative genomics provides a powerful, genome-informed framework for PCR primer development, decisively addressing the specificity limitations of traditional targets like the 16S rRNA gene. By leveraging pan-genome analyses, researchers can now design assays that accurately distinguish between closely related species and subtypes, which is crucial for precise diagnostics, effective outbreak tracking, and quality control of probiotics. Future directions point toward the integration of machine learning for predictive primer design, the application of these methods for detecting antibiotic resistance genes, and the development of portable, genomics-driven diagnostic kits for clinical and field use. This approach is poised to become the new gold standard, fundamentally enhancing our capabilities in biomedical research and public health protection.
References
- 1. Pan-genome [https://en.wikipedia.org/wiki/Pan-genome]
- 2. A draft human pangenome reference [https://www.nature.com/articles/s41586-023-05896-x]
- 3. Application of Comparative Genomics for the Development ... [https://pmc.ncbi.nlm.nih.gov/articles/PMC11942385/]
- 4. First Steps in the Analysis of Prokaryotic Pan-Genomes [https://pmc.ncbi.nlm.nih.gov/articles/PMC7418249/]
- 5. PathoGD: an integrative genomics approach to primer and ... [https://www.nature.com/articles/s42003-025-07591-1]
- 6. Limitations of 16S rRNA Gene Sequencing to Characterize ... [https://pmc.ncbi.nlm.nih.gov/articles/PMC8359668/]
- 7. Primer, Pipelines, Parameters: Issues in 16S rRNA Gene ... [https://pmc.ncbi.nlm.nih.gov/articles/PMC8544895/]
- 8. Non-specific amplification of human DNA is a major ... [https://www.nature.com/articles/s41598-020-73403-7]
- 9. Specific and Sensitive Primers Developed by Comparative ... [https://pmc.ncbi.nlm.nih.gov/articles/PMC5880354/]
- 10. The unresolved struggle of 16S rRNA amplicon sequencing [https://environmentalmicrobiome.biomedcentral.com/articles/10.1186/s40793-025-00705-6]
- 11. The Use of Comparative Genomic Analysis for ... [https://www.frontiersin.org/journals/cellular-and-infection-microbiology/articles/10.3389/fcimb.2022.816615/full]
- 12. Primer designing tool - NCBI - NIH [https://www.ncbi.nlm.nih.gov/tools/primer-blast/]
- 13. PrimerBank [https://pga.mgh.harvard.edu/primerbank/]
- 14. A comprehensive collection of experimentally validated ... [https://bmcgenomics.biomedcentral.com/articles/10.1186/1471-2164-9-633]
- 15. A Review of Pangenome Tools and Recent Studies - NCBI [https://www.ncbi.nlm.nih.gov/books/NBK558826/]
- 16. PGAweb: A Web Server for Bacterial Pan-Genome Analysis [https://www.frontiersin.org/journals/microbiology/articles/10.3389/fmicb.2018.01910/full]
- 17. A comparative study of pan-genome methods for microbial ... [https://pmc.ncbi.nlm.nih.gov/articles/PMC8743560/]
- 18. Top Pangenome Analysis Tools Compared [https://www.cd-genomics.com/pop-genomics/resources/pangenome-analysis-tools-comparison.html]
- 19. Development and comparative validation of genomic-driven ... [https://bmcmicrobiol.biomedcentral.com/articles/10.1186/s12866-020-01972-8]
- 20. Tools for bacterial comparative genomics [https://holtlab.net/2015/02/25/tools-for-bacterial-comparative-genomics/]
- 21. Analysis tools - NCBI - NLM - NIH [https://www.ncbi.nlm.nih.gov/comparative-genomics-resource/analysis-tools/]
- 22. 20 Free Bioinformatics Tools for Genomic Data Analysis [https://ngscloud.com/20-free-bioinformatics-tools-for-genomic-data-analysis/]
- 23. Comparative transcriptomics of pathogenic and non ... [https://pmc.ncbi.nlm.nih.gov/articles/PMC3377988/]
- 24. Listeria innocua - an overview [https://www.sciencedirect.com/topics/immunology-and-microbiology/listeria-innocua]
- 25. Identifying a novel Listeria innocua subgroup and ... [https://www.sciencedirect.com/science/article/pii/S0023643824003876]
- 26. Listeria Detection and Identification Methods in Foods [https://www.rapidmicrobiology.com/test-method/listeria-detection-and-identification-methods]
- 27. New Listeria Species Detection Methods - bioMerieux [https://www.biomerieux.com/nl/en/Education/resource-hub/scientific-library/food-safety-library/new-listeria-species-detection-methods.html]
- 28. Detection and Differentiation of Listeria spp. by a Single ... [https://pmc.ncbi.nlm.nih.gov/articles/PMC91627/]
- 29. Comparative genomics analysis to explore the biodiversity ... [https://www.frontiersin.org/journals/microbiology/articles/10.3389/fmicb.2024.1424868/full]
- 30. Development of a specific and sensitive diagnostic PCR for ... [https://www.sciencedirect.com/science/article/pii/S0890850822001013]
- 31. bacLIFE: a user-friendly computational workflow for ... [https://www.nature.com/articles/s41467-024-46302-y]
- 32. Subspecies-level genome comparison of Lactobacillus ... [https://www.nature.com/articles/s41598-023-29404-3]
- 33. Real-time PCR assay for detecting Lactobacillus plantarum ... [https://www.sciencedirect.com/science/article/pii/S0023643820317783]
- 34. Primer-BLAST: A tool to design target-specific primers for polymerase chain reaction | BMC Bioinformatics [https://link.springer.com/article/10.1186/1471-2105-13-134]
- 35. Design PCR primers and check them for specificity [https://www.ncbi.nlm.nih.gov/guide/howto/design-pcr-primers/]
- 36. Advanced strategies for target selection, primer design, and ... [https://www.sciencedirect.com/science/article/pii/S0580951725000170]
- 37. Effective primer design for genotype and subtype detection of ... [https://bmcbioinformatics.biomedcentral.com/articles/10.1186/s12859-025-06251-9]
- 38. PCR Primer Design Tips - Behind the Bench [https://www.thermofisher.com/blog/behindthebench/pcr-primer-design-tips/]
- 39. Rules and Tips for PCR & qPCR Primer Design | IDT [https://www.idtdna.com/page/support-and-education/decoded-plus/how-to-design-primers-and-probes-for-pcr-and-qpcr/]
- 40. Optimizing PCR Reaction Conditions for High Fidelity and ... [https://www.labx.com/resources/optimizing-pcr-reaction-conditions-for-high-fidelity-and-yield/5579]
- 41. Comprehensive Primer Design for Analysis of Population ... [https://journals.plos.org/plosone/article?id=10.1371/journal.pone.0032314]
- 42. Performance Comparison of Two In-House PCR Methods ... [https://pmc.ncbi.nlm.nih.gov/articles/PMC11899361/]
- 43. Development of a csp-based RT-qPCR method for specific ... [https://www.sciencedirect.com/science/article/abs/pii/S0963996925017788]
- 44. Novel primers drive accurate SYBR Green PCR detection ... [https://www.nature.com/articles/s41598-024-81508-6]
- 45. Establishment of a Sensitive and Visual Detection Platform for ... [https://pmc.ncbi.nlm.nih.gov/articles/PMC12114456/]
- 46. Comparison of qRT-PCR and ddPCR for multi-strain ... [https://www.frontiersin.org/journals/microbiology/articles/10.3389/fmicb.2025.1579797/full]
- 47. Comparison of qRT-PCR and ddPCR for multi-strain ... [https://pmc.ncbi.nlm.nih.gov/articles/PMC12066471/]
- 48. Troubleshooting primer dimer in PCR – miniPCR bio [https://www.minipcr.com/primer-dimer-pcr/]
- 49. DNA Polymerase—Four Key Characteristics for PCR [https://www.thermofisher.com/us/en/home/life-science/cloning/cloning-learning-center/invitrogen-school-of-molecular-biology/pcr-education/pcr-reagents-enzymes/dna-polymerase-characteristics.html]
- 50. Eliminating primer dimers and improving SNP detection ... [https://pmc.ncbi.nlm.nih.gov/articles/PMC7200914/]
- 51. Polymerase Chain Reaction: Basic Protocol Plus ... [https://pmc.ncbi.nlm.nih.gov/articles/PMC4846334/]
- 52. Risk of Misdiagnosis Due to Allele Dropout and False ... [https://www.sciencedirect.com/science/article/pii/S1525157815001208]
- 53. The elimination of primer-dimer accumulation in PCR - PMC [https://pmc.ncbi.nlm.nih.gov/articles/PMC146890/]
- 54. Primer Dimer - an overview | ScienceDirect Topics [https://www.sciencedirect.com/topics/biochemistry-genetics-and-molecular-biology/primer-dimer]
- 55. PCR Optimization: Strategies To Minimize Primer Dimer [https://genemod.net/blog/pcr-optimization]
- 56. qPCR primer design revisited - PMC - PubMed Central - NIH [https://pmc.ncbi.nlm.nih.gov/articles/PMC5702850/]
- 57. PCR Optimization: Factors Affecting Reaction Specificity ... [https://www.mybiosource.com/learn/pcr-optimization-factors-affecting-reaction-specificity-and-efficien/]
- 58. PCR Assay Optimization and Validation [https://www.sigmaaldrich.com/US/en/technical-documents/technical-article/genomics/pcr/assay-optimization-and-validation?srsltid=AfmBOoqX6c-_HKxU2Rp7jZoIghhp2EYxCvK3v5VzKqjoE7hH3OeKd9UI]
- 59. Optimizing Primer and Probe Concentrations for Use in ... [https://pubmed.ncbi.nlm.nih.gov/30275074/]
- 60. Real-time PCR probe optimization using design of ... [https://www.sciencedirect.com/science/article/pii/S2214753515300139]
- 61. An optimized protocol for stepwise optimization of real-time ... [https://www.nature.com/articles/s41438-021-00616-w]
- 62. Characterizing the Impact of Primer-Template Mismatches ... [https://www.sciencedirect.com/science/article/pii/S1525157822002458]
- 63. Thermodynamic evaluation of the impact of DNA mismatches ... [https://pmc.ncbi.nlm.nih.gov/articles/PMC7888997/]
- 64. ThermoAlign: a genome-aware primer design tool for tiled ... [https://www.nature.com/articles/srep44437]
- 65. High-throughput DNA melt measurements enable ... [https://www.nature.com/articles/s41467-025-60455-4]
- 66. A thermodynamic approach to PCR primer design - PMC [https://pmc.ncbi.nlm.nih.gov/articles/PMC2715258/]
- 67. Proven tips for PCR primer design [https://www.neb.com/en-us/nebinspired-blog/proven-tips-for-pcr-primer-design?srsltid=AfmBOoo5-tueyvq_7UDEPBunIuuiMNZTMf3T6Qg-NBhSFOu51myaEoa8]
- 68. Application of in Strategy for silico Design and Selection... PCR Primer [https://scialert.net/fulltext/?doi=biotech.2014.190.195]
- 69. In silico PCR analysis: a comprehensive bioinformatics tool ... [https://www.frontiersin.org/journals/bioinformatics/articles/10.3389/fbinf.2024.1464197/full]
- 70. in silico PCR tool [https://primerdigital.com/tools/epcr.html]
- 71. An In approach for the evaluation of DNA barcodes silico [https://bmcgenomics.biomedcentral.com/articles/10.1186/1471-2164-11-434]
- 72. Comprehensive web- based platform for advanced PCR design... [https://pmc.ncbi.nlm.nih.gov/articles/PMC12506483/]
- 73. design and In of a highly degenerate silico pair... validation primer [https://jgeb.springeropen.com/articles/10.1186/s43141-020-00086-y]
- 74. Analytical Performance of Four Polymerase Chain ... [https://pmc.ncbi.nlm.nih.gov/articles/PMC5632848/]
- 75. Development and clinical validation of a novel multiplex ... [https://www.nature.com/articles/s41598-025-16434-2]
- 76. Determination of limit of detection (LOD) for loop-mediated ... [https://www.sciencedirect.com/science/article/abs/pii/S0732889324003924]
- 77. Development of PCR, qPCR and LAMP methods for the ... [https://pmc.ncbi.nlm.nih.gov/articles/PMC12508883/]
- 78. Next Generation Sequencing Improves Diagnostic 16S ... [https://pmc.ncbi.nlm.nih.gov/articles/PMC12418051/]
- 79. Microbiological culture versus 16S/18S rRNA gene PCR ... [https://www.frontiersin.org/journals/medicine/articles/10.3389/fmed.2024.1393832/full]
- 80. Rapid and reliable species-level identification from clinical ... [https://www.nature.com/articles/s41598-025-14071-3]
- 81. 16S Ribosomal RNA Gene PCR and Sequencing ... [https://wwwnc.cdc.gov/eid/article/31/13/24-1101_article]
- 82. Full-length 16S rRNA gene sequencing by PacBio improves ... [https://bmcgenomics.biomedcentral.com/articles/10.1186/s12864-024-10213-5]
- 83. Performance of 16S rRNA Gene Next-Generation ... [https://pmc.ncbi.nlm.nih.gov/articles/PMC11240331/]
- 84. Comparison of bacterial culture and 16S rRNA ... [https://pmc.ncbi.nlm.nih.gov/articles/PMC4228914/]
- 85. A systematic algorithm using 16S ribosomal RNA for ... [https://www.nature.com/articles/s41598-025-14841-z]
- 86. PCR Primer Design for 16S rRNAs for Experimental ... [https://www.frontiersin.org/journals/bioengineering-and-biotechnology/articles/10.3389/fbioe.2017.00014/full]
- 87. Application of Comparative Genomics for the Development ... [https://www.mdpi.com/2304-8158/14/6/1060]
- 88. Comparative genomic analyses reveal different genetic ... [https://www.nature.com/articles/s41467-025-62850-3]
- 89. Comprehensive IAC Cross-Reactivity Validation and ... [https://www.mdpi.com/2304-8158/14/23/4102]
- 90. Comprehensive genomic analysis reveals virulence and ... [https://www.nature.com/articles/s41598-025-06655-w]
- 91. Environmental screening through nanopore native ... [https://www.sciencedirect.com/science/article/pii/S2351989425001180]
- 92. Development and comparative validation of genomic ... [https://pmc.ncbi.nlm.nih.gov/articles/PMC7528614/]
- 93. Sensitive and specific detection of Xanthomonas ... [https://pubmed.ncbi.nlm.nih.gov/16427518/]