A Comprehensive Guide to Denaturing Gradient Gel Electrophoresis (DGGE): Principles, Protocols, and Applications in Biomedical Research
This article provides a comprehensive guide to Denaturing Gradient Gel Electrophoresis (DGGE), a powerful molecular fingerprinting technique widely used for analyzing microbial community composition and detecting genetic mutations.
A Comprehensive Guide to Denaturing Gradient Gel Electrophoresis (DGGE): Principles, Protocols, and Applications in Biomedical Research
Abstract
This article provides a comprehensive guide to Denaturing Gradient Gel Electrophoresis (DGGE), a powerful molecular fingerprinting technique widely used for analyzing microbial community composition and detecting genetic mutations. Tailored for researchers, scientists, and drug development professionals, it covers foundational principles from DNA melting behavior to GC-clamp mechanics, detailed step-by-step protocols for various applications from clinical diagnostics to environmental monitoring, essential troubleshooting and optimization strategies to overcome common pitfalls, and critical validation methods comparing DGGE with next-generation sequencing technologies. The content synthesizes current methodologies with practical insights to enable effective implementation across diverse research settings.
Understanding DGGE Fundamentals: From Melting Domains to Community Fingerprinting
Denaturing Gradient Gel Electrophoresis (DGGE) is a powerful molecular fingerprinting technique that separates polymerase chain reaction (PCR)-generated DNA fragments based on their sequence-specific melting properties, rather than their size [1]. This method is founded on the principle that the electrophoretic mobility of a partially melted double-stranded DNA molecule is significantly reduced in a polyacrylamide gel compared to its fully helical form [2]. The melting behavior of a DNA duplex is determined by its nucleotide sequence, particularly by the hydrogen bonds between base pairs; guanine-cytosine (GC) rich regions denature at higher denaturant concentrations compared to adenine-thymine (AT) rich regions [1] [3]. When a DNA fragment migrates through a linearly increasing gradient of denaturants (typically a mixture of urea and formamide), it eventually reaches a concentration where the melting temperature (Tm) of its lowest melting domain is reached. At this threshold, the DNA fragment undergoes partial denaturation, forming a branched structure that dramatically impedes its progress through the gel matrix [1] [3]. Since different DNA sequences possess distinct melting domains and consequently different melting temperatures, this process allows for the separation of fragments of identical length but differing sequences, enabling the detection of single-nucleotide polymorphisms [2] [1].
A critical innovation that ensures virtually 100% mutation detection efficiency in DGGE is the use of a GC-clamp [2] [1]. This involves attaching a 30-50 base pair long, GC-rich sequence to one end of the PCR amplicon via one of the amplification primers. This artificially created high-melting domain prevents the complete strand separation of the DNA fragment, which would otherwise result in the molecule running off the gel. The GC-clamp ensures that the fragment remains partially branched and trapped in the gel, allowing for the separation to be based on the melting of the target sequence alone [1]. The sensitivity of the technique is further enhanced by a heteroduplexing step, often incorporated at the end of the PCR amplification. For a sample with a heterozygous mutation, this process generates two homoduplexes (wild-type and mutant) and two heteroduplexes (each containing one wild-type and one mutant strand). Heteroduplexes, due to their mismatched base pairs, melt earlier and are thus easily distinguishable from homoduplex molecules, providing multiple indicators for a single sequence variation [1].
Application Notes
DGGE has been successfully adapted for a wide array of applications beyond its initial development, demonstrating remarkable versatility in molecular research and diagnostics.
Analysis of Microbial Communities
DGGE has become a cornerstone technique in microbial ecology for profiling complex bacterial and eukaryotic communities without the need for cultivation [4] [3]. By using primers targeting the 16S rRNA gene for bacteria or the 18S rRNA gene for eukaryotes, researchers can generate a fingerprint of a microbial community, where each band in the gel theoretically represents a different operational taxonomic unit (OTU) [1] [5]. This allows for the rapid comparison of microbial diversity across different environmental samples, such as water [4] [5], soil [6], and food products [3]. For instance, this method has been used to study the seasonal cycle of bacterioplankton in coastal waters [4] and to analyze the dynamics of picoeukaryotes in the Mediterranean Sea [5]. The banding patterns can be analyzed with software like Quantity One (Bio-Rad) to calculate diversity indices and construct similarity dendrograms, providing insights into community structure and dynamics [7] [4]. Furthermore, dominant bands can be excised from the gel, re-amplified, and sequenced for phylogenetic identification, bridging the gap between community fingerprinting and taxonomic classification [7] [5].
Detection of Viral and Pathogen Variants
The high sensitivity of DGGE to single-nucleotide changes makes it a valuable tool for differentiating between closely related pathogenic strains and viral variants. A notable application is in the diagnosis and study of Infectious Salmon Anemia (ISA) virus, a devastating pathogen in the salmon farming industry [2]. The ISA virus possesses highly mutable regions directly linked to its pathogenicity, specifically a Highly Polymorphic Region (HPR) in segment 6 and an insertion hot spot in segment 5. Researchers have developed DGGE assays that can distinguish between different HPR variants, including the highly virulent HPR7b strain, and can detect single-nucleotide differences associated with insertion events in segment 5 [2]. This adaptation of DGGE provides a fast and reliable alternative to sequencing for scanning field samples, enabling critical decision-making for disease control. Similarly, DGGE has been applied for mutation analysis in bacterial pathogens like Mycobacterium avium subsp. paratuberculosis and for differentiating between various Fusarium species in food safety controls [3].
Ecotoxicology and Bioindication
DGGE serves as an efficient diagnostic tool in ecotoxicology for monitoring the impact of environmental stressors on specific microbial groups. Ciliates, a group of protozoa, are considered excellent bioindicators due to their ubiquity and sensitivity to pollutants. A specific, semi-nested DGGE protocol targeting the 18S rRNA gene of ciliates was developed to monitor community shifts in a soil polluted with polycyclic aromatic hydrocarbons (PAHs) [6]. This method successfully distinguished the ciliate community profiles of PAH-polluted soil from those of a non-polluted control soil. Subsequent sequencing of excised DGGE bands revealed that the polluted soil was dominated by ciliates belonging to the class Colpodea, providing a concrete example of how pollution can select for specific taxonomic groups [6]. This molecular approach simplifies and accelerates ecotoxicological studies by circumventing the labor-intensive and expertise-dependent process of morphological identification.
Table 1: Key Applications of DGGE Across Different Fields
| Field of Application | Specific Use Case | Target Gene/Marker | Key Finding/Utility |
|---|---|---|---|
| Microbial Ecology | Analysis of bacterioplankton seasonality [4] | 16S rRNA (e.g., 357fGC-907rM) | Primer set 357fGC-907rM effectively grouped samples according to seasons. |
| Microbial Ecology | Diversity of marine picoeukaryotes [5] | 18S rRNA | Revealed significant differences in community composition with depth; prasinophytes dominated surface samples. |
| Viral Diagnostics | Genotyping of Infectious Salmon Anemia Virus (ISAv) [2] | Segments 5 & 6 of the ISAv genome | Enabled differentiation of HPR variants and detection of insertions linked to virulence. |
| Ecotoxicology | Impact of PAH pollution on soil ciliates [6] | 18S rRNA (ciliate-specific) | Distinguished community profiles between polluted and pristine soils; identified Colpodea as dominant in polluted soil. |
| Food Microbiology | Characterization of microbial communities in milk and dairy products [3] | 16S rRNA | Used to evaluate microbial diversity, though largely replaced by microbiome sequencing in recent years. |
Experimental Protocols
Protocol 1: DGGE Analysis of Soil Bacterial Communities
This protocol, adapted from a study on rhizosphere and bulk soil bacteria, outlines the core steps for DGGE fingerprinting [7].
A. PCR Amplification
- Primers: Use primers 341F (with a GC-clamp attached to the 5'-end) and 518R to amplify the V3 region of the bacterial 16S rRNA gene [7] [4].
- Reaction Setup: Set up standard PCR mixtures. The use of a GC-clamp on one primer is mandatory for effective separation in DGGE [1].
- Cycling Conditions: Perform amplification according to established protocols. A final heteroduplexing step (e.g., a final denaturation at 94°C for 5 min, followed by reannealing at 65°C for 15 min) is recommended to enhance mutation detection [1].
B. DGGE Electrophoresis
- Gel Preparation: Prepare an 8% (w/v) polyacrylamide gel with a denaturing gradient. A gradient of 40–70% is used (where 100% denaturant is defined as 7 M urea and 40% (v/v) formamide) [7].
- Loading and Running: Load similar amounts of PCR products (e.g., 900 ng) into the wells [4]. Perform electrophoresis in 1X TAE buffer using the DCode Universal Mutation Detection System (Bio-Rad) at a constant voltage of 180 V for 6 h [7]. The gel should be maintained at a constant temperature of 60°C [1].
C. Gel Staining and Analysis
- After electrophoresis, stain the gel with an appropriate DNA stain such as ethidium bromide, SYBR Green I, or silver stain [3].
- Digitize the gel image and analyze it using fingerprint analysis software such as Quantity One (Bio-Rad) [7] [4].
- Identify bands occupying the same position across different lanes. A similarity matrix can be constructed based on band presence/absence or relative intensity, and dendrograms can be generated using algorithms like UPGMA (Unweighted Pair Group Method with Arithmetic Mean) to cluster community profiles [7].
D. Sequencing of Bands
- Excise bands of interest from the gel carefully.
- Elute the DNA and re-amplify it using the original primers (without the GC-clamp for the forward primer).
- Clone the purified PCR products into a suitable vector (e.g., pMD19-T Simple Vector) and transform into competent E. coli cells [7].
- Screen positive clones and verify their conformation by DGGE. Select the correct clone for sequencing.
- Analyze the obtained sequences using tools like BLAST and construct phylogenetic trees using software such as MEGA [7].
Table 2: Key Reagents and Equipment for DGGE Analysis
| Category | Item | Function/Description | Example/Specification |
|---|---|---|---|
| Core Equipment | DGGE Electrophoresis System | Houses the gel and provides controlled electrophoresis conditions. | DCode Universal Mutation Detection System (Bio-Rad) [7] |
| Gradient Former | Creates the linear denaturant gradient in the polyacrylamide gel. | - | |
| Critical Reagents | Denaturants | Cause sequence-dependent denaturation of DNA duplexes. | Urea (7 M) and Formamide (40%) define 100% denaturant [7] [1] |
| Polyacrylamide | Forms the gel matrix for separation. | Typically 6-8% concentration [7] [4] | |
| Primers with GC-clamp | Amplify target region; GC-clamp prevents complete strand separation. | e.g., 341F-GC, 40-nucleotide GC-rich sequence at 5'-end [7] [1] | |
| Analysis Tools | Gel Analysis Software | Digitizes and analyzes DGGE banding patterns. | Quantity One Software (Bio-Rad) [7] [4] |
| Cloning Vector | Allows for the propagation of excised DNA bands for sequencing. | pMD19-T Simple Vector (TaKaRa) [7] |
Protocol 2: DGGE for Viral Genotyping (ISAv)
This protocol is adapted from the work on Infectious Salmon Anemia Virus (ISAv) and highlights the customization needed for specific targets [2].
A. Primer Design and Selection
- Design primers flanking the variable region of interest (e.g., the HPR in segment 6 or the insertion hot spot in segment 5).
- Selection of the primer set is based on three key features: 1) notable differences in %GC content in the resulting amplicons, 2) high specificity, and 3) single-band resolution in conventional agarose gel electrophoresis [2].
- The selected primers must be synthesized with a GC-clamp attached to the 5'-end of one primer.
B. Optimization of DGGE Conditions
- Perpendicular DGGE: Initially, run a perpendicular DGGE (where the denaturing gradient is perpendicular to the direction of electrophoresis) with a broad denaturant range (e.g., 0-80%) to determine the optimal range for the specific amplicons [4].
- Fine-Tuning: Based on perpendicular DGGE, establish a narrower, parallel denaturing gradient that provides the best resolution. For ISAv segment 6, this was determined to be a specific gradient that resolved HPR0, HPR2, HPR5, HPR7b, and HPR8 variants [2].
- Other pivotal conditions to optimize include the acrylamide percentage and the primer-to-template ratio in the PCR to avoid the formation of artifactual bands [2].
C. Parallel DGGE Analysis
- Once conditions are optimized, run all test and reference samples on a parallel DGGE gel with the established denaturing gradient.
- Visualize the banding patterns. Different variants will be represented by bands at distinct positions in the gel. The presence of heteroduplex bands (which run lower than homoduplexes) confirms sequence heterogeneity within a sample [2] [1].
The Scientist's Toolkit
Successful implementation of DGGE relies on a set of well-defined reagents and tools. The following table catalogs essential solutions and their functions based on the cited protocols.
Table 3: Essential Research Reagent Solutions for DGGE
| Reagent / Solution | Function / Purpose | Example Composition / Notes |
|---|---|---|
| Denaturing Stock Solution (100%) | Creates the chemical gradient that induces DNA melting. | 7 M Urea, 40% (v/v) Formamide in 1X TAE buffer [7] [1]. |
| Polyacrylamide Gel Solution | Forms the sieving matrix for electrophoresis. | Typically 6-8% acrylamide/bis-acrylamide in 1X TAE, with varying denaturant concentrations [7] [4]. |
| Primer Sets with GC-Clamp | Amplifies the target DNA region and ensures partial denaturation. | A 40-nucleotide GC-rich sequence (GC-clamp) is attached to the 5'-end of one primer [1]. Examples: 341F-GC/518R for bacteria [7]. |
| TAE Electrophoresis Buffer | Provides the ionic medium for conducting current during electrophoresis. | Tris-acetate-EDTA buffer, typically used at 1X concentration [7]. |
| DNA Staining Solution | Visualizes separated DNA bands after electrophoresis. | SYBR Green I, ethidium bromide, or silver stain are commonly used [3]. |
| Lysis Buffer for Nucleic Acid Extraction | Breaks down cell walls and membranes to release DNA. | Often contains EDTA, Tris-HCl, and sucrose (e.g., 40 mM EDTA, 50 mM Tris-HCl, 0.75 M sucrose) [5]. |
| Cloning and Sequencing Kit | Facilitates the identification of separated DNA bands. | Includes competent cells (e.g., E. coli DH5α), cloning vector (e.g., pMD19-T), and reagents for transformation and sequencing [7]. |
The Crucial Role of Melting Domains in Fragment Selection
Denaturing Gradient Gel Electrophoresis (DGGE) is a powerful molecular technique used to separate DNA fragments of identical length based on their sequence composition. The core principle governing this separation is the concept of melting domains—stretches of base pairs with nearly identical melting temperatures (Tm). During DGGE analysis, the electrophoretic mobility of a double-stranded DNA molecule drastically decreases once its lowest-temperature melting domain reaches its Tm and undergoes partial denaturation in the gel. Sequence variations within these domains, even single-nucleotide polymorphisms, alter their melting temperatures, causing molecules to halt at different positions in the denaturing gradient gel and thus enabling separation [3].
The accurate selection of DNA fragments with optimal melting behavior is therefore critical for the success and quantitative reliability of DGGE. Fragments must be designed to exhibit a single, dominant low-melting domain; multiple low-melting domains can lead to complex banding patterns or complete fragment dissociation, complicating analysis and misinterpretation of results. Proper fragment selection, guided by an understanding of melting domain theory, ensures clear, interpretable profiles that accurately reflect the genetic diversity of a sample, whether for microbial community analysis or mutation detection [8] [3] [9].
Theoretical Principles of Melting Domain Analysis
The Fundamentals of DNA Melting in DGGE
In DGGE, separation occurs in a polyacrylamide gel containing a linear gradient of chemical denaturants (urea and formamide). As DNA molecules migrate through this gradient, they remain double-stranded until they encounter a denaturant concentration sufficient to initiate the melting process. Melting begins in the lowest-temperature melting domain, causing the DNA molecule to partially unwind and form a branched structure. This partial melting dramatically reduces the molecule's mobility through the gel matrix. The specific denaturant concentration at which this halt occurs is uniquely determined by the nucleotide sequence of the fragment's melting domains [3].
The connection between sequence composition and melting behavior is direct. G-C base pairs, stabilized by three hydrogen bonds, contribute more to a domain's stability and Tm than A-T base pairs, which are held together by only two hydrogen bonds. Consequently, the location, number, and stability of melting domains within a DNA fragment are dictated by its primary sequence. A well-designed fragment for DGGE will have a single, cooperative melting domain that transitions sharply from helical to branched structure, ensuring a discrete band on the gel [3].
The Critical Role of the GC Clamp
A fundamental innovation in DGGE is the use of an artificial, high-temperature melting domain known as a GC clamp. This is a 30-40 base pair sequence, rich in guanine and cytosine nucleotides, which is attached to one end of the PCR-amplified fragment via a primer during amplification [10].
The function of the GC clamp is to prevent complete strand dissociation of the DNA fragment. When a fragment without a GC clamp reaches the denaturant concentration that melts its lowest domain, it typically continues to melt fully, leading to strand separation and the loss of the distinct band. The GC clamp, with its very high Tm, acts as a stable anchor, remaining double-stranded and ensuring that the fragment only partially melts. This results in a sharp, well-defined band on the gel, significantly enhancing the sensitivity and resolution of the technique, enabling the detection of single-base changes [10].
Practical Protocol for Fragment Selection and Analysis
This section provides a detailed, step-by-step protocol for selecting and analyzing DNA fragments for DGGE, with a focus on predicting and optimizing their melting behavior.
In Silico Fragment Selection and Melting Profile Prediction
Step 1: Target Region Amplification and GC Clamp Attachment
- Amplify the target genomic region of interest (e.g., the V3 region of the 16S rRNA gene for microbial diversity studies) via PCR [5] [10].
- One PCR primer must be synthesized with a 40-nucleotide GC-rich sequence (5'-CGCCCGCCGCGCCCCGCGCCCGTCCCGCCGCCCCCGCCCG-3') at its 5' end. This will be incorporated into the amplicon, creating the GC clamp [10].
Step 2: Melting Profile Simulation
- Use specialized software (e.g., MeltProf, POLAND) to simulate the melting profile of the amplified fragment, including the GC clamp.
- The software calculates the probability of base-pair opening along the sequence at increasing denaturant concentrations or temperatures.
- Analyze the output graph for a single, dominant transition corresponding to one low-melting domain. Avoid fragments that predict multiple significant transitions, as they will produce diffuse or multiple bands.
Step 3: Experimental Validation of Predicted Melting Behavior
- If the in-silico profile is satisfactory, proceed with DGGE.
- Load the PCR product onto a denaturing gradient gel. A well-designed fragment will produce a single, sharp band. The presence of smears or multiple bands suggests suboptimal melting behavior, requiring fragment re-design.
DGGE Experimental Procedure
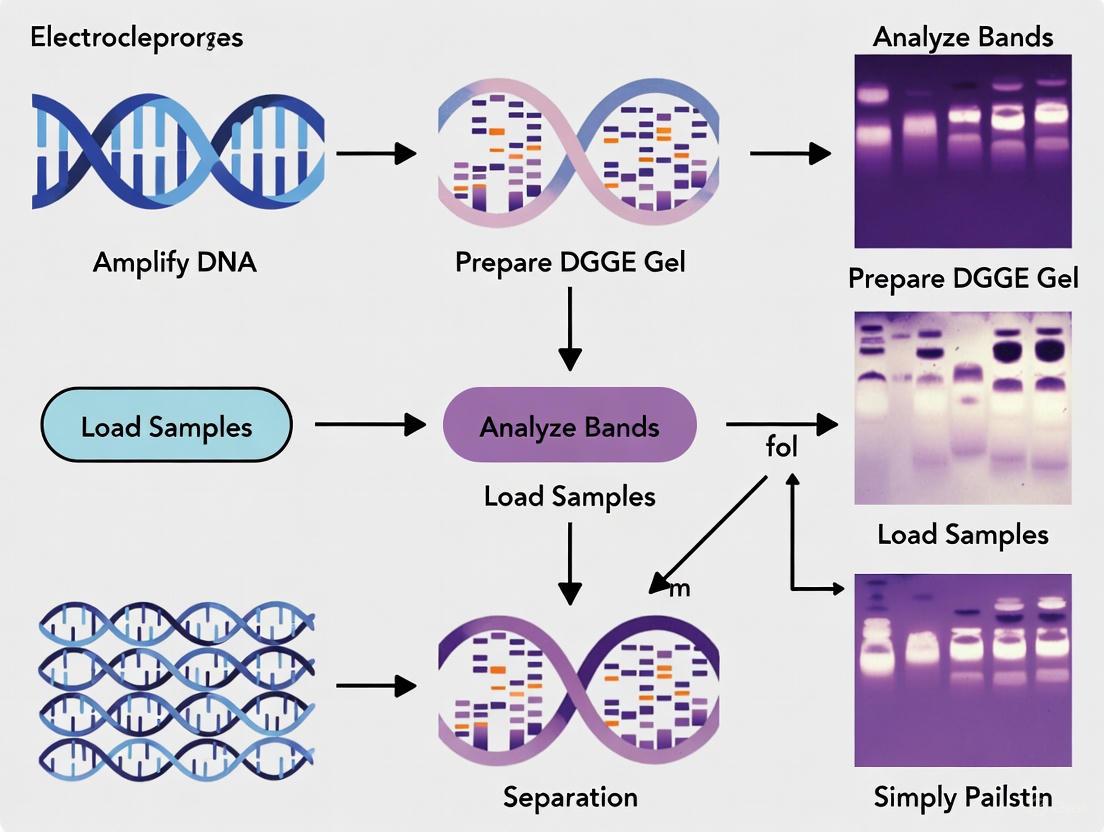
The following workflow visualizes the key experimental steps from fragment preparation to analysis.
Materials and Reagents:
- Polyacrylamide Gel Solution: Typically 6-8% acrylamide/bis-acrylamide (37.5:1 ratio) [8].
- Denaturant Stock Solution: 100% denaturant is defined as 7 M urea and 40% (v/v) formamide [3] [10].
- Electrophoresis Buffer: Usually 1x TAE (Tris-Acetate-EDTA).
- Staining Solution: SYBR Green I, ethidium bromide, or silver stain [3].
Procedure:
- Gel Preparation: Create a polyacrylamide gel with a linear denaturant gradient (e.g., 30% to 60%). Use a gradient-forming apparatus to ensure a smooth and reproducible gradient. The gel must be polymerized completely before use.
- Sample Loading: Mix the GC-clamped PCR product with a loading dye and load into the wells.
- Electrophoresis: Run the gel in a heated water bath (e.g., 60°C) at a constant voltage (e.g., 130 V for 4-5 hours). The run time must be optimized so that fragments have sufficient time to reach their specific melting points.
- Post-Electrophoresis Analysis:
- Staining: Carefully stain the gel with SYBR Green I (diluted 1:10,000 in 1x TAE buffer) for 20-30 minutes with gentle agitation.
- Visualization: Image the gel under UV light. Each distinct band represents a unique sequence variant or operational taxonomic unit (OTU) in the community [3] [5].
- Band Excision: Using a sterile blade, excise bands of interest.
- Elution and Re-amplification: Elute DNA from the gel slice and re-amplify it using the original primers (without the GC clamp for the reverse primer).
- Sequencing: Purify the PCR product and submit it for Sanger sequencing to identify the specific sequence [5] [10].
Quantitative Data and Optimization Strategies
The relationship between melting domain properties and DGGE band intensity is quantifiable. Ahn et al. demonstrated that the relative band intensities of 16S rDNA templates were closely correlated with the differences in melting temperature (ΔTm) between the higher and lower melting domains of the PCR products [8]. This quantitative relationship underscores the need for careful optimization of several parameters to ensure that band intensity accurately reflects the initial abundance of the template.
Table 1: Key Parameters for Optimizing Quantitative DGGE Analysis
| Parameter | Optimization Guideline | Impact on Melting Domain Analysis and Band Quality |
|---|---|---|
| dNTP Concentration | Optimize concentration (e.g., 200 μM) [8] [5] | Prevents PCR bias and ensures balanced amplification of all templates, leading to accurate band intensities. |
| DNA Polymerase | Use high-fidelity polymerase | Reduces PCR errors that could create spurious melting domains and false bands. |
| PCR Cycle Number | Determine the inflection point via real-time PCR; use the minimum number of cycles prior to plateau [8] | Prevents over-amplification and saturation, which can distort quantitative representation based on melting behavior. |
| Acrylamide/Bis Concentration | Optimize concentration (e.g., 6-8%) [8] | Affects gel porosity and resolution, influencing the sharpness of bands derived from partially melted domains. |
| Primer Design | Use primer sets that minimize mismatch and evenly amplify templates [8] | Ensures that the melting profile observed is representative of the true community structure, not an amplification artifact. |
The use of real-time PCR to identify the inflection point of amplification is particularly crucial for quantitative work. Performing PCR beyond this point leads to over-amplification where DNA templates are amplified to a saturated level independently of their initial amounts, thereby distorting the quantitative data derived from band intensities in the DGGE gel [8].
The Scientist's Toolkit: Essential Reagents for DGGE
Successful implementation of a DGGE protocol reliant on controlled melting domain behavior requires a specific set of research reagents.
Table 2: Essential Research Reagent Solutions for DGGE
| Research Reagent | Function and Importance in DGGE |
|---|---|
| GC-clamped Primers | Synthetic oligonucleotides with a 5' 40-bp GC-rich tail. Critical for creating an artificial high-temperature melting domain to prevent complete strand dissociation and ensure sharp band formation [10]. |
| Urea-Formamide Denaturants | A 100% denaturant solution is 7 M urea and 40% (v/v) formamide. Creates the chemical environment that induces sequence-dependent DNA melting within the gel, enabling separation based on melting domain stability [3] [10]. |
| Acrylamide/Bis-acrylamide | Forms the cross-linked polyacrylamide gel matrix. The pore size (determined by concentration) is vital for resolving partially melted DNA fragments based on their size and shape [8]. |
| SYBR Green I / Ethidium Bromide | Nucleic acid staining solutions. Used for post-electrophoresis visualization of DNA bands resulting from halted migration at specific melting points [3]. |
| High-Fidelity Taq Polymerase | Enzyme for PCR amplification. Minimizes incorporation of errors during amplification, which could otherwise create artifactual melting domains and complicate the fingerprint profile [8]. |
The selection of DNA fragments based on their melting domains is not merely a technical step but a foundational concept that dictates the success of DGGE. A deep understanding of how sequence composition dictates melting behavior, combined with the strategic application of a GC clamp and careful optimization of reaction parameters, allows researchers to transform DGGE from a simple fingerprinting technique into a powerful, semi-quantitative tool. By adhering to the protocols and principles outlined in this application note, scientists and drug development professionals can reliably profile complex microbial communities or detect subtle genetic mutations with enhanced accuracy and confidence.
In denaturing gradient gel electrophoresis (DGGE), the GC-clamp is an indispensable tool that enables the high-resolution separation of DNA fragments based on sequence composition rather than mere size. This application note details the fundamental mechanics by which a GC-rich sequence, attached to a PCR amplicon, prevents complete strand dissociation under denaturing conditions. By creating a high-melting-temperature domain, the clamp ensures that DNA molecules undergo partial, sequence-dependent denaturation, halting their migration at distinct positions in a denaturing gradient gel. We provide a comprehensive protocol for integrating GC-clamps into DGGE assays, supported by data on melting behavior and a curated list of essential reagents. This framework is critical for applications ranging from microbial ecology to mutation detection in genetic screening, ensuring researchers can leverage the full analytical power of DGGE.
Denaturing Gradient Gel Electrophoresis (DGGE) is a powerful electrophoretic technique that separates PCR-amplified DNA fragments of identical length based on their unique base-pair sequences [1]. The method hinges on the principle that double-stranded DNA (dsDNA) begins to denature, or "melt," in discrete domains when subjected to a gradient of chemical denaturants (typically urea and formamide) or heat. This domain-based melting is sequence-specific; even a single-nucleotide polymorphism can alter a domain's melting temperature (Tm) [1].
The GC-clamp is the crucial innovation that makes this sequence-based separation possible. Without it, a DNA fragment reaching its Tm would denature completely, dissociating into single strands and failing to resolve meaningfully. The GC-clamp is a guanine-cytosine (GC)-rich sequence, typically 30 to 50 nucleotides in length, that is attached to the 5' end of one PCR primer during amplification [11] [1]. This artificial domain has an exceptionally high melting temperature, creating a stable anchor that remains double-stranded under conditions where the target fragment's lower-Tm domains melt. This partial melting causes a branched molecule, dramatically reducing its electrophoretic mobility and trapping it at a specific position in the gel [1]. The presence of the clamp thus ensures that DNA fragments are separated based on the melting properties of their target sequence, enabling the detection of subtle genetic variations.
Mechanistic Principles: How the GC-Clamp Functions
The core function of the GC-clamp is to prevent the complete dissociation of DNA strands, a mechanism governed by the thermodynamics of DNA melting. The following diagram illustrates this process and its role within a full DGGE workflow.
DNA Melting Domains and the GC-Clamp Anchor
DNA does not melt uniformly. A given fragment comprises multiple melting domains, each a stretch of 50-300 base pairs with a characteristic, sequence-dependent Tm [1]. The Tm is primarily determined by the G+C content, as GC base pairs form three hydrogen bonds and are more thermally stable than AT base pairs, which form only two. In a standard DGGE assay, the target DNA fragment is designed, through strategic primer placement, to ideally consist of a single, low-Tm melting domain. The GC-clamp, appended to one end, acts as a second, artificial domain with a Tm that can be ≥8°C higher than the target sequence [12]. As the clamped fragment migrates into the denaturing gradient, the target domain reaches its Tm and begins to denature, while the GC-clamp remains fully base-paired. This creates a partially melted molecule with a forked structure, leading to a sharp decrease in mobility [1]. Fragments with different sequences in the target domain will melt at different denaturant concentrations, resulting in their separation as distinct bands.
Enhancing Detection with Heteroduplex Analysis
The sensitivity of DGGE is significantly boosted by a heteroduplexing step. When a sample contains a heterozygous mutation or a mixture of sequences, PCR amplification produces a pool of wild-type and mutant DNA strands. If the PCR products are subjected to a final cycle of denaturation and slow reannealing, four types of molecules are formed: two homoduplexes (wild-type/wild-type and mutant/mutant) and two heteroduplexes (each containing one wild-type and one mutant strand) [1]. Heteroduplex molecules contain a mismatch at the site of the mutation, which destabilizes the duplex and significantly lowers its Tm. Consequently, heteroduplexes will melt earlier and migrate to a different position in the gel than the corresponding homoduplexes, often appearing as fainter, lower bands [1]. This phenomenon provides a clear visual indicator of heterogeneity within a sample and increases the likelihood of detecting minor sequence variants.
Essential Reagents and Research Solutions
Successful implementation of a GC-clamp DGGE protocol requires a specific set of reagents and equipment. The following table catalogs the key components and their functions.
Table 1: Key Research Reagent Solutions for GC-Clamp DGGE
| Reagent/Equipment | Function and Specification |
|---|---|
| GC-Clamped Primers | Synthetic oligonucleotides with a 30-50 nt G+C-rich sequence (e.g., 5'-CGC CCG CCG CGC CCC GCG CCC GTC CCG CCG CCC CCG CCG-3') at the 5' end [11]. Creates the high-Tm anchor domain. |
| Chemical Denaturants | A mixture of urea (0-7 M) and formamide (0%-40%) [1] [10]. Disrupts hydrogen bonding between DNA strands to create the denaturing gradient. |
| Polyacrylamide Gel | Matrix for electrophoresis. Typically 6-12% acrylamide with a parallel gradient of denaturants [7] [10]. |
| DNA Polymerase | Thermostable enzyme for PCR amplification (e.g., Pfu polymerase [11] or Red Taq [12]). Must be capable of efficiently amplifying from GC-clamped primers. |
| Electrophoresis System | A specialized tank capable of maintaining a constant temperature (often 60°C) during extended runs (e.g., DCode Universal Mutation Detection System) [7]. |
| Gel Analysis Software | Software for analyzing banding patterns and intensity (e.g., Quantity One [7]). |
Detailed Application Protocol
This protocol outlines the key steps for implementing DGGE with a GC-clamp, from primer design to band analysis.
Primer and Amplicon Design
The initial design phase is critical for assay success.
- GC-Clamp Sequence: Incorporate a 30 to 50 nucleotide GC-rich sequence at the 5' end of one PCR primer. A common and effective 40-base clamp is
5'-CGC CCG CCG CGC CCC GCG CCC GTC CCG CCG CCC CCG CCG-3'[11]. - Target Amplicon: The target sequence should be between 200-700 bp for optimal separation [1]. Using software (e.g., MacMelt, MeltMap), analyze the melt profile of the target region. The goal is to design an amplicon that, with the attached GC-clamp, behaves as a single melting domain or has one distinct, low-Tm domain that melts while the clamp remains intact [12] [1].
PCR Amplification and Heteroduplex Formation
- PCR Setup: Perform PCR amplification using the GC-clamped primer pair and appropriate template DNA. A proof-reading polymerase like Pfu is recommended for high fidelity [11].
- Cycling Conditions: A typical protocol includes an initial denaturation (e.g., 95°C for 3 min), followed by 35 cycles of denaturation (94°C for 30 s), primer annealing (50-60°C for 30 s), and extension (72°C for 30 s), concluding with a final extension (72°C for 5 min) [12] [11].
- Heteroduplex Formation: To enhance mutation detection, include a heteroduplex formation step after PCR. Heat the PCR products to 95°C for 5 minutes, then slowly cool to room temperature over 45-60 minutes [11]. This promotes the formation of both homoduplex and heteroduplex molecules.
DGGE Gel Electrophoresis and Analysis
- Gel Preparation: Prepare a 6-12% polyacrylamide gel containing a linear gradient of denaturants. The gradient range (e.g., 40%-70% denaturant, where 100% is 7 M urea and 40% formamide) must be optimized for the specific target [7] [1].
- Electrophoresis: Load equal amounts of PCR product into the gel wells. Conduct electrophoresis in a temperature-controlled tank (e.g., 60°C) at a constant voltage (e.g., 180 V for 6 hours) [7]. The optimal temperature is the highest at which the target sequence is predicted to be >90% double-stranded [12].
- Post-Staining and Analysis: After electrophoresis, stain the gel with a fluorescent DNA dye (e.g., SYBR Green, EvaGreen) and visualize the banding pattern. Use software like Quantity One for analysis [7]. Bands of interest can be excised, eluted, re-amplified, and sequenced for identification [7] [10].
Quantitative Data and Performance Metrics
The performance of a GC-clamp in DGGE can be quantified by its impact on melting behavior and detection sensitivity. The following table summarizes key experimental parameters and outcomes from selected studies.
Table 2: Quantitative Data on GC-Clamp Performance in DGGE Assays
| Target / Application | GC-Clamp Length / Sequence | Key Melting & Separation Parameters | Reported Outcome / Sensitivity |
|---|---|---|---|
| Mutation Detection (DHPLC) [12] | 20 bp or 36 bp | Tm of clamp ≥8°C above target domain; Assay temp at highest point where target is >90% ds. | Facilitated mutation detection in RET, Col1a2, and FAS genes; not detectable without clamp. |
| mtDNA Heteroplasmy Detection [11] | 40-nt (e.g., CGC CCG CCG...) |
DGGE capable of detecting heteroplasmic proportions as low as 1%; reliable detection when minor component ≥5%. | Heteroplasmy observed in 13.8% (35 of 253) of individuals. |
| Bacterial Community Analysis [7] | Attached to primer 341F | Denaturing gradient: 40-70%; Electrophoresis: 180 V for 6 h. | Enabled profiling of rhizosphere vs. bulk soil communities; bands sequenced for phylogeny. |
| l-DNA Aptamer Selection [13] | Integrated into workflow | Used DGGE to isolate enriched l-DNA aptamers based on melting temperature differences. | Successfully isolated a rare sequence (~0.8% abundance) to ~45% purity post-DGGE. |
Troubleshooting and Technical Considerations
- Poor Band Resolution: This can result from a suboptimal denaturing gradient range or an amplicon with multiple melting domains. Re-analyze the melt profile and adjust primer positions to create a single, dominant melting domain below the clamp [1].
- No Band Formation or Smearing: Inefficient PCR with the GC-clamped primer is a common cause. Ensure the polymerase is suitable for amplifying GC-rich templates. Verify that the heteroduplexing step was performed correctly [11].
- Artifactual Bands: These can arise from non-specific PCR amplification or overloading of the gel. Optimize PCR conditions and titrate the amount of loaded product.
The GC-clamp is a foundational element that unlocks the full potential of DGGE, transforming it from a simple separation technique into a powerful tool for resolving complex genetic mixtures. Its mechanics—preventing complete strand dissociation to facilitate separation based on subtle differences in DNA sequence thermodynamics—are elegantly simple yet profoundly effective. As detailed in this application note, the careful design of clamped primers, optimization of denaturing conditions, and incorporation of a heteroduplexing step are all critical for achieving maximal sensitivity. When executed precisely, the GC-clamp DGGE protocol provides researchers and drug development professionals with a robust method for applications as diverse as profiling microbial ecosystems, scanning for pathogenic mutations, and selecting novel biostable aptamers.
Denaturing Gradient Gel Electrophoresis (DGGE) and Temperature Gradient Gel Electrophoresis (TGGE) are powerful electrophoretic techniques used to separate DNA, RNA, or protein molecules based on sequence-dependent differences in their melting behavior. Both methods resolve molecules of identical length by exploiting the fact that double-stranded DNA (dsDNA) denatures in discrete regions called melting domains as denaturing conditions increase. This partial melting dramatically reduces the molecule's migration rate in a polyacrylamide gel. Since the denaturation temperature of each domain is sequence-dependent (influenced by GC content and nucleotide order), these techniques can detect single-base variations, making them invaluable for genetic analysis, microbial ecology, and mutation detection [14].
The fundamental difference between the techniques lies in the denaturing agent: DGGE uses a linear chemical gradient of urea and formamide, while TGGE employs a linear temperature gradient across the gel. This distinction leads to differences in ease of use, reproducibility, and application suitability [15] [14]. This article provides a detailed comparison of DGGE and TGGE, including protocols and application notes for researchers in molecular biology and drug development.
Principle of Operation
Core Mechanism
In both DGGE and TGGE, the underlying principle is the electrophoretic separation of biomolecules based on their differential denaturation under a gradient. When dsDNA is subjected to an increasing denaturing environment, it begins to "melt" at its least stable domains. A GC-clamp (a 30-40 bp GC-rich sequence attached to one PCR primer) is often used to prevent complete strand dissociation, ensuring that the partially melted molecules remain trapped in the gel matrix at distinct positions [15] [10] [16].
Comparative Workflows
The following diagram illustrates the core procedural steps and key differences between the DGGE and TGGE workflows.
Comparative Analysis: DGGE vs. TGGE
Technical and Performance Comparison
A direct comparative study of DGGE and TGGE for identifying Candida species revealed critical operational differences and performance metrics, summarized in the table below [15].
| Parameter | DGGE | TGGE |
|---|---|---|
| Denaturing Agent | Chemical gradient (Urea + Formamide) [15] [14] | Temperature gradient [15] [14] |
| Gradient Preparation | Complex; requires gradient-forming apparatus [14] | Simpler; no chemical gradient to pour [14] |
| Reproducibility | Can be less reproducible [14] | Highly reproducible [15] [14] |
| Operational Cost | Lower chemical costs, higher labor [15] | Higher equipment cost, lower runtime labor [15] |
| Recommended Primer Set | NL1-GC / LS2 [15] | NL1-GC / LS2 [15] |
| Run Conditions (for NL1-GC/LS2) | 30-45% denaturant, 130V, 4.5 hrs, 60°C [15] | 65V, 10h 42min, Temp. gradient 51.5°C to 62.2°C [15] |
| Ease of Performance | More complex setup and execution [15] | Easier to perform [15] |
| Overall Recommendation | Effective but less favored for routine use [15] | Recommended due to easier performance and lower costs [15] |
Advantages and Limitations
- DGGE Advantages: Well-established methodology; capable of high-resolution analysis of microbial communities [10] [17].
- DGGE Limitations: Chemical gradients are difficult to establish and reproduce; residual chemicals require special disposal [14].
- TGGE Advantages: Temperature gradients are more reproducible and easier to fine-tune; no hazardous chemical waste [14] [16].
- TGGE Limitations: Requires specialized and often more expensive equipment to create a uniform temperature gradient across the gel [14].
Application Notes
Established Applications
The versatility of DGGE and TGGE is demonstrated by their wide range of applications across biological research and diagnostics.
- Microbial Ecology: DGGE of 16S rRNA gene fragments is a cornerstone technique for profiling microbial community diversity and dynamics in environments like soil, water, and anaerobic digesters [14] [10]. It allows for simultaneous analysis of multiple samples to monitor community shifts in response to environmental changes [10] [17].
- Mutation Detection and Genetic Analysis: Both techniques can detect single-base changes, insertions, or deletions. Applications include identifying mutations in human genes like p53 in pancreatic secretions and detecting novel mutations in mitochondrial DNA (mtDNA) for diagnosing mitochondrial cytopathies [14].
- Nucleic Acid Folding Studies: TGGE is particularly useful for studying the thermodynamics of RNA and DNA secondary and tertiary structures, including helix-coil transitions and the stability of specific motifs, often in the presence of ions necessary for folding [16].
- Viral and Viroid Analysis: TGGE has been used to analyze sequence variants of dsRNA viruses (e.g., bluetongue virus) and to study the cooperative melting transitions of circular viroid RNA [16].
The Scientist's Toolkit: Essential Reagents and Materials
Successful implementation of DGGE and TGGE protocols requires specific reagents and equipment. The following table lists key solutions and their functions.
| Research Reagent / Material | Function / Application Note |
|---|---|
| Polyacrylamide/Bis-acrylamide Gel (8%) | Standard matrix for separating nucleic acids during electrophoresis [15]. |
| Chemical Denaturants (Urea & Formamide) | Used in DGGE to form the denaturing gradient (e.g., 30-60%); 100% denaturant is 7 M urea and 40% formamide [15] [14]. |
| Primer Set with GC-Clamp | Essential for creating a high-melting-point domain to prevent complete strand dissociation; e.g., NL1-GC/LS2 primer set was most effective for Candida detection [15]. |
| TAE Buffer (1X) | Standard electrophoresis buffer used for running both DGGE and TGGE gels [15]. |
| DNA Stain (Ethidium Bromide/SYBR Gold) | For visualizing separated DNA bands post-electrophoresis [15] [17]. |
| Temperature Gradient Apparatus | Specialized equipment (e.g., from Biometra) required for TGGE to create and maintain a uniform temperature gradient [14]. |
Detailed Experimental Protocols
Protocol A: DGGE for Microbial Community Analysis (e.g., Manure Slurry)
This protocol outlines the steps for analyzing microbial shift in anaerobic digestions, adapted from recent research [10].
5.1.1 Sample Preparation and DNA Extraction
- Sample Collection: Collect environmental samples (e.g., soil, manure, water). For the manure study, samples were incubated anaerobically at different temperatures (28°C, 36°C, 44°C, 52°C) over 60 days [10].
- DNA Extraction: Extract total genomic DNA. For soil/manure, optimize lysis by combining bead beating with freeze-thaw cycles (liquid nitrogen for 2 min, then 60°C water bath for 5 min; repeat 3x) and/or sonication (100W for 5 min) prior to using a commercial kit like ISOIL for Bead Beating [17].
- DNA Quantification: Measure DNA concentration using a UV spectrophotometer [17].
5.1.2 PCR Amplification
- Target Gene: Amplify the variable region (e.g., V3 region of the 16S rRNA gene for bacteria) using GC-clamped primers [10].
- PCR Reaction: Assemble a 50 µL reaction mixture containing:
- 5 µL of 10x PCR buffer
- 1.5 mM MgCl₂
- 0.2 mM dNTPs
- 0.16 mM of each primer
- 1.25 U of DNA Taq polymerase
- ~20 ng of template DNA [15]
- Thermal Cycling:
- Initial denaturation: 95°C for 5 min.
- 35 cycles of: 95°C for 30 s, 58°C for 45 s, 72°C for 1 min.
- Final extension: 72°C for 5 min [15].
- Verification: Check 5 µL of PCR product on a 1% agarose gel [15].
5.1.3 DGGE Analysis
- Gel Preparation: Prepare an 8% polyacrylamide gel with a denaturing gradient (e.g., 30-60%). The 100% denaturant solution is 7 M urea and 40% (v/v) formamide [15] [17].
- Loading and Electrophoresis:
- Post-Staining and Visualization:
Protocol B: TGGE for Mutation Screening (e.g., Candida Species)
This protocol is optimized for the discrimination of closely related species, such as different Candida pathogens [15].
5.2.1 DNA Extraction and PCR
- DNA Source: Culture standard or clinical strains (e.g., on Potato Dextrose Agar for 24 hours at 36°C) [15].
- DNA Extraction: Extract genomic DNA using the phenol-chloroform method or a commercial kit [15].
- PCR with GC-Clamp: Use the primer set NL1-GC/LS2, which targets the D1 region of the 26-28S rRNA gene and yields ~250 bp amplicons well-suited for TGGE [15].
- PCR Mixture: Use a 50 µL reaction with adjusted MgCl₂ (4 mM) and Taq polymerase (2.5 U) [15].
- Thermal Profile:
- Initial denaturation: 95°C for 4 min.
- 30 cycles of: 95°C for 30 s, 53°C for 45 s, 72°C for 60 s.
- Final extension: 72°C for 7 min [15].
5.2.2 TGGE Analysis
- Gel Preparation: Prepare an 8% polyacrylamide gel with a uniform composition, including 6-7 M urea to facilitate temperature-mediated denaturation [15] [14].
- Electrophoresis:
- Use a DCode system or equivalent TGGE apparatus.
- Load prepared PCR products onto the gel.
- Run at a constant voltage of 65 V with a linear temperature gradient from 51.5°C to 62.2°C over 10 hours and 42 minutes [15].
- Visualization: Stain and visualize as described in the DGGE protocol (5.1.3) [15].
DGGE and TGGE are highly effective techniques for the sequence-dependent separation of nucleic acids, each with distinct operational profiles. While DGGE is a powerful tool for microbial ecologists, TGGE offers superior reproducibility and ease of use, making it the recommended technique for many applications, particularly in clinical diagnostics where robust and repeatable results are paramount [15] [14]. The choice between them should be guided by the specific research question, available infrastructure, and required throughput.
Denaturing Gradient Gel Electrophoresis (DGGE) represents a powerful genetic fingerprinting technique that enables researchers to analyze microbial community structure and dynamics across diverse environments. This molecular approach separates PCR-amplified 16S rRNA gene fragments based on their sequence-specific melting properties, generating banding patterns that serve as profiles of microbial community composition. Through systematic interpretation of these DGGE profiles, scientists can monitor spatial and temporal changes in dominant microbial populations, compare community structures across different environmental conditions, and identify key microorganisms associated with specific ecosystem states or functions. This application note provides comprehensive methodologies for DGGE analysis, statistical interpretation, and practical implementation within microbial ecology research and drug development contexts.
DGGE operates on the principle of electrophoretic separation of DNA fragments of identical size but differing sequences through a linearly increasing gradient of chemical denaturants (urea and formamide). As DNA molecules migrate through the polyacrylamide gel, they undergo partial denaturation at sequence-specific denaturant concentrations, thereby creating distinct banding patterns that reflect microbial community composition [10]. Each discrete band theoretically corresponds to a unique bacterial population or operational taxonomic unit within the sampled community, while band intensity provides semi-quantitative information about relative abundance [18].
The technique's resolving power enables detection of single-nucleotide polymorphisms without requiring sequencing, making it particularly valuable for rapid comparative analyses of multiple samples [10]. When coupled with GC-clamped primers that prevent complete DNA strand separation, DGGE provides a robust platform for assessing microbial diversity in complex environmental samples including soil, water, wastewater, and clinical specimens [18]. While contemporary next-generation sequencing offers greater resolution for comprehensive diversity assessments, DGGE remains relevant for hypothesis-driven research requiring cost-effective, high-throughput screening of microbial community dynamics across multiple experimental conditions.
Methodological Workflow and Protocols
Comprehensive DGGE Experimental Workflow
The following diagram illustrates the complete DGGE workflow from sample collection through data interpretation:
Sample Collection and DNA Extraction
Protocol Objective: To obtain high-quality microbial genomic DNA suitable for PCR amplification from diverse sample types.
Materials:
- Sample preservation solution (e.g., reduced transport fluid)
- PureGene DNA isolation kit (or equivalent)
- Glass beads (for mechanical disruption)
- Microcentrifuge tubes and vortex mixer
Detailed Procedure:
- Sample Collection: Aseptically collect environmental samples (e.g., soil, water, biofilm) or clinical specimens. For dental plaque studies, sample the gingival margin using sterile wooden toothpicks and immediately place in 1 mL reduced transport fluid with glass beads [18].
- Sample Dispersion: Vortex samples for 10 seconds to homogenize and disperse microbial aggregates.
- DNA Extraction: Use commercial DNA extraction kits following manufacturer protocols. For difficult-to-lyse microorganisms, incorporate additional mechanical disruption steps using bead beating.
- DNA Quantification: Measure DNA concentration using spectrophotometry or fluorometry. Store extracted DNA at -20°C until PCR amplification.
Critical Considerations:
- Maintain consistent sample biomass across comparisons to minimize technical variation
- Include extraction controls to detect potential contamination
- Avoid repeated freeze-thaw cycles of extracted DNA
PCR Amplification with GC-Clamp
Protocol Objective: To amplify target 16S rRNA gene regions with attached GC-rich sequence for DGGE analysis.
Reaction Setup:
- Template DNA: 10-100 ng microbial genomic DNA
- Primers: Universal bacterial primers targeting variable regions (e.g., F357-GC clamp and R518 for V3 region) [18]
- PCR Master Mix:
- 10× PCR buffer
- 2.5 mM MgCl₂
- 0.2 μM of each primer
- 0.2 mM dNTPs
- 5 U Taq polymerase
- Total Reaction Volume: 100 μL
Thermocycling Conditions:
- Initial denaturation: 94°C for 5 minutes
- 30 cycles of:
- Denaturation: 94°C for 1 minute
- Touchdown annealing: 65°C to 55°C (decreasing 1°C every 2 cycles) for 1 minute
- Extension: 72°C for 1 minute
- Final extension: 72°C for 5 minutes
- Hold: 4°C indefinitely
Post-Amplification Processing: Purify PCR products using QIAquick PCR purification kit, eluting into 30 μL final volume [18]. Verify amplification success and specificity via agarose gel electrophoresis before proceeding to DGGE.
DGGE Gel Preparation and Electrophoresis
Protocol Objective: To separate PCR-amplified 16S rRNA gene fragments based on sequence composition.
Gel Composition and Denaturant Gradient:
- Polyacrylamide Gel: 10% (wt/vol) polyacrylamide (37.5:1 acrylamide:bisacrylamide)
- Denaturant Gradient: Linear gradient from 30% to 70% denaturant (where 100% denaturant contains 7 M urea and 40% formamide)
- Gel Dimensions: Varies by apparatus; typically 16 × 16 cm with 1 mm thickness
- Casting Method: Use gradient-forming apparatus to create reproducible denaturant gradients
Electrophoresis Conditions:
- Apparatus: D-code system (Bio-Rad) or equivalent
- Buffer: 1× TAE buffer, maintained at constant temperature (typically 60°C)
- Run Parameters: 130 V for 4-5 hours (optimize based on target fragment size)
- Inclusion: Always include control samples (known bacterial species) across gels to normalize band positions between runs
Critical Considerations:
- Prepare fresh denaturant solutions for each gel to ensure reproducibility
- Maintain constant temperature during electrophoresis for consistent melting behavior
- Pre-run gels for 10-15 minutes before loading samples to establish temperature equilibrium
Research Reagent Solutions
Table 1: Essential Research Reagents for DGGE Analysis
| Reagent/Category | Specific Examples | Function & Application |
|---|---|---|
| DNA Extraction Kits | PureGene DNA Isolation Kit | Extraction of high-quality genomic DNA from complex samples [18] |
| PCR Components | GC-clamped primers (F357GC), dNTPs, Taq polymerase | Amplification of target 16S rRNA gene regions with GC-clamp for DGGE separation [18] |
| Gel Electrophoresis Reagents | Urea, formamide, acrylamide/bisacrylamide (37.5:1) | Formation of denaturing gradient gels for sequence-based separation [18] |
| Purification Kits | QIAquick PCR Purification Kit | Concentration and cleanup of PCR products prior to DGGE [18] |
| Staining Solutions | SYBR Green, ethidium bromide | Visualization of DNA bands following electrophoresis |
Statistical Analysis of DGGE Profiles
Diversity Indices and Community Metrics
Shannon-Wiener Index (H'): This diversity metric combines richness (number of bands) and evenness (relative band intensity) to provide a comprehensive measure of microbial diversity within a sample [18]. Calculation formula: H' = -Σ(pi × ln(pi)), where pi represents the proportional intensity of each band relative to the total intensity of all bands in the lane. In gingivitis studies, significantly lower Shannon-Wiener indices were observed in gingivitis-associated plaque compared to healthy controls (P = 0.009), suggesting reduced bacterial diversity in diseased states [18].
Band Pattern Similarity Analysis: Hierarchical cluster analysis groups samples based on similarity of their DGGE banding patterns, with results typically presented as dendrograms [18]. This analysis identifies related community structures across different samples or treatments. In cluster analyses of dental plaque, seven distinct clades associated with gingivitis samples while five clades associated with healthy controls, indicating specific community types correlated with disease status [18].
Advanced Statistical Approaches
Logistic Regression Analysis: This powerful statistical method identifies specific bands significantly associated with particular sample categories or experimental conditions [18]. The approach computes regression relationships between presence/absence or intensity of individual bands (independent variables) and outcomes of interest, such as disease state. Applications in oral microbiome research identified one band significantly associated with healthy sites (P = 0.001) and two bands significantly associated with gingivitis (P = 0.005 and P = 0.042) [18].
Multivariate Statistics: Principal component analysis (PCA) and multidimensional scaling (MDS) represent additional approaches for visualizing and interpreting pattern differences among multiple DGGE profiles [18]. These techniques reduce dimensionality of complex banding pattern data to identify major gradients of community variation across samples.
Table 2: Statistical Methods for DGGE Profile Interpretation
| Method | Application | Interpretation Guidelines |
|---|---|---|
| Shannon-Wiener Index | Community diversity quantification | Higher values indicate greater diversity; enables statistical comparison between sample groups [18] |
| Hierarchical Cluster Analysis | Grouping samples by community similarity | Dendrogram branches indicate related community structures; bootstrap values support branch strength [18] |
| Logistic Regression | Identifying bands associated with conditions | Significant P-values (<0.05) indicate specific phylotypes correlated with experimental factors [18] |
| Principal Component Analysis | Visualizing major variation patterns | Samples closer together on ordination plots have more similar community compositions [18] |
Technical Considerations and Limitations
Methodological Constraints and Biases
DGGE analysis presents several important technical limitations that researchers must consider during experimental design and data interpretation. The technique typically detects only the most dominant community members (approximately 1-2% of total populations), potentially overlooking rare but functionally significant microorganisms [19]. Additionally, multiple sequence types can comigrate to identical positions, while single sequences may generate multiple bands due to partial melting products, potentially leading to overestimation of true diversity [19].
Critical technical considerations include:
- PCR Bias: Differential amplification of templates can distort relative abundance assessments [19]
- Co-migration Artifacts: Different sequences may produce comigrating bands, falsely indicating identical populations [19]
- Re-amplification Issues: DNA isolated from excised DGGE bands may not represent original community members due to preferential amplification [19]
- Detection Sensitivity: The method typically reveals 15-20 dominant bands per sample, insufficient for capturing comprehensive diversity in complex environments [19]
Troubleshooting Common DGGE Challenges
Table 3: Troubleshooting Guide for DGGE Analysis
| Problem | Potential Causes | Solutions |
|---|---|---|
| Smearing instead of discrete bands | DNA degradation, improper denaturant gradient | Check DNA quality, verify gradient formation, optimize electrophoresis time |
| Faint band patterns | Insufficient DNA loading, poor PCR amplification | Increase template concentration, optimize PCR cycles, verify staining sensitivity |
| Irreproducible patterns between runs | Temperature fluctuations, denaturant batch variations | Include control samples, standardize gel conditions, prepare fresh solutions |
| Missing expected bands | Primer bias, inadequate GC-clamp efficiency | Test alternative primers, verify clamp functionality, optimize annealing temperatures |
Applications in Microbial Community Analysis
Environmental Monitoring and Biotechnology
DGGE has been successfully applied to track microbial community dynamics in anaerobic digestion systems treating dairy manure under different temperature regimes (28°C, 36°C, 44°C, and 52°C) [10]. Analysis revealed significant temperature-dependent community shifts, with sequences from day 0 samples showing >95% similarity to Acinetobacter sp., while day 60 samples demonstrated progression to temperature-specific communities including Galibacter mesophilus (28°C), Syntrophomonas curvata (36°C), Dielma fastidiosa (44°C), and Coprothermobacter proteolyticus (52°C) [10]. These findings illustrate how DGGE can elucidate functional microbial responses to environmental parameters.
Clinical and Health Research Applications
In oral microbiome studies, DGGE analysis of gingival margin plaque from children with and without gingivitis revealed significant structural differences in microbial communities [18]. The technique demonstrated reduced bacterial diversity in disease-associated plaque and identified specific phylotypes significantly correlated with gingival health status through logistic regression analysis [18]. Similar approaches have been applied to study microbial communities in gastrointestinal, respiratory, and skin microbiomes in relation to health and disease states.
Comparative Analysis of DGGE with Alternative Methods
Method Selection Considerations
The following diagram illustrates the position of DGGE within the broader context of microbial community analysis methods:
Method Capabilities and Limitations
Table 4: Comparison of Microbial Community Analysis Techniques
| Method | Resolution | Throughput | Key Advantages | Primary Limitations |
|---|---|---|---|---|
| Culture-Based | Low | Low | Enables functional studies | Severe underestimation of diversity (<5%) [18] |
| DGGE | Medium | High | Rapid community comparison, cost-effective | Limited to dominant populations, band identification challenges [18] [19] |
| Cloning & Sequencing | High | Low | Comprehensive diversity assessment | Labor-intensive, expensive for multiple samples [18] |
| Next-Generation Sequencing | Very High | Medium to High | Exceptional depth, quantitative data | Higher cost, bioinformatics complexity [10] |
DGGE Protocol Implementation: From DNA Extraction to Pattern Analysis
The efficacy of Denaturing Gradient Gel Electrophoresis (DGGE) as a powerful molecular fingerprinting technique for analyzing microbial community structure is highly dependent on the quality and purity of the input DNA [1] [10] [20]. This analysis is particularly crucial for complex environmental samples, which often contain potent polymerase chain reaction (PCR) inhibitors that can compromise subsequent steps [21] [22]. It is therefore imperative to recognize that the DNA extraction method is not a one-size-fits-all procedure; it must be carefully selected and optimized for the specific sample type under investigation to ensure accurate and reproducible DGGE profiles [23] [21] [24]. This application note provides a structured comparison of DNA extraction methodologies and detailed protocols tailored for diverse sample types within the context of a comprehensive DGGE research framework.
The Impact of DNA Extraction on DGGE Profiles
The choice of DNA extraction protocol directly influences the outcome of PCR-DGGE analysis by affecting DNA yield, purity, and, most importantly, the representativeness of the microbial community structure.
Comparative Performance of Extraction Kits
A recent study evaluating five commercial DNA extraction kits for the analysis of the cockle gut bacteriome found significant differences in their performance when followed by DGGE and 16S rRNA gene sequencing [24]. The results, summarized in Table 1, demonstrate that the DNeasy PowerSoil Pro Kit provided the highest DNA purity and quantity, and its resulting DGGE profiles and sequencing data offered the most representative view of the bacterial community, outperforming other kits which under-represented certain populations [24].
Table 1: Performance Comparison of DNA Extraction Kits for DGGE Analysis
| Kit Name | DNA Purity (A260/A280) | DNA Yield | Bacterial Community Representation (DGGE/NGS) | Best For |
|---|---|---|---|---|
| DNeasy PowerSoil Pro | High | High | Most representative, detected all abundant genera | Complex, inhibitor-rich samples [24] |
| QIAamp PowerFecal | Reduced | Reduced | Reduced efficiency | - |
| FastDNA Spin | - | - | Under-represented community | - |
| E.Z.N.A. Soil DNA | - | - | Variable performance | - |
| ZymoBIOMICS DNA Miniprep | Reduced | Reduced | Reduced efficiency | - |
Sample Type-Specific Optimization
The optimal DNA extraction method varies dramatically by sample type due to differences in cell wall structures and the presence of co-extracted contaminants:
- Oral Saliva: A comparative study found that the QIAamp DNA Micro Kit was significantly more suitable for PCR-DGGE analysis of saliva from healthy youths than traditional phenol-chloroform extraction. DGGE fingerprints from kit-based extracts showed high similarity indices (>0.95) for samples from the same individual, confirming method reliability [23].
- Poultry Production Samples (Feces/Litter): A novel semi-automated hybrid method was developed to enhance the recovery of DNA from both Gram-positive and Gram-negative bacteria while effectively removing PCR inhibitors. This method combines an intense two-step mechanical bead-beating homogenization with the enzymatic inhibitor-removal steps of the QIAamp DNA Stool Mini Kit, automated on a QIAcube robotic workstation [21]. This approach provided superior quantitative (16S rRNA qPCR) and qualitative (microbiomics) estimates of the total bacterial community compared to standalone mechanical or enzymatic methods [21].
- Forest Rhizosphere Soil: An optimized custom protocol was developed to address the challenges of humic acid co-purification and low DNA yield from complex forest soils [22]. The protocol incorporated multiple freeze-thaw cycles using liquid nitrogen and 65°C incubation, followed by precipitation with 30% Poly Ethylene Glycol (PEG) to remove humic substances effectively. This modification yielded a high DNA concentration of 21.08 μg/g of soil, providing abundant, high-quality material for downstream microbial community analysis [22].
Recommended Extraction Protocols for DGGE
The following section provides detailed, step-by-step protocols for DNA extraction from different sample types, optimized for PCR-DGGE.
This protocol is designed for complex environmental samples rich in inhibitors and Gram-positive bacteria.
Table 2: Research Reagent Solutions for Hybrid Extraction Protocol
| Reagent/Kit | Function |
|---|---|
| Lysing Matrix E tubes | Mechanical disruption of tough cell walls and sample matrix via bead-beating. |
| Sodium Phosphate Buffer & PLS Solution | Initial washing and suspension of the sample to remove soluble contaminants. |
| Buffer ASL | Lysis buffer from QIAamp DNA Stool Mini Kit to begin enzymatic disruption. |
| InhibitEX Tablets | Proprietary matrix to adsorb and remove PCR inhibitors (e.g., humic acids, bile salts). |
| QIAamp DNA Stool Mini Kit | Provides reagents for automated purification on QIAcube workstation. |
| QIAcube Robotic Workstation | Automates purification steps to increase throughput and reduce processing errors. |
Procedure:
- Mechanical Homogenization: Weigh 0.33 g of sample into a 2 ml Lysing Matrix E tube. Add 825 μl Sodium Phosphate Buffer and 275 μl PLS solution. Vortex and centrifuge at 14,000 x g for 5 min. Decant the supernatant.
- Cell Lysis: Add 700 μl of Buffer ASL to the pellet. Vortex and ensure ~10% headspace in the tube. Homogenize in a bead-beater (e.g., FastPrep 24) at 6.0 m/sec for 40 sec. Centrifuge at 14,000 x g for 5 min and transfer the supernatant to a new 2 ml tube. Repeat this homogenization step and combine the supernatants.
- Inhibitor Removal: Incubate the combined supernatant at 95°C for 5 min to maximize DNA recovery. Centrifuge at 14,000 x g for 1 min, transfer 1.2 ml of supernatant to a new tube. Add 1 InhibitEX tablet and vortex until a uniform suspension forms. Incubate for 1 min at room temperature and centrifuge at 14,000 x g for 5 min.
- Automated Purification: Transfer the supernatant to a fresh 1.5 ml tube, avoiding the pellet. Complete the DNA purification using the QIAamp DNA Stool Mini Kit reagents on a QIAcube robotic workstation, following the "DNA Stool – Human Stool" protocol as per the manufacturer's instructions [21].
- DNA Elution: Elute the purified DNA in 50-100 μl of AE buffer or nuclease-free water. Store at -20°C.
This protocol is optimized for soil samples with high humic acid content and complex microbial communities.
Procedure:
- Weigh 3 g of finely sieved soil into a Falcon tube.
- Add 6 ml of extraction buffer (100 mM Tris-Cl pH 8.0, 100 mM sodium, 1 mM EDTA pH 8.0, 1.5 M NaCl) and mix thoroughly.
- Add 13 μl of proteinase K (10 mg/ml) and incubate horizontally at 37°C for 30 min on a platform shaker.
- Add 750 μl of 20% SDS and incubate at 65°C for 90 min.
- Perform three freeze-thaw cycles to enhance lysis efficiency: freeze the samples in liquid nitrogen for 1 min, then immediately thaw at 65°C for 90 min.
- Centrifuge at 6000 rpm for 10 min and collect the supernatant. Repeat the lysis and freeze-thaw steps on the pellet to minimize DNA loss.
- To the combined supernatant, add an equal volume of 30% PEG (with 1.6 M NaCl). Incubate at room temperature for 2 hours to precipitate humic substances.
- Centrifuge at 10,000 rpm for 20 min and collect the aqueous layer.
- Perform a series of purifications:
- Add an equal volume of phenol:chloroform:isoamyl alcohol (25:24:1). Centrifuge at 12,000 rpm for 5 min and collect the supernatant.
- Add an equal volume of chloroform:isoamyl alcohol (24:1). Centrifuge and collect the supernatant (use a pipette tip with a cut end to avoid shearing DNA).
- Precipitate the DNA by adding 0.6 volumes of chilled isopropanol. Incubate at room temperature for 2 hours.
- Centrifuge at 14,000 rpm for 15 min, discard the supernatant, and air-dry the pellet.
- Dissolve the DNA pellet in 50 μl of TE buffer. Treat with RNase A (0.2 μg/μl) at 37°C for 2 h to remove RNA contamination.
- Perform a final ethanol precipitation, air-dry the pellet, and resuspend in 50 μl of TE buffer.
The following workflow diagram illustrates the critical DNA extraction and DGGE analysis pathway, highlighting the sample-specific optimization points discussed in this document.
Figure 1: DNA Extraction and DGGE Analysis Workflow. The pathway emphasizes the critical, sample-specific DNA extraction step, which directly influences the quality and reliability of the final DGGE community fingerprint.
Selecting and optimizing the DNA extraction method is a critical first step that fundamentally impacts the resolution and accuracy of microbial community analysis using DGGE. As demonstrated, the optimal protocol is highly dependent on the sample type, whether it be oral saliva, animal feces, or complex soil environments. Researchers must prioritize this initial step, validating their chosen method for each new sample matrix to ensure that the resulting DGGE fingerprints truly reflect the in-situ microbial diversity rather than being an artifact of the extraction process itself.
Denaturing Gradient Gel Electrophoresis (DGGE) is a powerful molecular fingerprinting technique that separates PCR-amplified DNA fragments of identical length based on their sequence-dependent melting properties [10]. The core principle relies on the electrophoretic mobility of partially melted double-stranded DNA molecules through a polyacrylamide gel with an increasing gradient of chemical denaturants (e.g., urea and formamide) [10] [25]. The efficacy of DGGE in detecting sequence variations, such as single-nucleotide polymorphisms (SNPs), is profoundly influenced by primer design, specifically the selection of the target region and the strategic attachment of a GC-rich sequence, known as a GC-clamp [12] [26].
This protocol outlines critical strategies for designing primers for DGGE analysis, ensuring robust detection of genetic variants in complex biological samples, from microbial communities to pathogenic viruses [10] [25].
Strategic Selection of Target Regions
The first and most crucial step in DGGE primer design is selecting an appropriate target sequence. Not all genomic regions are equally suitable for DGGE analysis due to variations in their inherent melting behavior.
Key Characteristics of an Ideal Target Region
An effective target sequence for DGGE should possess the following properties:
- Uniform Melting Temperature (Tm): The target region between the primers should be a single, contiguous melting domain. This means the entire sequence should transition from double-stranded to single-stranded conformation over a narrow temperature or denaturant concentration range [12]. Sequences with multiple, independent melting domains can produce complex and uninterpretable banding patterns.
- Optimal Length: The amplified fragment, or amplicon, should typically be between 100 and 500 base pairs. Shorter fragments are easier to resolve based on melting differences, while longer sequences may develop multiple melting domains [26].
- Moderate GC Content: While a GC-clamp manages high melting behavior, the target region itself should ideally have a relatively uniform and moderate GC content to facilitate a single, sharp melting transition. Highly GC-rich native sequences can be challenging to analyze without sophisticated melting profile predictions.
Melting Profile Analysis
Software tools are available to compute the in silico melting profile of a candidate DNA sequence [26]. These tools generate a melting map, predicting the temperature at which each base pair in the sequence will denature. This analysis is invaluable for confirming that the selected target region behaves as a single melting domain before proceeding with experimental work. Automated amplicon design tools can perform this analysis and validate primer specificity within the genome of interest [26].
Table 1: Target Region Selection Criteria for DGGE
| Parameter | Ideal Characteristic | Rationale |
|---|---|---|
| Amplicon Length | 100 - 500 bp | Balances resolution and specificity; prevents multiple melting domains in longer fragments [26]. |
| Melting Behavior | Single, uniform melting domain | Ensures a single, sharp transition for clear and interpretable band separation [12]. |
| Base Composition | Uniform sequence without extreme intrinsic GC richness | Facilitates the creation of a distinct low-temperature melting domain controlled by the target sequence. |
The Role and Design of the GC-Clamp
In standard PCR, amplicons can denature completely into single strands. In DGGE, this complete dissociation halts migration and prevents separation based on small sequence differences. The GC-clamp is an artificial, GC-rich sequence attached to one PCR primer to circumvent this limitation [12].
Function of the GC-Clamp
The GC-clamp introduces a very high-temperature melting domain at one end of the amplicon. During electrophoresis in the denaturing gradient, the lower melting domain (the target sequence) will begin to denature and slow down, while the GC-clamp remains double-stranded, acting as a "clamp" that prevents the two DNA strands from fully separating [10] [25]. This results in a partially melted molecule that migrates based on its specific sequence in the low-melting domain, enabling the detection of even single-base changes [25].
GC-Clamp Design and Attachment
- Sequence and Length: A typical GC-clamp is 30-50 nucleotides long and consists primarily of guanine (G) and cytosine (C) residues. Commonly used sequences include a 20 bp clamp (
GCGGCCCGCCGCCCCCGCCG) or a longer 36 bp clamp (CGCCCGCCGCGCCCCGCGCCCGTCCCGCCGCCCCCG) [12] [27]. The longer clamp provides a higher Tm domain for analyzing more stable target sequences. - Positioning: The clamp can be attached to the 5' end of either the forward or reverse primer. Its placement can be determined automatically by software to position it on the end of the amplicon with the highest average native Tm, ensuring a monotonically increasing melting profile towards the clamp [26]. This avoids "dips" in the melting profile that can cause peak broadening and loss of resolution. Users can also manually specify attachment to the 5' or 3' end.
- Melting Temperature Differential: The melting domain created by the GC-clamp should have a Tm at least 8°C higher than that of the target sequence to ensure it remains fully double-stranded under the analysis conditions [12].
Table 2: GC-Clamp Design Specifications
| Feature | Specification | Example / Application |
|---|---|---|
| Typical Length | 30 - 40 nucleotides [10] [26] | A 36 bp clamp is sufficient for most applications [12]. |
| Base Composition | >80% Guanine (G) and Cytosine (C) | High GC content ensures a very stable, high-temperature melting domain. |
| Tm Differential | ≥ 8°C above the target domain [12] | Ensures the clamp remains double-stranded while the target region melts. |
| Attachment | 5' end of one primer [26] | Does not interfere with primer binding or PCR amplification. |
Experimental Protocol for DGGE Primer Design and Application
The following is a detailed workflow for designing and implementing GC-clamped primers in a DGGE experiment.
In Silico Primer and Amplicon Design
- Define Target Sequence: Identify the genomic region of interest (e.g., the V3 region of the 16S rRNA gene for microbial diversity [10]).
- Design Primers: Use primer design software (e.g., Primer3) to generate candidate primer pairs flanking the target. Set parameters for a product size of 100-500 bp, primer Tm of 50-65°C, and avoid self-complementarity.
- Select and Attach GC-Clamp: Choose a standard GC-clamp sequence (e.g., the 36 bp clamp from section 3.2) and append it to the 5' end of one of the primers.
- Check Specificity: Perform an in silico PCR or BLAST analysis against the relevant genome database to ensure the primer pair is specific and amplifies only the intended target. Primer pairs resulting in multiple theoretical amplifications should be rejected [26].
- Predict Melting Profile: Use a melting profile tool (e.g., MeltPrimer, Variant Melting Profile) to visualize the melting behavior of the amplicon with the attached GC-clamp. Verify the presence of two distinct melting domains and note the predicted analysis temperature [26].
Laboratory Procedure: PCR Amplification and DGGE
PCR Reaction:
- Template: 20-50 ng of genomic DNA [12].
- Primers: 0.2 µM of each primer (one with the 5' GC-clamp, one without).
- PCR Mix: Standard PCR mixture containing 1U of DNA polymerase, 0.2 mM dNTPs, 1.5 mM MgCl₂, and 10 mM Tris-HCl buffer [12].
- Thermocycling Conditions: Initial denaturation at 95°C for 3 min; 35 cycles of 94°C for 30 s, primer-specific annealing temperature (e.g., 60°C) for 30 s, and 72°C for 30 s; final extension at 72°C for 5-10 min [12]. A final denaturation at 95°C followed by slow cooling to room temperature is recommended to promote heteroduplex formation in mixed samples [12].
DGGE Analysis:
- Gel Preparation: Prepare a 6-8% polyacrylamide gel with a denaturant gradient (e.g., 0-80% or 30-70%), where 100% denaturant is defined as 7 M urea and 40% (v/v) formamide [10].
- Electrophoresis: Load the PCR products and run the gel in a preheated tank (e.g., 60°C) at a constant voltage (e.g., 130 V) for 4-6 hours, depending on the amplicon size and gradient [10].
- Visualization: After electrophoresis, stain the gel with a fluorescent nucleic acid stain (e.g., SYBR Gold) and visualize the banding patterns under UV light.
The Scientist's Toolkit: Essential Research Reagents
Successful execution of a DGGE-based study requires a set of specific reagents and materials. The following table details key solutions and their functions.
Table 3: Essential Research Reagents for DGGE Analysis
| Reagent / Material | Function / Application | Example / Specification |
|---|---|---|
| GC-clamped Primers | To amplify the target region and create a high-Tm melting domain for DGGE separation. | Custom oligonucleotides with a 5' 30-40 nt GC-rich sequence [12] [26]. |
| Chemical Denaturants | To form the gradient in the polyacrylamide gel, creating the denaturing environment. | Urea (7 M) and Formamide (40%) as 100% denaturant stock solution [10]. |
| DNA Polymerase | To enzymatically amplify the target DNA from the sample template. | Thermostable polymerase (e.g., Red Taq DNA Polymerase) [12]. |
| Polyacrylamide | To create the separation matrix for the electrophoresis gel. | Standard 6-8% acrylamide:bis-acrylamide solution [10]. |
| TAE Buffer | To provide the ionic environment for electrophoresis (Tris-acetate-EDTA). | Standard 1x TAE as running buffer [10]. |
| DNA Stain | To visualize the separated DNA bands after electrophoresis. | Fluorescent stains like SYBR Gold or Ethidium Bromide [10]. |
PCR Amplification Conditions for DGGE-Compatible Amplicons
Within the framework of advanced molecular ecology research, Denaturing Gradient Gel Electrophoresis (DGGE) has established itself as a powerful fingerprinting technique for analyzing microbial community composition and dynamics. The principle of DGGE is to separate PCR-amplified DNA fragments of identical length but different sequences based on their differential melting behaviors in a gradient of chemical denaturants [28] [29]. The critical prerequisite for a successful DGGE analysis is the generation of well-amplified, specific amplicons that are compatible with the denaturing gradient separation process. This application note provides a detailed, evidence-based protocol for optimizing PCR amplification to produce ideal DGGE-compatible amplicons, ensuring reliable and reproducible results for microbial community analysis.
Principles of DGGE and Amplicon Requirements
The fundamental principle of DGGE relies on the fact that double-stranded DNA (dsDNA) molecules begin to denature ("melt") at specific domains when exposed to increasing concentrations of denaturants (a mixture of urea and formamide). This partial melting dramatically reduces the electrophoretic mobility of the DNA fragment in a polyacrylamide gel. Because the melting behavior of a DNA domain is determined by its nucleotide sequence (GC-rich regions melt at higher denaturant concentrations than AT-rich regions), fragments with different sequences can be separated [28] [25].
To prevent the two DNA strands from completely dissociating when a low-melting-temperature domain denatures, a GC-rich sequence (30-50 nucleotides long), known as a GC-clamp, is attached to the 5' end of one PCR primer [25]. This clamp maintains the partial attachment of the strands, allowing the separation to occur. Consequently, the design of PCR amplicons for DGGE must consider three key aspects:
- Amplicon Length: DGGE is most effective with short to medium-sized DNA fragments, typically in the range of 100 to 500 base pairs [30] [29]. Longer fragments may contain too many melting domains, complicating the banding pattern.
- GC-Clamp: One primer in the pair must be synthesized with a 5' GC-clamp.
- Target Gene Region: For microbial diversity studies, variable regions of the 16S rRNA gene (for bacteria and archaea) or the 18S rRNA gene (for eukaryotes) are typically targeted. The choice of variable region (e.g., V3, V6-V8) influences the resolution of the community analysis [30] [5].
Table 1: Commonly Used Primer Pairs for DGGE Analysis of Microbial Communities
| Target Group | Gene | Primer Name | Sequence (5' → 3') | Amplicon Region / Length | Application Example |
|---|---|---|---|---|---|
| Bacteria | 16S rRNA | GC-338F [30] | ACTCCTACGGGAGGCAGCAG | V3 / ~200 bp | Activated sludge, manure [29] |
| 518R [30] | ATTACCGCGGCTGCTGG | ||||
| Bacteria | 16S rRNA | GC-948F [30] | AACGCGAAGAACCTTAC | V6-V8 / ~450 bp | Sludge treatment systems [30] |
| L1401R [30] | GCGTGTGTACAAGACCC | ||||
| Eukaryotes | 18S rRNA | Euk1A [5] | CTGGTTGATCCTGCCAG | ~560 bp | Marine picoeukaryotes [5] |
| Euk516r-GC [5] | GC-clamp-ACCAGACTTGCCCTCC | ||||
| Functional Gene | rpoB | GC-rpoB1698F [30] | AACATCGGTTTGATCAAC | ~340 bp | Alternative to 16S rDNA [30] |
| rpoB2041R [30] | CGTTGCATGTTGGTACCCAT |
Optimized PCR Protocol for DGGE Amplicons
The following protocol is optimized based on successful applications in complex environmental samples like sludge and manure [30] [29]. It includes modifications to counteract common PCR inhibitors co-extracted with DNA from such samples.
Research Reagent Solutions
Table 2: Essential Reagents and Materials for PCR-DGGE
| Reagent/Material | Function/Description | Example/Note |
|---|---|---|
| High-Fidelity DNA Polymerase | Catalyzes DNA synthesis; fidelity reduces PCR errors. | Often supplied with proprietary reaction buffer. |
| dNTP Mix | Building blocks for new DNA strands. | Typical final concentration: 200 µM each. |
| GC-Clamped Primers | Specific forward or reverse primer with 5' GC-clamp. | GC-clamp is ~40 nt; primer stock at 10 µM. |
| Template DNA | Microbial community genomic DNA. | 1-10 ng for pure cultures, 10-50 ng for environmental samples. |
| Molecular Grade Water | Nuclease-free solvent for the reaction. | |
| PCR Additives | Enhances amplification from difficult templates. | Non-acetylated BSA (25 ng/reaction) and Formamide (1% v/v) [30]. |
| Thermal Cycler | Instrument for precise temperature cycling. |
Step-by-Step PCR Procedure
Reaction Mixture Setup: Prepare a PCR master mix on ice to ensure homogeneity and reduce contamination. The following composition is recommended for a 50 µL reaction [30] [31]:
- 1X PCR Buffer (supplied with the polymerase)
- 1.5 - 2.5 mM MgCl₂ (concentration may require optimization)
- 200 µM of each dNTP
- 0.3 - 0.5 µM of each primer (forward and GC-clamped reverse)
- 25 ng non-acetylated BSA (Roche, UK)
- 1% (v/v) molecular biology grade formamide (Sigma, UK)
- 1.0 - 2.5 U of DNA polymerase
- 10 - 50 ng of template DNA
- Nuclease-free water to 50 µL
Thermal Cycling Conditions: Perform amplification in a thermal cycler using the following optimized program [30] [31]:
- Initial Denaturation: 95 °C for 1 - 5 minutes
- Amplification Cycles (20-35 cycles):
- Denaturation: 95 °C for 30 - 60 seconds
- Annealing: 50 - 65 °C for 45 - 60 seconds (Temperature is primer-specific)
- Extension: 68 °C for 1 - 3 minutes
- Final Extension: 68 °C for 5 - 10 minutes
- Hold: 4 °C ∞
Critical Note: To minimize the formation of PCR artefacts and chimera formation, it is recommended to use a reduced number of cycles (e.g., 20-25 cycles) and a higher primer concentration (e.g., 30 pmol per reaction) whenever possible [30].
Post-PCR Analysis and Cleanup:
- Verify the success and specificity of the PCR by analyzing 5 µL of the product on a standard 1-2% agarose gel.
- If necessary, multiple PCR reactions (n=10) for the same sample can be pooled to obtain sufficient product [30].
- The PCR products can be concentrated by ethanol precipitation and resuspended in a suitable buffer like 10 mM Tris-HCl (pH 8.0) to a final concentration of 100 ng/µL before DGGE analysis [30].
Workflow Visualization
The following diagram illustrates the complete workflow from sample preparation to data analysis in a PCR-DGGE experiment.
Critical Factors for Success and Troubleshooting
- Primer and Target Selection: The choice of primer pair and target gene region is paramount. The V6-V8 region of the 16S rDNA has been shown to provide dynamic analysis of microbial communities in some systems, while rpoB gene profiles may be less informative [30]. Always consult literature for your specific sample type.
- Overcoming PCR Inhibition: Complex samples like sludge often contain PCR inhibitors. The addition of BSA and formamide to the PCR mix has been proven effective in limiting this inhibition and enhancing amplification from thermophilic sludge samples [30].
- Minimizing PCR Bias: PCR conditions inherently introduce bias. Using a minimal number of cycles and high primer-to-template ratios helps reduce this bias and the formation of spurious by-products, leading to a more accurate representation of the microbial community [30] [31].
- DGGE Gel Conditions: For the separation of amplicons generated with primers like GC-338F/518R (V3 region), a denaturing gradient of 35% to 55% (100% denaturant is 7 M urea and 40% formamide) can be effective. Electrophoresis is typically run at 150-180 V for 5-6 hours at 60°C [32] [7]. The optimal gradient must be determined empirically for different primer sets and sample types.
Producing high-quality, DGGE-compatible amplicons is a critical first step in obtaining meaningful data from microbial community fingerprinting. The optimized PCR protocol detailed here, which includes the strategic use of GC-clamped primers, specific cycling parameters, and PCR additives to combat inhibition, provides a robust method for generating amplicons that will resolve effectively on a denaturing gradient gel. Adherence to this protocol will significantly enhance the reproducibility and reliability of DGGE analyses in diverse research applications, from environmental microbiology to clinical studies.
Within the broader scope of denaturing gradient gel electrophoresis (DGGE) protocol research, the preparation of the gel with an appropriate denaturant gradient is a critical step that fundamentally determines the success and resolution of the analysis. DGGE separates PCR-generated DNA fragments of identical size based on their sequence-dependent melting properties, which are visualized as distinct bands after electrophoresis through a polyacrylamide gel containing a gradient of denaturants [1]. The core principle relies on the fact that double-stranded DNA begins to denature in discrete regions, called melting domains, when exposed to increasing concentrations of denaturants. This partial melting dramatically reduces the fragment's migration rate in the gel matrix. Since the melting temperature of each domain is sequence-specific, even a single base-pair change can alter its denaturation profile and resulting position in the gel [33] [1]. Establishing the optimal denaturant gradient range is therefore not a one-size-fits-all endeavor; it requires empirical optimization based on the specific DNA fragment under investigation to achieve maximum resolution and reliable mutation detection or microbial community profiling.
The Science of Denaturant Gradients
The denaturants used in DGGE are urea and formamide, which disrupt the hydrogen bonds holding the DNA double helix together [1] [34]. A "100%" denaturant solution is typically defined as 7 M urea and 40% (v/v) deionized formamide in an appropriate buffer, often 0.5x TAE [34]. The gradient is established by preparing two acrylamide solutions: a "low" denaturant solution and a "high" denaturant solution. These are mixed during gel casting using a gradient mixer to create a gel with a linearly increasing concentration of denaturants from the top to the bottom [34].
The optimal range of this gradient is dictated by the melting behavior of the target DNA fragments. In practice, the target fragment should be designed, through strategic primer placement, to exhibit a single low-melting domain, often facilitated by attaching a 30-50 nucleotide GC-rich sequence (GC-clamp) to one end via one of the PCR primers [33] [1]. This clamp prevents the complete dissociation of the DNA strands, ensuring the fragment halts in the gel upon partial melting. Without this clamp, a fragment with a single melting domain would denature completely and run off the gel [1]. The goal of gradient optimization is to find a denaturant concentration window where the target DNA fragments transition from a fully double-stranded to a partially melted state, thereby resolving sequences based on their differential melting.
Table 1: Standard Denaturant Stock Solution Components
| Component | Function | Typical Concentration in 100% Stock |
|---|---|---|
| Urea | Chemical denaturant, breaks hydrogen bonds | 7 M [34] |
| Formamide | Chemical denaturant, breaks hydrogen bonds | 40% (v/v) [34] |
| Acrylamide/Bis-acrylamide | Forms the porous gel matrix | Typically 9% (37.5:1 ratio) [34] |
| TAE Buffer | Provides conductive medium for electrophoresis | 0.5x [34] |
Establishing Optimal Gradient Ranges: A Practical Guide
Selecting the initial denaturant gradient is an empirical process. The following workflow and table provide a starting point based on previous applications, after which finer adjustments are often required.
Diagram 1: A workflow for establishing the optimal denaturant gradient for a DGGE experiment.
Step-by-Step Protocol for Gradient Gel Preparation
The following protocol, adapted from established methods, details the process of preparing and running a DGGE gel [34].
- Assembly and Setup: Assemble the gel cassette using clean glass plates and spacers. Place the cassette securely on the casting apparatus. Fill the electrophoresis tank with approximately 7 liters of 0.5x TAE buffer, place the lid, and turn on the heating unit to set the temperature to a constant 58-60°C [1] [34].
- Form the Gel Plug: To prevent leakage, prepare 1 mL of a 9% acrylamide solution. Add 25 µL of 10% ammonium persulfate (APS) and 1.5 µL of TEMED, mix quickly, and pour into the bottom of the gel cassette. Allow this to polymerize completely (c. 10-15 minutes) [34].
- Prepare Denaturant Solutions: Freshly prepare two acrylamide/denaturant solutions—a low-percentage and a high-percentage denaturant mix. For example, to create a 15%-55% gradient:
- 15% Mix: Combine 1.8 mL of 100% acrylamide/UF stock with 10.2 mL of 9% acrylamide solution.
- 55% Mix: Combine 6.6 mL of 100% acrylamide/UF stock with 5.4 mL of 9% acrylamide solution. Add 65 µL of 10% APS and 3.3 µL of TEMED to each mix and swirl gently to combine [34].
- Cast the Gradient Gel: Place the gradient mixer on a magnetic stirrer at a height of approximately 32 cm above the gel cassette. Pour the low-percentage mix into the left chamber (outlet valve closed). Briefly open the interconnecting valve to allow a small amount of mix to flow into the right chamber, then close. Pour the high-percentage mix into the right chamber, add a stirring bar, and start stirring. Simultaneously open the interconnecting valve and the outlet tubing to allow the solutions to mix and flow into the gel cassette. The gel will polymerize from the bottom up [34].
- Add Stacking Gel: After the gradient gel has polymerized (at least 1 hour), prepare a stacking gel solution. Pour it onto the polymerized gradient gel and carefully insert a comb. Allow 15 minutes for polymerization [34].
- Sample Loading and Electrophoresis: Carefully remove the comb and rinse the wells with buffer. Load samples mixed with a loading dye. Run the gel for 16 hours at 80 V (or 5 hours at 150 V, depending on the system and fragment size) [34] [32].
- Post-Electrophoresis Analysis: After the run, disassemble the cassette and stain the gel with an appropriate stain, such as ethidium bromide or silver stain, for visualization under UV or white light [34] [32].
Table 2: Empirical Examples of Denaturant Gradient Ranges for Various Applications
| Target Gene / Fragment | Recommended Gradient Range | Key Experimental Context / Rationale |
|---|---|---|
| 16S rRNA V3 Region (General Bacteria) | 30% - 60% [35] | A broad-range gradient suitable for profiling diverse bacterial communities in environmental samples. |
| 16S rRNA (Ammonia-Oxidizing Bacteria) | 35% - 65% [36] | A steeper gradient developed to resolve closely related members of the Nitrosospira-Nitrosomonas group. |
| General Screening | 20% - 60% or 35% - 75% [34] | Suggested starting ranges for unknown fragments, requiring further optimization. |
| Ciliate 18S rRNA | 32% - 42% [6] | A narrow, optimized gradient developed specifically for fingerprinting soil ciliate communities. |
| Not Specified | 35% - 55% [32] | A commonly used intermediate gradient for general-purpose DGGE analysis. |
Troubleshooting and Optimization Strategies
A well-optimized gel will show sharp, well-separated bands. Smearing, fuzzy bands, or poor resolution indicates a suboptimal gradient or other issues.
- If bands are clustered at the top (low denaturant concentration): The gradient's starting concentration may be too high. Re-cast the gel with a lower starting percentage (e.g., shift from 35%-55% to 20%-50%).
- If bands are clustered at the bottom (high denaturant concentration): The gradient's ending concentration may be too low. Re-cast the gel with a higher ending percentage (e.g., shift from 35%-55% to 40%-60%).
- If bands are fuzzy or smeared: Ensure the gel temperature is maintained constant at 58-60°C throughout the run. Check the freshness of the denaturant stock solutions, as urea can degrade over time. Furthermore, incorporate a heteroduplex step by denaturing and re-annealing PCR products prior to loading; this generates heteroduplex molecules (from heterozygous or mixed templates) that melt more easily and can resolve as additional, sharper bands, thereby increasing mutation detection sensitivity [1].
The Scientist's Toolkit: Essential Reagents and Equipment
Table 3: Key Research Reagent Solutions for DGGE Gel Preparation
| Reagent / Equipment | Function / Description |
|---|---|
| Urea & Formamide | Chemical denaturants that constitute the gradient; formamide must be deionized for consistent results [34]. |
| Acrylamide/Bis-acrylamide (37.5:1) | Forms the porous polyacrylamide gel matrix that separates DNA fragments [34]. |
| TAE Buffer (0.5x) | The standard electrolyte and gel buffer; provides the required ionic strength and pH for electrophoresis [34]. |
| Ammonium Persulfate (APS) & TEMED | Catalysts for the free-radical polymerization of acrylamide [34]. |
| GC-Clamped Primer | A PCR primer with a 5' 30-50 bp GC-rich tail; prevents complete strand dissociation and is crucial for high detection sensitivity [33] [1]. |
| Gradient Mixer | A two-chamber apparatus that creates a linear gradient of denaturants during gel casting [34]. |
| Temperature-Controlled Electrophoresis System | A dedicated DGGE tank (e.g., Bio-Rad DCODE) that maintains a constant high temperature (e.g., 58-60°C) during the run, which is critical for reproducible denaturation [1] [34]. |
The meticulous preparation of the denaturing gradient gel is the cornerstone of a successful DGGE analysis. There is no universal gradient range; optimal conditions must be determined empirically for each target DNA fragment. The process involves understanding the melting behavior of the DNA, selecting an appropriate initial gradient based on prior knowledge, and systematically troubleshooting and refining the range until sharp band resolution is achieved. By adhering to the detailed protocols and optimization strategies outlined in this application note, researchers can reliably establish robust DGGE assays for sensitive mutation detection and complex microbial community analysis, thereby advancing their research in drug development, molecular diagnostics, and microbial ecology.
Within the framework of denaturing gradient gel electrophoresis (DGGE) protocol research, the precise control of physical parameters is not merely a procedural requirement but a fundamental determinant of experimental success. Denaturing Gradient Gel Electrophoresis (DGGE) is a powerful technique that separates short- to medium-length DNA fragments of identical size based on their sequence-specific melting behaviors [20]. This separation occurs in a polyacrylamide gel containing a gradient of chemical denaturants (urea and formamide), where DNA molecules halt migration at distinct points corresponding to their melting properties [10]. The fidelity of this separation is critically governed by three core electrophoresis parameters: voltage, temperature, and run duration. These parameters directly influence gel resolution, band sharpness, and the accurate fingerprinting of complex microbial communities [37] [5]. Optimizing these factors is therefore essential for generating reliable, reproducible data in applications ranging from microbial ecology to diagnostic assay development.
Core Electrophoresis Parameters in DGGE
The following table summarizes the key electrophoresis parameters and their optimized ranges for DGGE, synthesized from established protocols.
Table 1: Optimized Electrophoresis Parameters for DGGE
| Parameter | Typical Range | Protocol Example / Context | Impact on Separation |
|---|---|---|---|
| Voltage | 100 - 130 V | 130 V for 5 hours (PCR-TTGE for Salmonella) [37]; 100 V for 18-20 hours (Mycoplasma DGGE) [38] | Higher voltage decreases run time but may reduce resolution and cause smearing; lower voltage improves separation clarity. |
| Temperature | 60°C (constant) | 60°C for Mycoplasma 16S rRNA gene DGGE [38]; Essential for stable denaturing conditions [20] | Maintains a constant, uniform denaturing environment throughout the gel, crucial for reproducible melting of DNA fragments. |
| Run Duration | 5 - 20 hours | 5 hours (PCR-TTGE) [37]; 16-18 hours (Marine picoeukaryote DGGE) [5]; 18-20 hours (Mycoplasma DGGE) [38] | Directly linked to voltage; must be sufficient for fragments to migrate to their specific denaturation points. |
The interplay between these parameters is a critical consideration. For instance, a method with a higher voltage (130 V) requires a shorter run duration (5 hours) [37], whereas a standard protocol running at 100 V typically requires a much longer duration, often between 16 to 20 hours [5] [38]. Furthermore, the run duration must be standardized for a specific primer set and amplicon length, as these determine the migration distance required for optimal separation.
Experimental Protocol: DGGE for Microbial Community Analysis
This protocol details the application of DGGE to profile bacterial communities, as applied in the analysis of microbial shifts in anaerobic digestions [10].
Research Reagent Solutions
Table 2: Essential Reagents and Materials for DGGE
| Item | Function / Specification |
|---|---|
| Polyacrylamide Gel | Separation matrix; typically 10% polyacrylamide/bis (30:1 ratio) [38]. |
| Denaturant Gradient | Creates the denaturing environment; common range is 30%-60% of urea and formamide [38]. |
| TAE Electrophoresis Buffer | Standard buffer (Tris-Acetate-EDTA) for conducting current [38]. |
| GC-Clamped Primers | PCR primers with a 35-40 nt GC-rich sequence at the 5' end to prevent complete strand dissociation [10]. |
| Chemical Denaturants | Urea and formamide, used to create the linear gradient within the gel [10] [20]. |
Step-by-Step Methodology
Gel Casting & Denaturant Gradient: Prepare two solutions of polyacrylamide: a low-denaturant solution (e.g., 30%) and a high-denaturant solution (e.g., 60%). Using a gradient-forming apparatus, pour the gel to create a linear denaturant gradient from the top (higher denaturant) to the bottom (lower denaturant). Allow the gel to polymerize completely.
Sample Loading: Mix PCR-amplified DNA samples (targeting a variable region like V3 of the 16S rRNA gene) with a loading dye. Carefully load the samples into the wells of the gel [10].
Electrophoresis Run: Place the gel in an electrophoresis tank filled with 1x TAE buffer. Set the temperature of the buffer to a constant 60°C using a thermostatic controller. Run the electrophoresis at a constant voltage of 100 V for a duration of 16 to 18 hours [5] [38]. These parameters ensure the DNA fragments melt in a sequence-dependent manner as they migrate through the denaturant gradient.
Post-Electrophoresis Analysis: After the run, carefully stain the gel with a fluorescent nucleic acid stain such as SYBR Gold for 30 minutes [38]. Visualize the banding patterns under UV illumination. Distinct bands can be excised from the gel for DNA extraction, re-amplification, and sequencing to identify community members [10] [5].
Workflow and Parameter Interdependence
The diagram below illustrates the logical workflow of a DGGE experiment, highlighting how core parameters and experimental steps lead to the final analytical outcomes.
DGGE Experimental Workflow and Outcomes. This flowchart outlines the key steps in a DGGE protocol, emphasizing the critical role of the three core electrophoresis parameters (Voltage, Temperature, Run Duration) in determining the quality of the final banding pattern and subsequent data analysis.
The rigorous optimization and control of voltage, temperature, and run duration are foundational to the success of any Denaturing Gradient Gel Electrophoresis (DGGE) protocol. As demonstrated in diverse applications from anaerobic digestion monitoring to pathogen identification, consistent parameters ensure the generation of high-resolution, reproducible community fingerprints that can be reliably compared across experiments [10] [38]. Adherence to the detailed protocols and parameters outlined in this document provides a robust framework for researchers to obtain qualitatively superior data, thereby strengthening the conclusions drawn from their DGGE-based research.
Candida species are among the most common causes of fungal infections, leading to conditions ranging from superficial mucocutaneous diseases to life-threatening systemic infections [40] [15]. Accurate identification of Candida species is an essential prerequisite for improved therapeutic strategies, as significant attributes including antifungal drug resistance and virulence factors differ considerably among species [40] [41]. Conventional identification methods based on biochemical characteristics are time-consuming, often requiring up to 30 days for definitive results, and demonstrate limited sensitivity [40] [42].
Molecular approaches have revolutionized Candida detection by providing faster, more reliable alternatives to culture-based methods [40]. Among these, Denaturing Gradient Gel Electrophoresis (DGGE) offers a powerful PCR-based fingerprinting technique for studying microbial community structure and enabling simultaneous identification of multiple yeast species [40] [20]. This application note details the implementation of DGGE for Candida species identification within clinical diagnostic settings, providing comprehensive protocols and analytical frameworks for researchers and clinical microbiologists.
Principle of Denaturing Gradient Gel Electrophoresis
DGGE separates PCR-amplified DNA fragments of identical length based on their sequence-specific melting properties [20]. The technique employs a polyacrylamide gel containing a linear gradient of chemical denaturants (urea and formamide). As DNA fragments migrate through this gradient, they undergo partial denaturation at sequence-dependent points, significantly reducing their electrophoretic mobility [40] [20].
A GC-clamp (a 30-40 bp guanine-cytosine-rich sequence) attached to one PCR primer prevents complete strand dissociation, thereby enabling separation of fragments that may differ by as little as a single base pair [40] [20]. This sensitivity to sequence variations allows DGGE to distinguish among different Candida species through their distinctive banding patterns following electrophoresis.
Comparative Analysis of DGGE for Candida Identification
Experimental Design and Performance
A comparative study evaluated DGGE alongside Temporal Temperature Gradient Gel Electrophoresis (TTGE) for differentiating five Candida species: C. albicans, C. glabrata, C. tropicalis, C. orthopsilosis, and C. parapsilosis [40]. Researchers tested two primer sets targeting different genomic regions:
- ITS3-GC/ITS4: Amplifies the ITS2 region of ribosomal DNA (~300-400 bp)
- NL1-GC/LS2: Amplifies the D1 region of the 26-28S rRNA gene (~250 bp) [40]
The study revealed that the NL1-GC/LS2 primer set yielded species-specific amplicons that allowed for better discrimination of all five Candida species in both DGGE and TTGE profiles [40]. In contrast, the ITS3-GC/ITS4 primer pair produced unspecific PCR products that persisted despite optimization attempts, resulting in multiple bands for single Candida species and unreliable identification [40].
Table 1: Performance Comparison of Primer Sets for Candida Species Identification
| Primer Set | Target Region | Amplicon Size | Specificity | Discriminatory Power |
|---|---|---|---|---|
| ITS3-GC/ITS4 | ITS2 | ~300-400 bp | Low: produced unspecific PCR products | Poor: multiple bands for single species |
| NL1-GC/LS2 | D1 region of 26-28S rRNA | ~250 bp | High: species-specific amplicons | Excellent: all five species discriminated |
Table 2: DGGE Electrophoresis Conditions for Candida Species Identification
| Parameter | Condition for ITS3-GC/ITS4 | Condition for NL1-GC/LS2 |
|---|---|---|
| Gel Composition | 8% polyacrylamide (37.5:1 acrylamide:bis-acrylamide) | 8% polyacrylamide (37.5:1 acrylamide:bis-acrylamide) |
| Denaturing Gradient | 30-60% | 30-45% |
| Denaturant Solution (100%) | 7 M urea, 40% (v/v) formamide | 7 M urea, 40% (v/v) formamide |
| Running Buffer | 1X TAE | 1X TAE |
| Voltage | 55 V | 130 V |
| Temperature | 56°C | 60°C |
| Duration | 16 hours | 4.5 hours |
DGGE Workflow for Candida Identification
The following diagram illustrates the complete DGGE workflow for Candida species identification, from sample preparation through to result interpretation:
Detailed Experimental Protocol
Candida Culture and DNA Extraction
- Culture Conditions: Inoculate Candida strains on Potato Dextrose Agar (PDA) plates. Incubate at 36°C for 24 hours to obtain fresh colonies for DNA extraction [40].
- DNA Extraction: Employ the phenol-chloroform method according to established yeast nucleic acid isolation protocols [40]. Approximately 20 ng of purified DNA is required for subsequent PCR amplification.
PCR Amplification with GC-Clamped Primers
- Primer Selection: Prepare the NL1-GC/LS2 primer set with a 30 bp GC-clamp attached to the 5' end of the NL1 primer [40].
- PCR Reaction Setup:
- PCR Buffer: 5 μL
- MgCl₂: 4 mM
- dNTPs: 0.2 mM
- Each primer: 0.1 mM
- Taq DNA polymerase: 2.5 U
- DNA template: ~20 ng
- Final volume: 50 μL with sterile water [40]
- Thermal Cycling Conditions:
- Initial denaturation: 95°C for 4 minutes
- 30 cycles of:
- Denaturation: 95°C for 30 seconds
- Annealing: 53°C for 45 seconds
- Extension: 72°C for 60 seconds
- Final extension: 72°C for 7 minutes [40]
- Amplicon Verification: Analyze 5 μL of PCR products on a 1% (w/v) agarose gel to confirm successful amplification of the ~250 bp target fragment [40].
DGGE Analysis
- Gel Preparation: Prepare an 8% polyacrylamide gel (37.5:1 acrylamide:bis-acrylamide) with a 30-45% denaturing gradient. The 100% denaturant solution contains 7 M urea and 40% (v/v) formamide [40].
- Sample Loading: Mix 20 μL of PCR product with 20 μL of 2× gel loading dye. Load samples into wells of the prepared DGGE gel [40].
- Electrophoresis: Run the gel in 1× TAE buffer at a constant voltage of 130 V for 4.5 hours at 60°C [40].
- Visualization: Following electrophoresis, stain the gel with ethidium bromide for 30 minutes at room temperature. Visualize banding patterns using a UV transilluminator [40].
Result Interpretation
Compare the DGGE banding patterns of clinical samples against those of reference Candida strains. Each species demonstrates a characteristic band position, enabling identification based on migration distance [40].
Research Reagent Solutions
Table 3: Essential Reagents and Materials for Candida DGGE Analysis
| Reagent/Material | Function | Specifications/Alternatives |
|---|---|---|
| Potato Dextrose Agar (PDA) | Candida culture medium | Merck, Germany or equivalent |
| Phenol-Chloroform | DNA extraction | Molecular biology grade |
| NL1-GC/LS2 Primers | Amplification of D1 region of 26-28S rRNA | NL1 with 30 bp GC-clamp at 5' end |
| Taq DNA Polymerase | PCR amplification | CinnaGen, Iran or equivalent |
| dNTPs | PCR amplification | 0.2 mM final concentration |
| Acrylamide/Bis-acrylamide | DGGE gel matrix | 8% solution, ratio 37.5:1 |
| Urea | Denaturing agent in DGGE gel | 7 M in 100% denaturant |
| Formamide | Denaturing agent in DGGE gel | 40% (v/v) in 100% denaturant |
| TAE Buffer | Running buffer for electrophoresis | 1× concentration |
| Ethidium Bromide | Nucleic acid staining | 30 minutes at room temperature |
Technical Considerations and Alternative Methods
While DGGE provides effective discrimination of Candida species, the comparative study noted that TTGE offered similar discriminatory power with easier performance and lower costs [40]. TTGE employs a temperature gradient rather than a chemical denaturant gradient, simplifying the procedure while maintaining separation efficiency [40].
Other molecular methods for Candida identification include real-time PCR and pyrosequencing, which offer high sensitivity and specificity but may have limitations in detecting multiple unexpected species simultaneously [40] [42]. DGGE remains advantageous for its ability to detect multiple Candida species in a single analysis, including minor populations that might be missed by targeted approaches [40].
The emergence of antifungal-resistant Candida species, particularly C. auris and fluconazole-resistant C. parapsilosis, underscores the continued importance of accurate species identification for guiding appropriate antifungal therapy [41] [43]. DGGE represents a valuable tool in the diagnostic arsenal for addressing these evolving public health challenges.
Microbial Community Analysis in Environmental and Food Samples
Denaturing Gradient Gel Electrophoresis (DGGE) is a powerful molecular fingerprinting technique that has revolutionized the analysis of complex microbial communities in environmental and food samples. This method enables researchers to separate polymerase chain reaction (PCR)-generated DNA fragments of the same size but different sequences, providing a profile representing the genetic diversity of a microbial community from a specific environment [1] [44]. As a culture-independent approach, DGGE overcomes limitations associated with selective cultivation and isolation of microorganisms, allowing for a more comprehensive understanding of microbial community structure and dynamics [44]. The technique was originally formulated to understand single-nucleotide polymorphisms in genes but is now widely applied in various fields including environmental microbiology, microbial ecology, and food microbiology [29] [44]. The fundamental principle of DGGE relies on the differential denaturation of DNA fragments when electrophoresed through a polyacrylamide gel containing an increasing gradient of chemical denaturants (urea and formamide) [29] [1]. This allows for the detection of sequence variations without the need for DNA sequencing, making it an invaluable tool for rapid comparative analysis of multiple samples [29].
Theoretical Principles and Technical Basis
Fundamental Separation Mechanism
The working principle of DGGE is based on the partial separation of DNA strands at a specific position in a gradient of chemical denaturant [29]. When double-stranded DNA molecules pass through a polyacrylamide gel with an increasing gradient of denaturants, each molecule begins to denature at a unique concentration corresponding to its sequence composition [29] [1]. This denaturation causes a significant reduction in electrophoretic mobility, effectively trapping the DNA fragment at its specific denaturation threshold [1]. The denaturation of DNA should ideally start from one end of the duplex rather than in the middle or at both ends simultaneously for optimal separation [1]. Generally used denaturants include heat (a constant temperature of 60°C) and a fixed ratio of formamide (0%-40%) and urea (0-7 M) [1]. The gradients of denaturant are run parallel to the direction of electrophoresis, resulting in bands at locations where individual molecules partially denature due to the gradients [29].
GC Clamp and Melting Domains
A critical innovation in DGGE technology is the use of a GC-clamp—a 35-40 nucleotide GC-rich sequence attached to one end of the PCR amplicon [29] [1]. This GC-clamp serves to prevent complete strand separation during electrophoresis through the denaturant gradient [1]. Without this clamp, a DNA fragment would become completely single-stranded upon denaturation and run off the gel [1]. The GC-clamp creates a high-melting domain at one end of the target fragment, ensuring that branch formation occurs after melting of the target fragment [1]. For optimal resolution, target fragments in DGGE typically have an average size of 275 bp, including the GC-clamp and PCR primer sequences [1]. The strategic design of target fragments to represent single melting domains is crucial for detecting all possible mutations, as only variations in the lowest melting domain are readily detected in fragments with multiple domains [1].
Heteroduplex Analysis
The sensitivity of DGGE for detecting sequence variants is significantly enhanced through the introduction of a heteroduplexing step, typically involving one round of denaturation and renaturation at the end of PCR amplification [1]. This process generates four different double-stranded fragments from a heterozygous mutation: two homoduplex molecules (wild-type and mutant) and two heteroduplex molecules (each comprising one wild-type and one mutant strand) [1]. Since heteroduplexes have substantially lower stability due to base-pair mismatches, they consistently melt earlier than homoduplex molecules, providing additional bands in the DGGE profile that enhance mutation detection sensitivity [1].
Table: Key Technical Components of DGGE
| Component | Specification | Function |
|---|---|---|
| Denaturants | Urea (0-7 M) and formamide (0%-40%) | Creates chemical environment for DNA denaturation |
| GC Clamp | 35-40 nt GC-rich sequence | Prevents complete strand separation during electrophoresis |
| Target Fragment Size | 200-700 bp (optimal ~275 bp) | Balances separation resolution and amplification efficiency |
| Gel Matrix | Polyacrylamide (6%-8%) | Provides sieving matrix for DNA separation |
| Electrophoresis Conditions | 60°C constant temperature, 75-180 V for 6-18 h | Maintains consistent denaturing conditions during separation |
Experimental Protocol and Workflow
Sample Collection and DNA Extraction
The initial step in DGGE analysis involves careful collection of environmental or food samples, followed by efficient DNA extraction to obtain representative genetic material from the microbial community. For environmental samples such as seawater, this may involve filtration through sequential polycarbonate filters (e.g., 3-μm-pore-size followed by 0.2-μm-pore-size filters) to collect bacterioplankton biomass [4] [5]. The filters are then typically stored in lysis buffer at -80°C until processing [4] [5]. Nucleic acid extraction generally involves physical and enzymatic disruption methods, including the use of lysozyme, proteinase K, and sodium dodecyl sulfate, followed by purification through phenol-chloroform extraction and concentration with centrifugal filter devices [5]. The integrity of extracted DNA is verified through agarose gel electrophoresis, and quantification is performed using fluorescence assays [5]. This step is critical as the quality and representativeness of the extracted DNA directly impact subsequent PCR amplification and DGGE fingerprinting results.
PCR Amplification with GC-Clamped Primers
Following DNA extraction, targeted amplification of specific gene regions is performed using primers with attached GC-clamps. The choice of primer set depends on the research objective and target microorganisms. For bacterial community analysis, primers targeting variable regions of the 16S rRNA gene are commonly employed, such as 341F-GC and 518R, which amplify the V3 region [7] [4]. For eukaryotic communities, primers targeting 18S rRNA gene variable regions (e.g., V9 region) may be used [45] [5]. PCR reactions typically contain approximately 10 ng of template DNA, 200 μM of each deoxynucleoside triphosphate, 1.5 mM MgCl₂, 0.3 μM of each primer, and Taq DNA polymerase in the appropriate buffer [5]. Thermal cycling conditions often employ touchdown protocols to enhance specificity, with annealing temperatures decreasing incrementally during initial cycles [5]. The success of amplification is verified by agarose gel electrophoresis before proceeding to DGGE analysis.
DGGE Analysis and Band Separation
The core separation process involves loading PCR products onto a polyacrylamide gel containing a linear gradient of denaturants. Typical gel compositions range from 6%-8% polyacrylamide with a denaturant gradient of 40%-80% (where 100% denaturant contains 7 M urea and 40% formamide) [7] [4]. Electrophoresis is performed at constant temperature (usually 60°C) and voltage (ranging from 75-180 V) for 6-18 hours, depending on the target fragment size and primer set used [7] [4]. Specific conditions must be optimized for different primer sets; for example, primer set 357fGC-907rM targeting the V3-V5 region of 16S rRNA may be run at 100 V for 17 hours with a 40%-80% denaturant gradient, while primers targeting the V3 region alone (357fGC-518r) may use 75 V for 18 hours with the same gradient [4]. The DCode Universal Mutation Detection System (Bio-Rad Laboratories) is commonly used for this separation [7].
Diagram: DGGE Experimental Workflow. The flowchart illustrates the sequential steps in DGGE analysis, from sample collection to data interpretation.
Band Visualization, Excision, and Sequencing
Following electrophoresis, gels are stained with fluorescent nucleic acid dyes (e.g., SYBR Green) or traditional ethidium bromide to visualize the banding patterns. Digitized DGGE images are typically analyzed using specialized software such as Quantity One (Bio-Rad Laboratories) to identify bands occupying the same position across different lanes [7] [4]. For phylogenetic identification, specific bands of interest are carefully excised from the gel using sterile blades or pipette tips. DNA is eluted from the gel fragments and reamplified using the same primers without GC-clamps [7]. The purified PCR products are then ligated into cloning vectors (e.g., pMD19-T Simple Vector) and transformed into competent Escherichia coli cells [7]. Positive clones are screened by DGGE to verify correct migration position before sequencing [7]. The resulting sequences are compared with databases using BLAST alignment, and phylogenetic trees can be constructed using software such as MEGA with neighbor-joining methods and bootstrap analysis [7].
Data Analysis and Interpretation
DGGE fingerprint analysis involves both qualitative and quantitative approaches. Banding patterns are converted into binary matrices (presence/absence) and matrices of relative band intensities, which are then used to calculate similarity coefficients and construct dendrograms using algorithms such as the unweighted-pair group method with average linkages (UPGMA) [7] [4]. Diversity indices, including the Shannon diversity index (H), can be calculated to compare microbial community diversity across different samples or treatments [7]. For temporal studies, DGGE profiles can track succession and dynamics of specific microbial populations, providing insights into community stability and response to environmental changes [29] [44]. The combination of fingerprinting analysis with band sequencing offers a powerful approach to link community structure changes with specific phylogenetic groups.
Table: Common DGGE Primer Sets for Microbial Community Analysis
| Target Organisms | Primer Set | Target Region | Amplicon Size | Application Examples |
|---|---|---|---|---|
| General Bacteria | 341F-GC/518R | 16S rRNA V3 region | ~194 bp | Soil, water, food communities [7] [4] |
| General Bacteria | 357fGC-907rM | 16S rRNA V3-V5 region | ~586 bp | Coastal bacterioplankton [4] |
| Eukaryotic Microbes | Euk1A/Euk516r-GC | 18S rRNA | ~560 bp | Marine picoeukaryotes [5] |
| Eukaryotic Microbes | Euk1209f-GC/Uni1392r | 18S rRNA | ~210 bp | Marine picoeukaryotes [5] |
| Ammonia-Oxidizing Bacteria | CTO189f/CTO654r (nested with 3f-GC/2r) | 16S rRNA | ~193 bp (after nested PCR) | Nitrifying communities [1] |
| Denitrifying Bacteria | nirS/nirK/nosZ specific | Functional genes | ~500 bp | Denitrifier communities [1] |
Applications in Environmental Microbiology
Analysis of Anaerobic Digestion Processes
DGGE has proven particularly valuable for investigating microbial community dynamics in anaerobic digestion systems. Research has demonstrated its utility in tracking microbial shifts under mesophilic and thermophilic anaerobic digestion of dairy manure [29]. In such systems, DGGE analysis revealed that bacterial community structure was significantly affected by temperature conditions and anaerobic incubation time [29]. At the start of digestion (Day 0), sequence similarity confirmed that most bacteria were similar (>95%) to Acinetobacter sp., regardless of temperature conditions [29]. However, after 7 days of incubation, significant divergence occurred based on temperature: reactors at 44°C and 52°C showed communities similar to Coprothermobacter proteolyticus (97% similarity) and Tepidimicrobium ferriphilum (100% similarity), respectively, while reactors at 28°C maintained Acinetobacter-like populations [29]. After 60 days, further specialization was observed with Galbibacter mesophilus (87% similarity) at 28°C, Syntrophomonas curvata (91% similarity) at 36°C, Dielma fastidiosa (86% similarity) at 44°C, and a return to Coprothermobacter proteolyticus (99% similarity) at 52°C [29]. These findings illustrate how DGGE can elucidate temperature-dependent microbial succession in anaerobic processes, providing insights for optimizing biogas production and waste treatment.
Marine and Aquatic Microbial Ecology
In marine microbiology, DGGE has been extensively applied to study bacterioplankton and picoeukaryote communities. Studies of coastal systems have utilized multiple primer sets to analyze seasonal cycles of bacterioplankton composition, with primer set 357fGC-907rM effectively grouping samples according to seasons [4]. For eukaryotic picoplankton in Mediterranean Sea samples, DGGE analysis using 18S rRNA-targeted primers revealed significant differences along vertical profiles, while temporal differences at the same depths were less marked [5]. Sequencing of excised DGGE bands from surface samples identified prasinophytes as the most abundant group, along with prymnesiophytes, novel stramenopiles, cryptophytes, dinophytes, and pelagophytes [5]. These results were consistent with parallel analyses using clone libraries and T-RFLP fingerprinting, validating DGGE as a reliable method for assessing eukaryotic plankton composition [5]. The technique's ability to process multiple samples simultaneously makes it particularly valuable for studies examining spatial and temporal patterns in aquatic environments.
Soil and Rhizosphere Microbiology
DGGE has significantly advanced our understanding of soil microbial communities and their interactions with plants. Analysis of bacterial communities in rhizosphere and bulk soil has been performed using primers 341F-GC and 518R targeting the V3 region of 16S rRNA, with denaturing gradients of 40%-70% [7]. Such approaches have revealed differences in microbial diversity and community structure between rhizosphere and bulk soil compartments. Similarly, DGGE has been instrumental in studying arbuscular mycorrhizal fungi (AMF) communities, despite challenges presented by substantial rRNA gene heterogeneity within individual spores [45]. For the genus Gigaspora, PCR-DGGE analysis of the V9 region of the 18S rRNA gene provided reliable identification of all recognized species within this genus, with specific ribotype patterns differentiating geographic isolates of G. albida, G. gigantea, and G. margarita [45]. The technique has enabled researchers to monitor AMF community dynamics in agricultural soils, revealing, for instance, the dominance of G. margarita within the Gigasporaceae family in certain Brazilian agricultural soils [45].
Applications in Food Microbiology
Monitoring Food Fermentations
PCR-DGGE fingerprinting has become an important tool for monitoring microbial successions during food fermentation processes. The technique has been successfully applied to study the dynamics of microbial communities in various fermented foods, including Italian sausages, cheese, sourdough, and fermented maize dough [44]. In these applications, DGGE enables researchers to track the succession of dominant microbial species throughout the fermentation process, providing insights into the roles of specific microorganisms in product development. For example, analysis of traditional maize fermentations demonstrated that the microbial community transformation is driven by the fermentation process itself rather than the initial raw material composition [44]. Similarly, studies of wine fermentations have utilized DGGE to profile yeast dynamics, revealing complex successional patterns that influence product characteristics [44]. This information is valuable for optimizing starter cultures and fermentation conditions to improve product quality and consistency while maintaining traditional fermentation characteristics.
Food Quality Assessment and Authentication
DGGE has emerged as a powerful method for food quality assessment and authentication. The specific microbial fingerprint of a food product at a given time point can serve as a characteristic trait, similar to biochemical, structural, or sensorial properties [44]. This approach has been used to differentiate food products based on their microbial signatures, enabling origin assessment and quality control. For instance, DGGE analysis has been applied to distinguish between traditional and industrial fermentation processes, identify the presence of specific beneficial or spoilage microorganisms, and detect adulteration or misrepresentation of food products [44]. In dairy products, PCR-DGGE has been used to analyze the yeast populations in raw milk, providing insights into milk quality and potential spoilage issues [44]. The technique's ability to provide rapid snapshots of the microbial community makes it particularly valuable for quality control applications in food production facilities.
Detection and Identification of Foodborne Microbes
The application of DGGE for differentiation and identification of bacterial species isolated from food has provided an alternative to traditional cultivation-based methods [44]. Analysis of the amplified variable V3 region of the 16S rDNA has been used to differentiate and identify lactic acid bacteria and other microorganisms isolated from various food products [44]. This approach allows for rapid screening of microbial isolates without the need for extensive biochemical testing. Additionally, the technique can be used to rapidly assess the diversity of cultivable bacterial communities by collecting colonies from plates in "bulks" and subjecting them to DNA extraction and PCR-DGGE analysis [44]. This method facilitates investigation of the cultivable community from different culture media, dilutions, and incubation conditions, providing a more efficient approach to microbial community analysis compared to traditional isolation and identification methods.
The Scientist's Toolkit: Essential Research Reagents and Materials
Table: Key Research Reagent Solutions for DGGE Analysis
| Reagent/Material | Specification | Function/Application |
|---|---|---|
| PCR Primers with GC Clamp | 35-40 nt GC-rich sequence at 5'-end | Prevents complete denaturation of PCR products during DGGE |
| Denaturants | Urea (7 M) and Formamide (40%) | Creates chemical gradient for DNA denaturation (100% denaturant solution) |
| Polyacrylamide Gel | 6%-8% concentration | Provides sieving matrix for DNA separation |
| DNA Extraction Kit | Lysozyme, proteinase K, SDS | Efficient cell lysis and nucleic acid purification from complex samples |
| Cloning Vector | pMD19-T Simple Vector | TA cloning of reamplified DGGE bands for sequencing |
| Competent Cells | Escherichia coli DH5α | Transformation and propagation of cloned sequences |
| Sequence Analysis Software | MEGA, BLAST | Phylogenetic analysis and sequence identification |
| Gel Analysis Software | Quantity One (Bio-Rad) | Digitization and analysis of DGGE banding patterns |
Technical Considerations and Limitations
Potential Pitfalls and Optimization Strategies
Despite its widespread utility, DGGE analysis presents several technical challenges that require careful consideration. One significant limitation is the presence of multiple melting domains in certain target genes, such as functional genes including nirS, nirK, and nosZ in denitrifying bacteria, which can hamper band resolution and result in cloudy bands [1]. This challenge can be partially addressed by using shorter, GC-clamped fragments and optimizing gradient conditions [1]. Another consideration is the potential for multiple sequences to exhibit similar mobility characteristics, potentially leading to co-migration of different sequences in single bands [1]. Bias may also be introduced during sampling, DNA extraction, and PCR amplification, particularly when dealing with complex matrices like food products [44]. The number of PCR cycles should be minimized to reduce potential artifacts, and the DNA polymerase choice should be considered carefully [44]. Additionally, the technique typically detects only the most abundant populations in a community (generally those representing >1% of the population), potentially missing rare community members [44]. Despite these limitations, proper optimization and validation can make DGGE a highly valuable tool for microbial community analysis.
Comparison with Alternative Molecular Methods
DGGE occupies an important niche among molecular techniques for microbial community analysis, offering distinct advantages and disadvantages compared to other methods. While clone library construction and sequencing provide more comprehensive phylogenetic information, these approaches are more time-consuming and less suitable for processing large sample numbers [5]. In comparison, DGGE offers the best compromise between the number of samples processed and the information generated [29] [5]. When compared with other fingerprinting techniques such as T-RFLP, DGGE has the advantage that bands can be excised and sequenced directly, providing phylogenetic information without the need for clone library construction [1]. However, DGGE may have lower resolution than some sequencing-based approaches and can be affected by the limitations described above. The choice of method should be guided by research objectives, sample number, and required resolution. For many applications, a combination of approaches may be most effective, such as using DGGE for initial screening of multiple samples followed by more detailed analysis of selected samples via sequencing.
Denaturing Gradient Gel Electrophoresis remains a powerful and versatile technique for analyzing microbial communities in environmental and food samples. Its ability to provide rapid, reproducible fingerprints of complex microbial populations has made it invaluable for studying community dynamics across diverse habitats. When combined with band excision and sequencing, DGGE offers unique insights into both the structure and composition of microbial ecosystems. While newer sequencing technologies continue to evolve, DGGE maintains relevance due to its cost-effectiveness, rapid turnaround time, and capacity for processing multiple samples simultaneously. As demonstrated through its applications in environmental monitoring, food quality assessment, and microbial ecology research, DGGE provides a robust methodological framework for addressing fundamental questions about microbial community organization and dynamics.
Mutation Detection in Biomedical Research Applications
Denaturing Gradient Gel Electrophoresis (DGGE) represents a powerful electrophoretic technique employed for the detection of single-base variations and other subtle mutations within DNA sequences. This method operates on the fundamental principle that DNA duplexes with differing nucleotide sequences exhibit distinct melting behaviors under denaturing conditions. In biomedical research and drug development, identifying genetic mutations is crucial for understanding disease mechanisms, developing diagnostic markers, and personalizing therapeutic interventions. DGGE provides researchers with a highly sensitive tool to screen for genetic polymorphisms without resorting to full-scale sequencing, thereby optimizing resource allocation in experimental workflows.
The technique was originally developed to identify single-nucleotide polymorphisms (SNPs) and small insertions or deletions in DNA and has since been adapted for various applications in microbial ecology, clinical diagnostics, and genetic research [1]. Its exceptional sensitivity—reportedly capable of detecting "virtually all mutations in a given piece of DNA"—makes it particularly valuable for genetic screening programs where comprehensive mutation detection is required [1]. When combined with modern molecular approaches, DGGE serves as a robust method for mutation detection in complex biological samples.
Fundamental Principles of DGGE
Theoretical Basis: Melting Domains and DNA Denaturation
The operational foundation of DGGE rests on the melting behavior of DNA molecules. When double-stranded DNA is subjected to increasing denaturing conditions (typically a gradient of urea and formamide or a temperature gradient), it does not denature uniformly at once. Instead, the molecule melts in discrete segments known as melting domains, which are stretches of 50-300 base pairs with relatively uniform melting temperatures (Tm) [1]. The Tm of each domain is sequence-dependent; even a single base pair change can alter the melting temperature of a domain, thereby changing the electrophoretic mobility of the molecule at a specific denaturant concentration.
As DNA fragments migrate through a polyacrylamide gel with an increasing gradient of denaturants, they initially move according to molecular weight. However, when a fragment reaches a denaturant concentration that corresponds to the Tm of its lowest melting domain, that domain begins to undergo partial strand separation [1]. This branching structure dramatically reduces the fragment's mobility through the gel matrix. Different DNA sequences will therefore halt at different positions in the gel, creating a band pattern that reflects sequence variations rather than merely size differences [1] [10].
The Critical Role of GC-Clamping
A significant technical refinement in DGGE methodology is the implementation of GC-clamping. Without this modification, a DNA fragment comprising a single melting domain would denature completely and diffuse away upon reaching its Tm. The innovation of attaching a 30-50 base pair GC-rich sequence to one end of the DNA fragment via PCR primer design creates an artificial high-temperature melting domain [1].
This GC-clamp serves two essential functions: First, it prevents complete strand separation by maintaining a double-stranded "anchor" even when the target domains have melted. Second, through stacking interactions with neighboring bases, it can help convert multiple melting domains in the target fragment into what effectively behaves as a single melting domain, thereby enhancing mutation detection sensitivity [1]. The presence of a GC-clamp is essential for achieving the nearly 100% mutation detection rate that makes DGGE particularly valuable for genetic screening applications.
Experimental Protocol: DGGE for Mutation Detection
Sample Preparation and PCR Amplification
The initial phase of DGGE involves careful preparation of target DNA sequences through polymerase chain reaction (PCR) amplification. Approximately 10 ng of extracted DNA template is typically used in a 50 μL PCR reaction mixture containing standard components: deoxynucleoside triphosphates (200 μM each), MgCl₂ (1.5 mM), primers (0.3 μM each), Taq DNA polymerase (2.5 U), and the appropriate PCR buffer [5].
Critical to DGGE success is the design of GC-clamped primers. One primer in the pair should include a 40-nucleotide GC-rich sequence at its 5′-end, which will be incorporated into the PCR product [1]. For bacterial community analysis targeting the 16S rRNA gene, primers such as 341F-GC and 518R have been successfully employed [7]. The amplification conditions must be optimized for each specific target, but generally include an initial denaturation step (94°C for 1-2 minutes), followed by 30-35 cycles of denaturation (94°C for 30-60 seconds), annealing (primer-specific temperature for 45-60 seconds), and extension (72°C for 1-2 minutes) [5].
Table 1: Example PCR Components and Conditions for DGGE
| Component | Concentration/Amount | Notes |
|---|---|---|
| DNA Template | 10 ng | Quality affects amplification efficiency |
| dNTPs | 200 μM each | Balanced concentration critical |
| MgCl₂ | 1.5 mM | Optimization may be needed |
| Primers | 0.3 μM each | One with GC-clamp |
| Taq Polymerase | 2.5 U | High-fidelity versions preferred |
| Initial Denaturation | 94°C, 1-2 min | Complete strand separation |
| Cycling | 30-35 cycles | Avoid excessive cycles |
| Final Extension | 72°C, 5-10 min | Complete synthesis |
Gel Electrophoresis and Analysis
Following PCR amplification, products are separated using denaturing gradient gel electrophoresis. Polyacrylamide gels are prepared with a denaturing gradient; a typical range is 40-70%, where 100% denaturant contains 7 M urea and 40% formamide [7]. The gradient orientation should be parallel to the direction of electrophoresis.
Similar amounts of PCR products (typically 15-30 μL) are loaded into wells, and electrophoresis is performed using equipment such as the DCode Universal Mutation Detection System (Bio-Rad Laboratories) [7]. Running conditions commonly employ a constant voltage of 180 V for approximately 6 hours, though these parameters may require optimization based on specific experimental needs [7]. For enhanced mutation detection, a heteroduplexing step is recommended after PCR amplification, involving one round of denaturation (95°C for 5 minutes) and reannealing (55°C for 45 minutes) [1]. This process generates heteroduplex molecules in samples containing heterozygotes or mixed populations, which melt more readily than homoduplexes and thus improve detection sensitivity.
After electrophoresis, gels are stained with DNA-binding dyes (such as SYBR Green or ethidium bromide) and visualized under appropriate lighting. Analysis can be performed using software such as Quantity One (Bio-Rad Laboratories) [7]. Band patterns can be clustered using algorithms like UPGMA to assess similarity between samples [7].
Essential Reagents and Equipment
Successful implementation of DGGE requires specific research reagents and specialized equipment. The following table summarizes key solutions and materials essential for performing DGGE experiments:
Table 2: Essential Research Reagents and Equipment for DGGE
| Item | Function/Application | Examples/Specifications |
|---|---|---|
| GC-clamped Primers | PCR amplification with attached GC-rich sequence | 341F-GC, Euk1A, primer-specific sequences |
| Denaturants | Create chemical gradient in gels | Urea (7 M), Formamide (40%) for 100% solution |
| Polyacrylamide Gel | Matrix for electrophoretic separation | Typically 6-8% acrylamide concentration |
| Electrophoresis System | Platform for DGGE separation | DCode System (Bio-Rad) or equivalent |
| DNA Stain | Visualization of separated bands | SYBR Green, ethidium bromide, silver staining |
| Cloning Vector | Sequencing of excised bands | pMD19-T Simple Vector (TaKaRa) |
| Competent Cells | Transformation for sequencing | E. coli DH5α competent cells |
| Analysis Software | Band pattern quantification and comparison | Quantity One (Bio-Rad) |
DGGE Workflow and Data Analysis
The complete DGGE process follows a logical sequence from sample preparation through data interpretation. The workflow integrates molecular biology techniques with bioinformatics analysis to generate meaningful biological insights.
Band Excision and Sequencing
Following electrophoresis and visualization, bands of interest can be excised from the gel for further analysis. This process involves carefully cutting out the band with a clean scalpel or razor blade while visualizing under UV light, eluting the DNA from the gel fragment, and re-amplifying using the original primers [7]. The purified PCR products are then ligated into a cloning vector, such as the pMD19-T Simple Vector, and transformed into competent E. coli cells [7]. Positive clones are amplified with the same GC-clamped primers and verified by DGGE to confirm correct migration position before selecting clones for sequencing [7].
Bioinformatics and Data Interpretation
Sequencing results are analyzed through alignment tools such as BLAST to identify homologous sequences in databases [7]. For phylogenetic analysis, sequences can be aligned with related references, and phylogenetic trees constructed using methods like neighbor-joining with bootstrap validation (e.g., 1000 replicates) in software packages such as MEGA [7]. For microbial community analyses, diversity indices like the Shannon diversity index (H) can be calculated to quantify community diversity based on DGGE band patterns [7].
Applications in Biomedical Research
DGGE has been successfully implemented across diverse research domains, demonstrating its versatility as a mutation detection tool:
Microbial Community Analysis: DGGE has been employed to study bacterial community dynamics in various environments, including soil, marine ecosystems, and engineered systems like anaerobic digesters [5] [10]. The technique enables researchers to monitor spatial and temporal changes in microbial populations without the need for culturing.
Clinical Mutation Screening: The high sensitivity of DGGE for single-nucleotide polymorphisms makes it valuable for identifying mutations associated with genetic disorders, cancer, and other diseases [1]. Its ability to detect heterozygotes through heteroduplex formation is particularly advantageous for clinical diagnostics.
Microbial Shift Monitoring: Recent applications include tracking microbial community changes in response to environmental perturbations. For example, DGGE has been used to analyze bacterial shifts in manure under different anaerobic digestion temperatures, revealing temperature-dependent community restructuring [10].
Biodiversity Assessment: In environmental microbiology, DGGE provides a rapid method for comparing microbial diversity across different habitats or treatment conditions, serving as a molecular fingerprinting technique for complex ecosystems [1] [10].
The applications of DGGE continue to expand as researchers adapt the methodology to new scientific questions, particularly those requiring sensitive detection of sequence variations in complex DNA mixtures.
Solving Common DGGE Challenges: Artifact Reduction and Performance Enhancement
Within the framework of denaturing gradient gel electrophoresis (DGGE) protocol research, optimal sample handling is a critical prerequisite for obtaining reliable and reproducible results. DGGE is a powerful molecular fingerprinting technique that separates polymerase chain reaction (PCR)-generated DNA fragments of the same length but different sequences, based on their differential melting behaviors in a gradient of chemical denaturants [2] [46]. This ability to detect single-nucleotide polymorphisms makes DGGE invaluable for analyzing microbial community diversity, monitoring population shifts, and identifying genetic mutations in fields ranging from microbial ecology to clinical diagnostics [29] [15] [47]. However, the sensitivity of the technique means that the integrity of the initial sample and the quality of the extracted nucleic acids are paramount. Inconsistent sample handling, inappropriate homogenization, or suboptimal starting material can introduce biases that compromise downstream analyses, including PCR amplification and the resulting DGGE banding patterns [30] [48]. This application note provides detailed methodologies for sample preparation, focusing on weight considerations and homogenization techniques, to ensure data integrity throughout the DGGE workflow.
Core Principles of DGGE
The fundamental principle of DGGE relies on the electrophoretic mobility of partially melted double-stranded DNA molecules in a polyacrylamide gel containing a linear gradient of denaturants (urea and formamide) [2] [46] [47]. As DNA fragments migrate through this gradient, they begin to denature at sequence-specific points, causing a sharp decrease in mobility. To prevent complete strand dissociation, which would lead to a loss of resolution, a GC-rich sequence (GC clamp) is attached to one end of the PCR amplicon during amplification [2] [29] [47]. This clamp remains double-stranded, anchoring the fragment and allowing separation based on sequence variation within the lower melting domains. The resulting banding pattern provides a genetic fingerprint of the sample, where each band can represent a different microbial species or a distinct genetic variant [46] [30]. The fidelity of this fingerprint is entirely dependent on the representative nature of the initial DNA sample, making proper sample handling and homogenization the first and most critical step in the protocol.
Table 1: Key Reagents and Their Functions in DGGE Sample Preparation
| Reagent/Material | Function | Key Considerations |
|---|---|---|
| Acrylamide/Bis-acrylamide | Forms the porous matrix of the polyacrylamide gel for separation [34]. | Typically used at 6-8% concentration; ratio of 37.5:1 or 40:1 [34] [15]. |
| Urea and Formamide | Chemical denaturants that define the gradient in the gel [2] [34]. | 100% denaturant is 7 M urea and 40% (v/v) formamide [34] [15]. |
| TAE Buffer | Electrophoresis buffer providing ionic strength and pH control [34]. | Used at 0.5x concentration for gel preparation and running buffer [34]. |
| GC-clamped Primers | PCR primers with a 30-40 bp GC-rich tail [2] [29]. | Prevents complete strand dissociation, crucial for resolution [2] [47]. |
| Proteinase K | Enzyme for lysing cells and degrading nucleases during DNA extraction [30]. | Essential for breaking down rigid cell walls (e.g., in Gram-positive bacteria, fungi) [15]. |
Sample Collection and Weight Considerations
The accuracy of DGGE analysis begins at the sample collection stage. The quantity of starting material must be carefully calibrated to ensure sufficient DNA yield without introducing PCR inhibitors that can be co-extracted from overly concentrated samples.
Determining Optimal Sample Weight
The ideal sample weight is highly dependent on the sample type and its cellular density. For environmental samples like soil or sediment, smaller weights (0.25 g to 0.5 g) are often sufficient due to high microbial density [30]. For less dense materials such as plant tissue or manure, larger weights (1-2 g) may be required. A critical practice is to maintain consistency in sample weight across replicates and experimental conditions to enable meaningful comparative analysis. Excess sample can lead to incomplete homogenization, inefficient cell lysis, and co-purification of inhibitory substances like humic acids (in soil) or polysaccharides (in plants), which can subsequently inhibit PCR amplification [30]. Preliminary trials to establish a relationship between sample weight and DNA yield/purity are strongly recommended.
Sample Preservation and Storage
To preserve the in-situ microbial community or nucleic acid integrity, samples should be processed immediately after collection. If immediate processing is not feasible, samples must be flash-frozen in liquid nitrogen and stored at -80°C. For certain sample types, preservation in RNA-stabilizing solutions may be necessary if downstream RNA-based analyses (e.g., RT-PCR-DGGE) are planned.
Table 2: Recommended Sample Weights for Various Sample Types in DGGE Analysis
| Sample Type | Recommended Wet Weight | Rationale & Notes |
|---|---|---|
| Soil/Sediment | 0.25 - 0.5 g | High microbial load; excess weight increases inhibitor co-extraction. |
| Water Biomass | 0.1 - 0.5 g (pellet) | Weight after filtration and centrifugation; highly variable. |
| Plant Tissue | 1.0 - 2.0 g | Low microbial density; requires rigorous disruption. |
| Manure/Sludge | 0.5 - 1.0 g | Heterogeneous matrix; sub-sampling must be representative. |
| Microbial Cultures | 10^7 - 10^8 cells | Standardized by cell count for highest consistency. |
| Clinical Swabs | N/A | Elute in buffer; volume is more relevant than weight. |
Homogenization Techniques for DGGE
The primary goal of homogenization in DGGE sample preparation is to achieve complete cell lysis and release of nucleic acids in a manner that is both representative of the entire sample and non-destructive to DNA. The choice of technique depends on the sample's physical and biological characteristics.
Bead Milling
Bead milling is highly effective for tough samples like soil, sediment, and microbial biofilms. This method involves agitating the sample in a tube with small, abrasive beads (e.g., zirconia/silica) using a high-speed homogenizer. The shearing and grinding forces generated by the beads physically disrupt cell walls.
Protocol: Bead Milling for Soil Samples
- Weigh 0.5 g of soil into a sterile, reinforced tube.
- Add Lysis Buffer: 750 µL of a standard lysis buffer (e.g., containing Tris, EDTA, and NaCl).
- Add Beads: Add ~0.5 g of a mixture of 0.1 mm and 1.0 mm diameter beads.
- Homogenize: Securely cap the tube and process in a bead beater at high speed for 30-45 seconds.
- Cool: Place the tube on ice for 2-3 minutes to dissipate heat.
- Repeat: Repeat the homogenization and cooling cycle 2-3 times for complete lysis.
- Centrifuge: Centrifuge at 14,000 x g for 5 minutes to pellet debris and beads.
- Recover: Carefully transfer the supernatant containing nucleic acids to a new tube.
Cryogenic Grinding
For samples rich in nucleases or tough, fibrous materials like plant tissue and certain animal wastes, cryogenic grinding is the method of choice. The sample is frozen with liquid nitrogen, which makes it brittle and halts nuclease activity, allowing it to be pulverized into a fine powder.
Protocol: Cryogenic Grinding for Plant Tissue
- Freeze: Submerge 1-2 g of fresh plant tissue in a mortar containing liquid nitrogen. Wait until boiling stops.
- Grind: Using a pre-cooled pestle, grind the tissue vigorously to a fine powder. Keep the mortar topped up with liquid nitrogen to prevent thawing.
- Transfer: Use a pre-cooled spatula to transfer the powdered tissue to a tube containing pre-warmed lysis buffer.
- Proceed: Immediately proceed with the standard DNA extraction protocol.
Ultrasonication
Ultrasonication utilizes high-frequency sound waves to create cavitation bubbles in a liquid sample, producing intense shear forces that disrupt cell membranes. It is particularly useful for liquid samples and bacterial cultures, but care must be taken as it can shear genomic DNA into small fragments if over-applied.
Protocol: Ultrasonication for Bacterial Cultures
- Harvest: Pellet 10^8 bacterial cells by centrifugation.
- Resuspend: Resuspend the pellet in 1 mL of lysis buffer.
- Sonicate: Immerse an ultrasonic probe into the sample. Apply short pulses (e.g., 5-10 seconds) at low-to-medium power output.
- Cool: Keep the sample on ice between pulses to prevent overheating.
- Cycle: Repeat pulse/cool cycles 3-5 times until the lysate clarifies.
- Clarify: Centrifuge to remove cell debris before DNA purification.
Diagram 1: DGGE Workflow from Sample to Analysis. The workflow begins with sample collection, followed by selection of a homogenization method appropriate to the sample matrix, which critically influences downstream DNA quality and DGGE results.
Integrated DGGE Protocol: From Homogenization to Electrophoresis
This section integrates the sample handling steps into a complete, actionable protocol for DGGE analysis of a complex environmental sample, such as soil or manure.
Sample Lysis and DNA Extraction
- Homogenize: Following the bead milling protocol in Section 4.1, homogenize 0.5 g of soil.
- Purify DNA: From the cleared lysate, purify genomic DNA using a commercial soil DNA extraction kit or a standard phenol-chloroform extraction followed by ethanol precipitation [30].
- Quantify and Assess Purity: Measure DNA concentration using a spectrophotometer (e.g., Nanodrop). Ensure the A260/A280 ratio is ~1.8 and the A260/A230 ratio is >2.0, indicating minimal protein and organic contaminant carryover, respectively.
PCR Amplification with GC-Clamp
- Prepare Reaction Mixture (50 µL total volume):
- 5 µL 10X PCR Buffer
- 1.5 mM MgCl₂
- 0.2 mM of each dNTP
- 0.16 µM of each primer (e.g., GC-338F and 518R for bacterial 16S rRNA gene V3 region) [30]
- 1.25 U DNA Taq Polymerase
- 20-50 ng of template DNA
- PCR-grade water to 50 µL
- Amplify using the following thermocycling conditions:
- Initial Denaturation: 95°C for 5 min
- 35 Cycles: 95°C for 30 sec, 55-65°C (primer-specific) for 45 sec, 72°C for 1 min
- Final Extension: 72°C for 7 min
- Verify Amplicons: Check 5 µL of the PCR product on a 1% agarose gel for a single band of the expected size.
DGGE Gel Casting and Electrophoresis
This protocol is adapted for a standard DCODE (Bio-Rad) system [34].
- Prepare Denaturant Solutions:
- Low Denaturant Solution (e.g., 30%): 6 ml 100% UF Stock (9% acrylamide, 42% urea, 40% formamide in 0.5x TAE) + 10.2 ml 9% acrylamide solution.
- High Denaturant Solution (e.g., 60%): 12 ml 100% UF Stock + 4.8 ml 9% acrylamide solution.
- Cast the Gradient Gel:
- Assemble the gel cassette and place it on the casting stand.
- Add 65 µL of 10% APS and 3.3 µL TEMED to each denaturant solution, mix gently.
- Pour the low and high concentration solutions into the respective chambers of a gradient mixer.
- Open the valves and allow the gradient to fill the cassette slowly.
- Allow the gel to polymerize for at least 1 hour.
- Run the Gel:
- Post-Electrophoresis Analysis:
Troubleshooting and Quality Control
Even with optimized protocols, challenges can arise. The table below outlines common issues related to sample handling and their solutions.
Table 3: Troubleshooting Guide for Sample Handling in DGGE
| Problem | Potential Cause | Solution |
|---|---|---|
| Smearing in DGGE gel | DNA shearing during harsh homogenization. | Use gentler lysis methods; avoid over-prolonged sonication or bead beating. |
| Faint or no bands | Inhibitors co-extracted due to excessive sample weight; inefficient cell lysis. | Reduce sample weight; incorporate a more rigorous homogenization technique; use purification kits designed for inhibitor removal. |
| Non-reproducible banding patterns | Inconsistent homogenization across samples; variable starting weights. | Standardize sample weight and homogenization time/power; use an internal standard. |
| High background staining | Incomplete removal of proteins or other contaminants. | Include a proteinase K digestion step and/or a phenol-chloroform purification. |
The reproducibility and resolution of DGGE analysis are fundamentally dependent on the initial steps of sample handling. Strict adherence to consistent weighing protocols and the selection of an appropriate, well-executed homogenization technique are not merely preliminary steps but the foundation of reliable data. The methodologies outlined herein—ranging from bead milling for resilient matrices to cryogenic grinding for nuclease-rich samples—provide a clear framework for researchers to optimize their DGGE workflows. By integrating these sample preparation standards with a robust DGGE electrophoresis protocol, researchers can minimize technical variability and ensure that the resulting genetic fingerprints accurately reflect the biological system under investigation.
In the context of denaturing gradient gel electrophoresis (DGGE) research, the integrity of the resulting microbial community profile is entirely dependent on the quality of the initial polymerase chain reaction (PCR) amplification. PCR artifacts—such as chimeras, base substitutions, insertions, and deletions—can distort the true genetic fingerprint of a sample, leading to an inaccurate representation of biodiversity and erroneous conclusions in molecular microbial ecology studies [50] [51]. These artifacts are of particular concern in DGGE protocols, where the goal is to separate DNA fragments of identical length but differing sequences based on their melting behavior [10]. Even minor amplification errors can generate spurious bands on a DGGE gel or obscure genuine ones, directly compromising the interpretation of the data [51]. This application note details targeted strategies, grounded in experimental data, to mitigate these artifacts through the strategic selection of DNA polymerases and the optimization of amplification parameters, thereby enhancing the fidelity and reliability of DGGE analyses.
Experimental Protocols for Artifact Reduction
Comparative Fidelity Analysis of DNA Polymerases
Objective: To systematically evaluate different DNA polymerases for their propensity to generate PCR artifacts, thereby identifying the most suitable enzymes for high-fidelity amplification prior to DGGE analysis.
Background: Different DNA polymerases possess varying intrinsic error rates due to differences in their proofreading (3'→5' exonuclease) activity. The use of a high-fidelity polymerase is critical for minimizing amplification errors that manifest as false bands or smearing in DGGE profiles [50] [52].
Materials:
- Mock Community DNA: A standardized plasmid DNA mixture containing known sequences from 40 microalgal species [50].
- PCR Kits: A panel of 14 different PCR kits, including those containing proofreading and non-proofreading polymerases. Kits with KOD plus Neo (TOYOBO) and HotStart Taq DNA polymerase (BiONEER) are recommended for inclusion based on prior data [50].
- Primers: Target-specific primers (e.g., for the 18S rRNA gene or the V3 region of the 16S rRNA gene), with a GC-clamp attached to one primer for DGGE analysis [10] [53].
- Thermal Cycler
- High-Through Sequencing Platform: For analyzing the PCR products.
Methodology:
- PCR Setup: Prepare amplification reactions for the mock community DNA template using each of the 14 PCR kits according to the manufacturers' instructions. Utilize a standardized annealing temperature of 65°C to minimize variance introduced by cycling conditions [50].
- Amplification: Perform PCR using a standardized cycle count determined to be within the exponential phase of amplification (typically 25-35 cycles) to avoid saturation, which can exacerbate artifacts.
- Product Analysis: Purity the PCR products and subject them to high-throughput amplicon sequencing.
- Data Quantification: Analyze the sequence data to quantify the following seven parameters for each polymerase:
- Chimera Formation: The percentage of chimeric sequences generated during amplification.
- Base Substitution Rate: The frequency of incorrect nucleotide incorporations.
- Insertion/Deletion (Indel) Rate: The frequency of single-base insertions and deletions.
- Blast Top Hit Accuracy: The percentage of sequences that correctly match the expected reference sequences.
- Amplification Bias: The deviation from the expected equimolar representation of all species in the mock community.
- Overall Quality Score: A composite score based on sequence quality metrics.
Expected Outcomes: The analysis will reveal statistically significant differences (p < 0.05) across all seven parameters depending on the polymerase used [50]. Kits with inherent proofreading capabilities are expected to demonstrate lower error rates across most metrics.
Cycle Number Optimization Protocol
Objective: To determine the optimal number of PCR cycles that balances sufficient product yield for DGGE analysis with the minimization of artifact formation, particularly chimeras and spurious bands.
Background: Excessive PCR cycles can lead to the accumulation of late-cycle artifacts, including primer-dimers and chimera formation, as the reaction enters the plateau phase and available reagents are depleted [52]. These artifacts can create diffuse smearing or extra bands in DGGE, complicating the fingerprint pattern.
Materials:
- Template DNA: Genomic DNA extracted from an environmental sample (e.g., dairy manure for anaerobic digestion studies) [10].
- PCR Reagents: A selected high-fidelity master mix, primers targeting the 16S rRNA gene with a GC-clamp.
- Thermal Cycler
- Gel Electrophoresis System: For quantifying yield and checking product purity.
Methodology:
- Reaction Setup: Prepare a master PCR mixture and aliquot it into a series of 8 identical tubes.
- Amplification: Place all tubes in the thermal cycler and run the PCR protocol. Remove one tube from the thermal cycler at the end of cycles 20, 25, 28, 30, 32, 35, 38, and 40.
- Product Quantification: Analyze the products from each cycle point by gel electrophoresis to assess yield and check for the presence of smearing or primer-dimer.
- DGGE Analysis: Run an equal mass of PCR product from each cycle point on a DGGE gel to visualize the profile complexity and the emergence of spurious bands at higher cycle numbers.
- Optimal Cycle Determination: Identify the cycle number that provides a robust and clean DGGE fingerprint without a significant increase in background smearing or extra bands. This is typically the latest cycle before the plateau phase where the fingerprint pattern stabilizes.
Data Presentation and Analysis
Quantitative Comparison of Polymerase Fidelity
The following table summarizes hypothetical quantitative data from a polymerase fidelity analysis, illustrating the type of results generated from the protocol in Section 2.1. The data demonstrates the clear performance advantages of proofreading polymerases.
Table 1: Comparative analysis of PCR artifacts generated by different DNA polymerases using a mock eukaryotic community DNA template. Data is representative of results described in [50].
| Polymerase Type | Example Enzyme | Proofreading Activity | Chimera Formation (%) | Base Substitution (per 10kb) | Top Hit Accuracy (%) | Amplification Bias (CV%) |
|---|---|---|---|---|---|---|
| Non-Proofreading | Standard Taq | No | 1.8 - 4.2 | 15 - 30 | 85 - 92 | 25 - 40 |
| Hot-Start | HotStart Taq | No | 0.9 - 1.5 | 12 - 20 | 92 - 96 | 15 - 25 |
| High-Fidelity | KOD plus Neo | Yes | 0.5 - 0.8 | 3 - 8 | 98 - 99.5 | 8 - 12 |
Impact of PCR Cycle Number on Artifact Formation
The optimization of cycle number is a critical, yet often overlooked, factor. The table below outlines the effects of varying cycle numbers on product quality and DGGE readability.
Table 2: Effect of PCR cycle number on product yield and artifact formation.
| PCR Cycle Number | Product Yield | Chimera Potential | DGGE Profile Clarity | Recommended Use |
|---|---|---|---|---|
| 20 - 25 | Low | Very Low | Faint but clean bands | Quantitative applications |
| 28 - 32 | High | Low | Optimal, sharp bands | Routine DGGE analysis |
| 35 - 40 | Saturated | High | Increased smearing/spurious bands | Avoid for DGGE |
The Scientist's Toolkit: Research Reagent Solutions
Selecting the correct reagents is fundamental to successfully implementing the protocols above and achieving artifact-free amplification for DGGE.
Table 3: Essential reagents for minimizing PCR artifacts in DGGE workflows.
| Reagent | Function & Importance | Key Considerations |
|---|---|---|
| High-Fidelity DNA Polymerase | Catalyzes DNA synthesis with high accuracy due to 3'→5' proofreading activity, drastically reducing substitution and indel errors [50] [52]. | Look for enzyme blends (e.g., Taq + proofreading polymerase) for robust amplification of long or difficult templates. KOD plus Neo is a strong performer [50]. |
| Hot-Start Polymerase | Remains inactive until a high-temperature step, preventing non-specific priming and primer-dimer formation at room temperature [52]. | Available as antibody-mediated or chemically modified. Improves specificity and yield in both standard and high-fidelity PCR [50] [52]. |
| GC-Rich Solution Enhancers | Stabilizes DNA template secondary structure and improves polymerase processivity through GC-rich regions, common in many rRNA genes. | Critical for efficient amplification of templates with high GC-content and for stabilizing the GC-clamp on primers [10] [53]. |
| Ultra-Pure dNTPs | Building blocks for DNA synthesis. Impurities can reduce polymerase fidelity and efficiency. | Use balanced, high-purity dNTP solutions to prevent misincorporation errors. |
| PCR-Grade Water | Nuclease-free water to prevent degradation of primers, template, and PCR products. | Essential for maintaining reagent integrity and avoiding non-specific amplification. |
Experimental Workflow for DGGE-PCR Optimization
The following diagram illustrates the integrated experimental workflow for addressing PCR artifacts, from polymerase selection and cycle optimization to the final DGGE analysis.
Diagram 1: A workflow for optimizing PCR to minimize artifacts for DGGE analysis. Key decision points (green nodes) and analytical steps (blue and red nodes) are highlighted to ensure a high-fidelity final result.
Primer and Fragment Modification to Improve Mutation Detection
Denaturing gradient gel electrophoresis (DGGE) represents one of the most powerful methods for comprehensive mutation detection currently available, with sensitivity approaching 100% for identifying single base pair changes [54] [55]. However, successful application of this technique hinges critically on appropriate selection and modification of PCR fragments and primers [33]. This application note details practical strategies for optimizing fragment selection and primer design to enhance mutation detection efficiency while minimizing the number of amplicons required. Within the broader context of DGGE protocol research, these methodologies extend the utility of DGGE by achieving maximum mutation detection capability with streamlined experimental workflows.
Denaturing gradient gel electrophoresis separates DNA fragments based on their melting behavior in a gradient of chemical denaturants (typically formamide and urea). DNA fragments migrate through this gradient until they reach a denaturant concentration that causes partial melting of the double helix, dramatically reducing electrophoretic mobility. Single base pair substitutions can alter the melting temperature (Tm) of a DNA domain, causing mutant fragments to halt at different positions in the gel compared to wild-type sequences [56].
A critical concept in DGGE optimization is that DNA fragments comprise one or more melting domains—stretches of 50-300 base pairs with relatively uniform melting temperature [55]. For optimal separation, the fragment of interest should be within the domain with the lowest melting temperature. When more than one melting domain is present, conventional approaches require dividing the fragment into several smaller amplicons, but strategic modifications can often circumvent this necessity [33].
Primer and Fragment Design Strategies
GC-Clamp Addition
The most significant modification for improving DGGE detection sensitivity involves adding a GC-rich sequence (GC-clamp) to one primer during amplification [57]. This 30-40 base pair G+C-rich segment creates a high-temperature melting domain that prevents complete strand dissociation, allowing detection of mutations that would otherwise remain undetected.
Table 1: GC-Clamp Design Specifications
| Parameter | Specification | Rationale |
|---|---|---|
| Length | 30-40 base pairs | Creates stable high-Tm domain |
| GC Content | ≥60% | Prevents complete strand dissociation |
| Positioning | 5' end of one primer | Allows natural fragment melting |
| Attachment | Via PCR primer | Eliminates need for separate cloning steps |
Melting Domain Optimization
Strategic modifications to PCR fragments and primer sequences can substantially reduce the number of amplicons required for comprehensive analysis:
- Fragment selection: Plotting natural melting curves of fragments without GC-clamps explains why theoretically perfect fragments sometimes fail to reveal mutations in practice [33]
- T/A or G/C tail additions: Simple primer modifications involving addition of specific nucleotide tails can improve detection of mutations that originally remained undetected [33]
- Domain adjustment: Alternative fragment selection can optimize melting profiles without requiring additional amplicons
Handling GC-Rich Targets
For DNA fragments very rich in G and C bases, mutations may escape detection with standard DGGE. In these challenging cases, a combined DGGE and constant denaturant gel electrophoresis (CDGE) approach provides enhanced detection capability [57]. This combination offers the advantages of both methods—good separation of heteroduplex molecules while preventing complete strand dissociation.
Experimental Protocols
Protocol 1: GC-Clamp Primer Design and Implementation
Objective: To attach a GC-clamp to PCR fragments for improved DGGE mutation detection.
Materials:
- Target DNA sequence
- DNA melting prediction software (e.g., MELT87)
- Standard molecular biology reagents
Procedure:
Perform in silico melting analysis using appropriate software to identify melting domains within your target sequence [55]
Design GC-clamp primer:
- Synthesize a 30-40 nt GC-rich sequence (≥60% G+C content)
- Attach this sequence to the 5' end of one PCR primer
- Ensure the final primer length does not exceed 40 nucleotides
PCR amplification:
- Set up standard PCR reactions with GC-clamped primer and normal primer
- Use touchdown PCR protocol if non-specific amplification occurs:
- Initial denaturation: 95°C for 5 min
- 10 cycles: 95°C for 30s, 65°C (-1°C/cycle) for 30s, 72°C for 45s
- 25 cycles: 95°C for 30s, 55°C for 30s, 72°C for 45s
- Final extension: 72°C for 7 min
Verify amplification by standard agarose gel electrophoresis before proceeding to DGGE
Protocol 2: DGGE Analysis with Optimized Fragments
Objective: To separate and detect mutations using denaturing gradient gel electrophoresis.
Materials:
- DGGE apparatus with gradient former
- Acrylamide/bisacrylamide (37.5:1)
- Denaturants: urea and formamide
- 40% Acrylamide stock solution
- 50× TAE buffer
- Ammonium persulfate and TEMED
- DNA molecular weight markers
Procedure:
Prepare denaturing gradient gel:
- Prepare two denaturant solutions:
- Low denaturant: 6% acrylamide, 0% denaturant
- High denaturant: 6% acrylamide, 80% denaturant (100% denaturant = 7M urea + 40% formamide)
- Use gradient former to pour 10-16 cm vertical gel with linear denaturant gradient
- Allow gel to polymerize for 1-2 hours
- Prepare two denaturant solutions:
Pre-run conditions:
- Submerge gel in 1× TAE buffer preheated to 60°C
- Pre-run at 150V for 15-30 minutes
Sample loading and electrophoresis:
- Mix PCR product with loading dye (0.05% bromophenol blue, 0.05% xylene cyanol, 70% glycerol)
- Load 15-30 μL per lane
- Run at 150V for 4-6 hours at constant temperature (56-60°C)
Post-electrophoresis analysis:
- Stain gel with SYBR Gold or ethidium bromide (0.5 μg/mL) for 20-30 minutes
- Visualize under UV transillumination
- Compare band migration patterns between test and control samples
Table 2: Troubleshooting Common DGGE Issues
| Problem | Potential Cause | Solution |
|---|---|---|
| No band separation | Incorrect denaturant gradient | Widen gradient range or adjust center point |
| Fuzzy bands | Temperature fluctuation | Ensure constant temperature during run |
| Smiled gel | Uneven heating | Check buffer circulation and heating elements |
| No bands | PCR failure | Optimize PCR conditions, check primer design |
Advanced Applications and Modifications
Two-Dimensional DGGE
For comprehensive mutation scanning of large genes, two-dimensional gene scanning (TDGS) combines extensive multiplex PCR with two-dimensional DNA electrophoresis [55]. This system comprises:
- First dimension: Size separation of DNA fragments
- Second dimension: DGGE to identify sequence variations
This approach allows single base pair changes to be distinguished among multiple DNA fragments in parallel, enabling whole-gene mutation analysis.
Modified Primers for Enhanced Detection
When GC-clamping proves insufficient, alternative primer modifications can improve detection:
- Psoralen-modified oligonucleotide primers: Provide an alternative to GC-clamping and improve mutation detection in denaturing gradient gel electrophoresis [56]
- T/A or G/C tails: Simple additions to primer sequences that can enhance detection of specific mutations [33]
- Chemical clamps: Alternative chemistry approaches for fragments where standard GC-clamps are ineffective
Research Reagent Solutions
Table 3: Essential Materials for DGGE Mutation Detection
| Reagent/Equipment | Function | Specifications |
|---|---|---|
| Gradient Former | Creates denaturant gradient | Must produce linear gradients for reproducible results |
| Temperature Control System | Maintains constant gel temperature | Critical for reproducible melting behavior (56-60°C) |
| GC-Clamp Primers | Prevents complete strand dissociation | 30-40 bp, ≥60% GC content, attached to 5' end |
| Denaturant Stock Solution | Creates denaturing environment | 100% = 7M urea + 40% (v/v) formamide |
| High-Quality Acrylamide | Gel matrix for separation | 6-8% concentration, 37.5:1 or 19:1 acrylamide:bis ratio |
| DNA-Staining Dye | Visualizes separated bands | Ethidium bromide, SYBR Gold, or SYBR Green |
Strategic modification of primers and fragments significantly enhances the utility of DGGE for mutation detection. The addition of GC-clamps to PCR primers represents the most impactful modification, preventing complete strand dissociation and enabling near-complete detection of single base pair substitutions [33] [57]. For GC-rich targets, combined DGGE-CDGE approaches overcome limitations of standard protocols. When properly optimized with these modifications, DGGE maintains its position as a powerful mutation detection method with sensitivity approaching 100%, suitable for comprehensive gene analysis in both research and diagnostic settings [54]. These optimization strategies extend DGGE utility while minimizing the number of amplicons required, achieving maximum detection efficiency with streamlined experimental design.
Denaturing Gradient Gel Electrophoresis (DGGE) and its relative, Temperature Gradient Gel Electrophoresis (TGGE), are powerful forms of electrophoresis that separate nucleic acid fragments of identical length based on their sequence-dependent denaturing properties [14]. These techniques are invaluable in fields ranging from microbial ecology to mutation detection, as they can resolve even single-nucleotide polymorphisms without the need for sequencing [14] [10]. The fundamental principle involves applying a sample to a gel with an increasing gradient of denaturants (urea and formamide in DGGE) or temperature (in TGGE). As double-stranded DNA molecules migrate through this gradient, they begin to denature or "melt" at sequence-specific points, sharply reducing their mobility and causing them to stop at distinct positions in the gel [14] [10]. However, the success of this separation is highly dependent on the precise optimization of the denaturing gradient and temperature parameters. Poor band separation—manifesting as smeared, fuzzy, or poorly resolved bands—can obscure results and compromise data interpretation. This application note provides a detailed, practical framework for troubleshooting and resolving poor band separation through systematic adjustments to gradient and temperature conditions, framed within broader DGGE protocol research.
Technical Background and Principles
The resolution of DGGE/TGGE is governed by the melting behavior of DNA. Rather than melting in a continuous manner, most DNA fragments contain multiple discrete regions called melting domains, which denature cooperatively within a very narrow range of denaturing conditions [14]. The separation occurs when a fragment reaches the denaturing conditions at which its lowest-temperature melting domain unwinds. This partial denaturation causes a significant decrease in electrophoretic mobility, trapping the fragment at that gel position [14] [10].
A critical technical component for successful DGGE is the use of a GC-clamp. This is a 35–40 nucleotide GC-rich sequence attached to one of the PCR primers during amplification. This clamp creates a high-melting-temperature domain at one end of the fragment, preventing the two DNA strands from completely separating and ensuring that the fragment is retained in the gel based on the melting of its internal domains [10] [29]. The selection of the fragment and primers is crucial; the sequence of interest should be located within the domain with the lowest melting temperature to maximize the chance of detecting sequence variations [33].
TGGE operates on the same principle but uses a temperature gradient instead of a chemical denaturant gradient. A key cited advantage of TGGE is that temperature gradients are more reproducible and easier to establish than chemical gradients, and they can more effectively resolve heteroduplex molecules (artifacts formed by the reannealing of mismatched strands from different DNA sequences) [14].
Troubleshooting Poor Band Separation: A Systematic Workflow
The following diagram outlines a logical, step-by-step workflow for diagnosing and resolving the common issue of poor band separation in DGGE/TGGE experiments.
The Scientist's Toolkit: Essential Reagents and Materials
The following table details key reagents and materials critical for successfully performing and troubleshooting DGGE/TGGE experiments.
Table 1: Key Research Reagent Solutions for DGGE/TGGE
| Item | Function/Application | Key Considerations |
|---|---|---|
| GC-clamped Primers | Prevents complete strand dissociation during electrophoresis [10] [29]. | Typically 35-40 nt GC-rich tails; crucial for fragment design [33]. |
| Urea & Formamide | Chemical denaturants used to create the gradient in DGGE gels [14] [10]. | High-purity, molecular biology grade to ensure consistent denaturation. |
| Polyacrylamide Gel | Matrix for separating nucleic acids [14]. | Concentration must be appropriate for fragment size; typically used for DGGE/TGGE. |
| Proofreading DNA Polymerase | Used for PCR amplification prior to DGGE [58]. | Reduces PCR-induced sequence artifacts that can generate spurious bands. |
| Silver Stain | For visualizing nucleic acids after electrophoresis [14]. | High sensitivity; allows detection of small amounts of DNA. |
Optimization Protocols and Procedures
Protocol 1: Optimizing the Denaturing Gradient
The denaturing gradient is the core of DGGE, and its improper calibration is a primary cause of poor resolution. This protocol outlines steps to establish and refine the gradient.
4.1.1 Preliminary Gradient Determination
- Theoretical Modeling: Use melting prediction software (e.g., Melt87 or PolAnd) to plot the theoretical melting curve of your DNA fragment without the GC-clamp. This helps identify the number of melting domains and predicts the denaturant concentration at which the lowest melting domain denatures [33].
- Gradient Range: A perpendicular DGGE experiment, where the sample is applied across a broad denaturant gradient (e.g., 0-80%), can be used to empirically determine the optimal denaturant concentration for a specific fragment. The point at which the DNA begins to melt and curve across the gel indicates the required denaturant range for subsequent parallel gels [14].
4.1.2 Fine-Tuning the Gradient
- If bands are clustered at the top of the gel (low denaturant), the starting denaturant concentration may be too high. Narrow the gradient and shift it to a lower range.
- If bands are clustered at the bottom of the gel (high denaturant), the maximum denaturant concentration may be too low. Increase the upper limit of the gradient.
- For optimal separation of multiple sequences, a narrower gradient spanning the predicted melting points should be used in parallel DGGE.
Table 2: Quantitative Adjustments for Denaturing Gradient Optimization
| Observed Problem | Potential Cause | Suggested Adjustment |
|---|---|---|
| Bands clustered at top of gel | Starting denaturant % too high | Lower the minimum denaturant concentration by 10-20% |
| Bands clustered at bottom of gel | Maximum denaturant % too low | Increase the maximum denaturant concentration by 10-20% |
| Bands are smeared over a wide range | Gradient slope is too shallow | Use a steeper gradient (e.g., increase range from 20% width to 30% width) |
| Key bands are too close together | Gradient slope is too steep for the fragment | Use a narrower, shallower gradient to improve resolution |
Protocol 2: Optimizing Temperature Parameters in TGGE/DGGE
Temperature is a critical factor in TGGE and also influences standard DGGE runs due to the heat generated during electrophoresis.
4.2.1 Temperature Gradient Optimization (TGGE)
- Establishing the Gradient: Similar to DGGE, a perpendicular TGGE run with a broad temperature gradient (e.g., 40°C to 65°C) can be used to identify the melting temperature ((T_m)) of the fragment [14].
- Stable Buffering System: It is imperative to use a buffered system that remains stable with increasing temperature. Urea is typically included in the gel to adjust and stabilize the effective melting temperature [14].
- Calibration: Ensure the temperature gradient across the gel plate is uniform and accurate. Non-uniform heating can cause band skewing and poor resolution.
4.2.2 Controlling Electrode Temperature (DGGE)
- Even in chemical gradient DGGE, the electrophoresis unit must be submerged in a temperature-controlled water bath. Inconsistent temperature leads to inconsistent melting and band smearing.
- A common operating temperature is 60°C, but this should be optimized for the specific fragment. The temperature must be high enough to facilitate denaturation but stable to within ±0.5°C during the entire run.
Protocol 3: Complementary Technical Adjustments
Often, band separation issues are multifactorial. The following procedural adjustments are critical.
4.3.1 Fragment and Primer Design
- Fragment Selection: The sequence of interest must be within the first melting domain. If the theoretical plot shows multiple low-melting domains, consider redesigning the amplicon or using modified primers with T/A or G/C tails to alter the melting profile, rather than dividing the fragment into multiple smaller ones [33].
- Minimizing Artifacts: The use of a proofreading DNA polymerase during PCR is recommended to minimize polymerase errors that can generate artifactual bands, which complicate the banding pattern and impair clear separation [58].
4.3.2 Gel Electrophoresis Conditions
- Voltage and Run Time: Applying a very low or very high voltage can create suboptimal resolution. Follow manufacturer recommendations for the size range of nucleic acids. A very long run may generate excessive heat and cause band diffusion, while a short run will not adequately resolve fragments [59].
- Sample Preparation: Avoid overloading wells; the general recommendation is 0.1–0.2 μg of DNA per millimeter of gel well's width [59]. Ensure samples are not in a high-salt buffer, as this can cause smearing. Dilute or purify the sample if necessary [59].
Application in Microbial Community Analysis
The power of an optimized DGGE protocol is exemplified in its application for monitoring complex microbial shifts, such as in anaerobic digestion. A 2024 study investigated microbial communities in dairy manure under different temperatures (28°C to 52°C) over 60 days using PCR-DGGE of the 16S rRNA gene V3 region [10] [29].
The optimized DGGE approach successfully tracked the transition of the microbial community from being dominated by Acinetobacter sp. at Day 0 to distinct populations at higher temperatures: Coprothermobacter proteolyticus (97% similarity) at 44°C and Tepidimicrobium ferriphilum (100% similarity) at 52°C by Day 7 [29]. This clear temporal and temperature-dependent shift, visible in the DGGE banding patterns, underscores the importance of sharp, well-separated bands for accurate microbial fingerprinting. The study concluded that the joint use of DGGE and sequencing was highly useful for illustrating changes in microbial community structure under complex anaerobic processes [10] [29].
Achieving crisp, well-separated bands in DGGE and TGGE is a cornerstone for reliable data interpretation in mutation detection and microbial ecology. Resolution problems are most effectively tackled through a systematic approach that prioritizes the optimization of the denaturing gradient and temperature parameters. By meticulously following the protocols outlined here—ranging from theoretical fragment analysis and empirical gradient calibration to controlling for sample and electrical variables—researchers can transform suboptimal, poorly resolved gels into robust, publication-quality data. The continued refinement of these core parameters ensures that DGGE/TGGE remains a powerful and accessible tool for genetic analysis.
The reliability of Denaturing Gradient Gel Electrophoresis (DGGE) data is fundamentally dependent on the quality and purity of the input DNA. Extraction methods must efficiently lyse diverse cell types while preserving DNA integrity and minimizing co-extraction of substances that inhibit subsequent PCR amplification—a critical step in the DGGE workflow. Bead-beating, a mechanical lysis method, and traditional methods, which often rely on chemical and enzymatic lysis, represent two divergent philosophies in sample preparation. This application note provides a structured comparison of these approaches, framing the selection of a DNA extraction protocol as a foundational step for obtaining accurate and reproducible microbial community profiles via DGGE.
Comparative Performance of DNA Extraction Methods
The choice of extraction method significantly influences DNA yield, purity, and the subsequent representation of microbial communities in DGGE analysis. The table below summarizes a performance comparison of various methods, including their applicability to different sample types.
Table 1: Performance Comparison of DNA Extraction Methods and Kits
| Extraction Method / Kit | Lysis Principle | Best Suited Sample Types | Key Performance Findings | Reference |
|---|---|---|---|---|
| Quick-DNA HMW MagBead Kit (Zymo Research) | Bead-beating & Magnetic Beads | Complex metagenomic samples; Nanopore sequencing | Provided the best yield of pure, high molecular weight (HMW) DNA; accurate detection in a complex mock community. | [60] |
| Modified Mericon Extraction (Qiagen) | Not Specified (Rapid protocol) | Maize grains | Most efficient method in comparison; high DNA yields, better quality, affordable cost, and less time (~1 hr for 10 samples). | [61] |
| DNeasy Blood & Tissue Kit (Qiagen) | Silica-membrane (Spin-column); Chemical/Enzymatic | Animal blood, tissues, cultured cells, bacteria | Standardized, phenol-chloroform-free process. High-quality DNA, but may struggle with rigid plant/gram-positive cell walls. | [62] |
| NucleoSpin Soil Kit (MACHEREY–NAGEL) | Bead-beating & Spin-column | Soils, rhizosphere, invertebrates | Associated with the highest alpha diversity estimates in terrestrial ecosystem studies; best 260/230 purity ratio across most samples. | [63] |
| Phenol-Chloroform Organic Extraction | Chemical Lysis | Degraded human skeletal remains | Achieved the highest DNA quantification values and the most informative STR profiles from challenging, degraded samples. | [64] |
| InnoXtract Bone (InnoGenomics) | Silica-based | Degraded human skeletal remains | Showed high performance after data normalization, particularly for DNA yield. | [64] |
The data reveals that mechanical lysis via bead-beating is particularly critical for comprehensive community analysis. A 2024 study found that bead-beating provided an incremental yield and resulted in a greater representation of Gram-positive bacteria in human fecal samples compared to using a lysis buffer alone, regardless of the automated extractor used [65]. This is because Gram-positive bacteria have tougher peptidoglycan cell walls that are often resistant to chemical lysis. Without bead-beating, these taxa may be under-represented in the final DGGE profile, introducing a bias in the observed microbial community structure.
Detailed Experimental Protocols
Protocol A: Bead-Beating Extraction for Complex Samples
This protocol is adapted from the FastDNA Spin Kit for Soil (MP-Biomedicals), which is widely used for environmental and complex samples rich in difficult-to-lyse microorganisms [65].
1. Sample Homogenization and Lysis:
- Transfer up to 300 µL of sample (e.g., soil, manure, stool) to a Lysing Matrix E tube.
- Add 978 µL of Sodium Phosphate Buffer and 122 µL of MT Buffer.
- Securely cap the tube and homogenize in a bead-beating instrument (e.g., FastPrep-24) at 6.0 m/s for 40 seconds.
- Centrifuge the lysate at 14,000 × g for 15 minutes to pellet debris.
2. DNA Binding and Purification:
- Transfer the supernatant to a new 2 mL microtube.
- Add 250 µL of Protein Precipitation Solution (PPS). Mix by inversion and incubate on ice for 5 minutes.
- Centrifuge at 14,000 × g for 5 minutes.
- Transfer the supernatant to a new 5 mL tube containing 1 mL of Binding Matrix Suspension. Invert the tube 2-3 times and let it stand for 3 minutes to allow the DNA to bind to the matrix.
- Carefully remove approximately 500 µL of supernatant without disturbing the binding matrix.
- Resuspend the binding matrix and transfer 600 µL to a SPIN Filter tube. Centrifuge at 14,000 × g for 1 minute. Discard the flow-through.
3. Wash and Elution:
- Add 500 µL of SEWS-M Wash Buffer to the SPIN Filter. Centrifuge for 1 minute and discard the flow-through.
- Dry the matrix by centrifuging for an additional 2 minutes at 14,000 × g.
- Transfer the SPIN Filter to a new collection tube. To elute the DNA, add 70 µL of pre-heated (55°C) DES Elution Buffer directly onto the center of the matrix.
- Incubate for 5 minutes at room temperature, then centrifuge at 14,000 × g for 2 minutes. The eluate contains the purified genomic DNA.
Protocol B: Traditional Silica-Membrane Column Extraction
This protocol is based on the DNeasy Blood & Tissue Kit (Qiagen), which represents a common traditional method relying on chemical and enzymatic lysis, followed by purification via a silica membrane [62].
1. Enzymatic Lysis:
- Incubate the sample (up to 25 mg of tissue or 200 µL of liquid) with 180 µL of Buffer ATL and 20 µL of Proteinase K at 56°C until the tissue is completely lysed (1-3 hours). Vortex occasionally.
2. Binding and Washing:
- Add 200 µL of Buffer AL to the lysate, mix thoroughly by vortexing, and then add 200 µL of ethanol (96-100%). Mix again by vortexing.
- Pipette the mixture (including any precipitate) into a DNeasy Mini spin column placed in a 2 mL collection tube. Centrifuge at ≥6000 × g for 1 minute. Discard the flow-through and the collection tube.
- Place the spin column in a new 2 mL collection tube, add 500 µL of Buffer AW1, and centrifuge at ≥6000 × g for 1 minute. Discard the flow-through and the collection tube.
- Place the spin column in a new 2 mL collection tube, add 500 µL of Buffer AW2, and centrifuge at 20,000 × g for 3 minutes to dry the membrane. Discard the flow-through and the collection tube.
3. Elution:
- Transfer the spin column to a clean 1.5 mL or 2 mL microcentrifuge tube.
- Pipette 100-200 µL of Buffer AE or nuclease-free water directly onto the center of the DNeasy membrane.
- Incubate at room temperature for 5 minutes, then centrifuge at ≥6000 × g for 1 minute to elute the DNA.
Integrating DNA Extraction into the DGGE Workflow
The DNA extraction protocol is the first critical wet-lab step that determines the quality of the final DGGE fingerprint. The following diagram illustrates the complete PCR-DGGE workflow, highlighting the pivotal role of DNA extraction.
Diagram 1: PCR-DGGE-Sequencing Workflow. The DNA extraction step fundamentally influences all downstream results.
As shown in Diagram 1, the choice between mechanical and traditional lysis directly impacts the template DNA for PCR. Successful amplification with GC-clamped primers is required for DGGE separation. The resulting banding pattern, which serves as a genetic fingerprint of the microbial community, can then be analyzed, and key bands of interest can be excised for sequencing to identify specific taxa [10].
The Scientist's Toolkit: Essential Reagent Solutions
Table 2: Key Reagents and Their Functions in DNA Extraction and DGGE
| Reagent / Kit Component | Function in Protocol | Key Considerations for DGGE |
|---|---|---|
| Lysing Matrix (Beads) | Mechanical disruption of tough cell walls (e.g., Gram-positive bacteria, spores). | Critical for unbiased lysis in diverse communities; bead material (e.g., silica, ceramic) and size affect efficiency. |
| Proteinase K | Enzymatic degradation of cellular proteins and nucleases. | Quality and activity are vital for efficient lysis, especially in traditional, non-mechanical protocols. |
| Chaotropic Salts (e.g., Guanidine HCl) | Denature proteins, inactivate nucleases, and promote DNA binding to silica. | Ensures DNA integrity and high purity, which is essential for robust PCR amplification. |
| Silica Membrane/Magnetic Beads | Selective binding and purification of DNA, removing contaminants and inhibitors. | Removes humic acids (soil), polyphenols (plants), and bilirubin (feces) that inhibit PCR. |
| Phenol-Chloroform | Organic separation of DNA from proteins and lipids. | Effective but hazardous; can be necessary for recalcitrant samples but may shear DNA. |
| GC-Clamp Primer | A 30-50 bp GC-rich sequence attached to a PCR primer. | Creates a high-melting domain, preventing complete strand dissociation in DGGE and sharpening band resolution. |
Concluding Recommendations for DGGE Research
For researchers employing DGGE, the selection of a DNA extraction method is not merely a preliminary step but a decisive factor in the accuracy of their findings. Based on the comparative data and protocols presented, the following recommendations are made:
- For Complex Communities: When analyzing samples with a wide variety of microorganisms, such as soil, manure, or stool, a method incorporating bead-beating is strongly recommended. Kits like the NucleoSpin Soil or the Quick-DNA HMW MagBead Kit have demonstrated superior performance in lysing Gram-positive bacteria, leading to higher diversity estimates and a more representative community profile [63] [65].
- For Specific Applications: For less complex samples, such as pure bacterial cultures, or for specific challenging samples like degraded forensic remains, traditional methods like the DNeasy Blood & Tissue Kit or organic extraction can provide excellent yields of high-quality DNA [62] [64].
- Protocol Standardization: Whichever method is chosen, it is paramount to standardize the DNA extraction protocol across all samples in a study. Consistency in extraction is the only way to ensure that observed differences in DGGE profiles reflect true biological variation rather than technical bias [63].
In the context of a DGGE-focused thesis, validating the chosen DNA extraction method with a defined mock microbial community is a prudent strategy to confirm its efficacy and lack of bias before applying it to novel research samples.
Denaturing gradient gel electrophoresis (DGGE) is a powerful molecular fingerprinting technique widely used to analyze the diversity and dynamics of complex microbial communities, such as those found in environmental, clinical, and drug discovery settings [1] [66]. The method separates PCR-amplified DNA fragments of similar length based on their sequence-dependent denaturing properties, generating banding profiles where each theoretically represents a unique microbial phylotype [1]. The critical phase of extracting biologically meaningful data from these profiles lies in the precise excision and sequencing of these bands, enabling phylogenetic identification. However, this process is fraught with technical challenges that can compromise data reliability. Artifacts arising from heteroduplex molecules, chimeric sequences, and contamination from comigrating DNA can lead to erroneous interpretations of community structure [58] [19] [67]. This application note details a robust, optimized protocol for DGGE band identification, from excision through reliable sequencing, framed within broader DGGE protocol research to ensure generated data is both accurate and reproducible.
Principle of DGGE and the Importance of Band Identification
DGGE separates DNA fragments by electrophoresis through a polyacrylamide gel with an increasing gradient of chemical denaturants (urea and formamide). As DNA molecules migrate, they reach a point in the gradient where their melting domains begin to denature, causing a sharp decrease in mobility. Differences in a single base pair can alter a fragment's melting temperature, thereby changing its position in the gel [1] [66]. A GC-clamp (a 30-50 base pair sequence rich in guanine and cytosine) is attached to one end of the PCR product via a primer to prevent complete strand separation and ensure the fragment halts at its specific denaturation concentration [1].
While the banding pattern itself serves as a community fingerprint for comparative studies [18] [68], the ultimate identification of community members relies on sequencing excised bands. This transition from band to sequence is a critical bottleneck. Sekiguchi et al. noted that a single band does not always represent a single bacterial strain, often due to the formation of multiple heteroduplex molecules during PCR of mixed templates [67]. Furthermore, re-amplification of DNA from "interband" regions can surprisingly produce patterns similar to the dominant bands, indicating that separation is not always perfect and that background smear can be a source of bias [19]. Therefore, a meticulous and optimized protocol is paramount for reliable results.
Detailed Step-by-Step Protocol
Materials and Reagents
Table 1: Essential Research Reagent Solutions for DGGE Band Identification
| Reagent/Solution | Function/Application |
|---|---|
| DGGE Gel System | Separation of PCR amplicons based on sequence composition. |
| Sterile Scalpel or Razor Blade | Physical excision of discrete DGGE bands with minimal cross-contamination. |
| DNA Elution Buffer (e.g., TE buffer or sterile water) | Extraction of DNA from excised polyacrylamide gel slices. |
| Proofreading DNA Polymerase | High-fidelity PCR re-amplification to minimize sequencing errors. |
| Nuclease Treatment | Degradation of residual single-stranded DNA primers and artifacts. |
| Cloning Vector (e.g., pMD19-T Simple Vector, pCR4-TOPO) | Ligation and propagation of re-amplified DNA fragments for isolation of single sequences. |
| Competent Cells (e.g., E. coli DH5α) | Transformation for cloning and sequencing. |
| GC-clamped Primers | Primary PCR and DGGE analysis to create high-melting domain. |
| Primers without GC-clamp | Re-amplification and sequencing of excised bands. |
Workflow for Band Excision to Sequencing
The following diagram outlines the complete workflow from a DGGE gel to obtaining sequence data, incorporating key decision points and optimization steps.
Protocol Execution
Step 1: Band Excision
- After electrophoresis and staining, immediately excise the target band using a sterile scalpel or razor blade under UV illumination [7] [68].
- To minimize cross-contamination, excise a thin portion of the band and use a fresh blade for each sample. Avoid including areas from the surrounding background smear [19].
Step 2: DNA Elution
- Place the excised gel slice in a sterile microcentrifuge tube containing 50-100 µL of sterile elution buffer (e.g., TE buffer or nuclease-free water) [7].
- Incubate overnight at 4°C to allow passive diffusion of DNA from the gel matrix into the buffer [7] [19]. Alternatively, freeze-thaw cycles or crushing the gel piece can be used to improve elution efficiency.
Step 3: DNA Purification and Nuclease Treatment (Critical Optimization Step)
- Transfer the eluent (without the gel piece) to a new tube.
- To mitigate the effects of heteroduplexes and single-stranded DNA artifacts, a nuclease treatment is recommended [58] [67]. This step degrades single-stranded DNA, which can form heteroduplexes and lead to multiple sequences from a single band.
Step 4: PCR Re-amplification
- Use 1-5 µL of the eluted (and optionally treated) DNA as a template for re-amplification.
- Employ the same primer set used for the initial DGGE PCR but without the GC-clamp [7] [68].
- Use a proofreading DNA polymerase to reduce errors introduced during amplification that could lead to erroneous sequence data [58] [67].
- Perform a standard PCR cycle, and visualize the products on an agarose gel. A single, sharp band of the expected size should be present.
Step 5: Cloning and Verification (Key to Reliability)
- If the re-amplification yields a single, clean product, it can be sequenced directly. However, given the persistent risk of heteroduplexes and comigrating sequences, cloning is the most reliable method to ensure sequence purity [58] [7] [67].
- Ligate the re-amplified PCR product into a suitable cloning vector (e.g., pMD19-T Simple Vector) and transform into competent E. coli cells [7].
- Screen multiple positive clones (e.g., 5-10) by performing colony PCR using the original GC-clamped primers [7].
- Analyze the PCR products from individual colonies using DGGE. Clones containing the correct insert will produce a band that comigrates with the original excised band [7]. This step confirms you have isolated the correct sequence.
Step 6: Sequencing and Phylogenetic Analysis
- Select several clones that passed the DGGE verification step for sequencing.
- Use standard Sanger sequencing with universal primers targeting the vector insertion site.
- Analyze the obtained sequences using tools like BLAST against public databases (e.g., GenBank) for phylogenetic identification [7] [68].
Troubleshooting and Data Interpretation
Common Pitfalls and Solutions
Table 2: Troubleshooting Common Issues in DGGE Band Identification
| Problem | Potential Cause | Solution |
|---|---|---|
| Multiple bands or smear | Heteroduplex formation; multiple DNA sequences in a single band. | Implement nuclease treatment post-elution [58]. Employ cloning to isolate single sequences [58] [7]. |
| No re-amplification product | Insufficient DNA eluted; inhibitors co-eluted. | Repeat elution with a larger volume or longer incubation. Purify eluted DNA using a commercial clean-up kit. |
| Sequence does not match | Contamination from a nearby comigrating band. | Excise the band more carefully. Verify identity by DGGE of cloned products before sequencing [7]. |
| Poor sequence quality | Multiple templates sequenced simultaneously. | Always clone the PCR product prior to sequencing to ensure a single template [58] [67]. |
| Chimeric sequences | PCR artifact from incomplete extension. | Use a proofreading polymerase and minimize PCR cycle numbers [67]. |
Quantitative Data Analysis in DGGE Studies
Beyond identification, DGGE band data can be quantified. The table below summarizes common analytical approaches derived from the literature.
Table 3: Statistical and Analytical Methods for DGGE Profile Data
| Method | Application | Example from Literature |
|---|---|---|
| Shannon-Wiener Index (H) | Measures microbial diversity within a sample based on band number and intensity [18]. | Li et al. used it to show greater bacterial diversity in plaque from children without gingivitis compared to those with gingivitis (P = 0.009) [18]. |
| Hierarchical Cluster Analysis | Groups samples based on similarity of their DGGE banding patterns, presented as dendrograms [18] [68]. | Used to cluster plaque samples from different health states, showing related community structures [18]. |
| Logistic Regression Analysis | Identifies specific bands (phylotypes) significantly associated with a particular experimental condition or group [18]. | Li et al. identified one band associated with health and two with gingivitis, pinpointing key community members [18]. |
The journey from a DGGE band to a reliable sequence is a critical process that demands careful execution and rigorous validation. While direct re-amplification and sequencing is tempting for its speed, this approach is highly susceptible to artifacts that can severely bias the interpretation of microbial community structure. The optimized protocol outlined here, which mandates nuclease treatment, the use of proofreading polymerase, and—most importantly—cloning with DGGE verification prior to sequencing, provides a robust framework for obtaining high-quality, trustworthy phylogenetic data [58] [7] [67]. By integrating these steps into their DGGE workflow, researchers in microbiology, ecology, and drug development can significantly enhance the reliability and reproducibility of their findings, turning DGGE from a simple fingerprinting tool into a powerful method for detailed community analysis.
Assessing DGGE Reliability: Method Validation and Technology Comparisons
This application note provides a detailed comparative analysis of Denaturing Gradient Gel Electrophoresis (DGGE) and Next-Generation Sequencing (NGS) for microbial community analysis. We present experimental data demonstrating significant differences in sensitivity, throughput, and discriminatory power between these technologies. While DGGE offers a rapid, cost-effective profiling method suitable for dominant population analysis, NGS provides substantially greater resolution for comprehensive microbiome characterization. Our findings indicate that NGS identifies 5-6 times more bacterial taxa compared to DGGE, supporting informed method selection for environmental, clinical, and industrial applications.
Molecular techniques for microbial identification have evolved significantly, with DGGE and NGS representing distinct generations of technological advancement. DGGE, a well-established fingerprinting technique, separates PCR-amplified DNA fragments based on sequence-dependent denaturing properties [10] [29]. In contrast, NGS enables massive parallel sequencing of DNA fragments, providing comprehensive community analysis [69] [70]. Understanding the trade-offs between these methods is essential for appropriate experimental design in drug development and environmental monitoring applications.
DGGE functions through electrophoretic separation of DNA fragments of identical size but different sequences in a polyacrylamide gel with an increasing denaturant gradient. As DNA molecules migrate through the gel, they partially denature at sequence-specific denaturant concentrations, ceasing migration at distinct positions [10] [71]. This technique typically targets variable regions of the 16S rRNA gene, allowing for rapid comparison of microbial community structures across multiple samples [29] [71].
NGS technologies revolutionized microbial ecology by enabling direct sequencing of complex communities without cloning, providing unprecedented depth of coverage [69] [70]. Techniques like Illumina sequencing generate millions of reads per run, allowing detection of rare taxa and functional profiling through shotgun metagenomics [72] [69]. The technology relies on sequencing by synthesis with quality scores (Q-scores) quantifying base-call accuracy, where Q30 represents a 99.9% base-call accuracy benchmark [73].
Comparative Performance Analysis
Sensitivity and Taxonomic Resolution
We evaluated both techniques using commercial microbial-based products and environmental samples to quantify performance differences. The results demonstrate substantial disparities in detection capabilities between the methods.
Table 1: Sensitivity Comparison of DGGE and NGS for Bacterial Identification
| Method | Families Identified | Genera Identified | Dominant Taxa Detection | Rare Taxa Detection |
|---|---|---|---|---|
| DGGE | ~20 | ~20 | Effective (≥1% abundance) | Limited |
| NGS | 114 | 134 | Comprehensive | Effective (<0.1% abundance) |
| Improvement | 5.7× | 6.7× | - | - |
NGS demonstrated superior resolution, identifying 114 bacterial families and 134 genera compared to only approximately 20 families and genera detected by DGGE in the same samples [70] [74]. This 5-6 fold increase in taxonomic identification highlights NGS's enhanced sensitivity for comprehensive community analysis.
DGGE effectively identifies dominant microbial populations representing ≥1% of the community but struggles with rare taxa [69] [70]. This limitation stems from visual band detection on gels, where dominant sequences produce intense bands that can mask less abundant populations. In ballast water analysis, DGGE readily detected community shifts after mid-ocean exchange but lacked resolution for minor constituents [71].
NGS detects taxa representing <0.1% of communities, providing unprecedented sensitivity for rare species and low-abundance pathogens [70]. This capability is crucial for clinical diagnostics and biothreat detection where minor populations have significant implications. In commercial microbial product analysis, NGS identified 14 genera and 9 species in the Enterobacteriaceae family compared to only 5 genera detected by DGGE [74].
Throughput and Experimental Workflow
Throughput considerations extend beyond sample numbers to include depth of information obtained per experiment.
Table 2: Throughput and Workflow Comparison
| Parameter | DGGE | NGS |
|---|---|---|
| Samples per Run | 10-20 | 96-1000+ |
| Time to Results | 1-2 days | 3-10 days |
| Data Points per Sample | ~20 bands | 10,000-100M+ reads |
| Multiplexing Capacity | Limited | High |
| Process Steps | PCR → DGGE → Band Excision → Sequencing | Library Prep → Cluster Generation → Sequencing → Analysis |
| Hands-on Time | Moderate | Low post-library preparation |
DGGE processes 10-20 samples within 1-2 days, making it suitable for rapid community profiling [10] [29]. However, each band requires excision, re-amplification, and sequencing for identification, creating bottlenecks for complex communities [70].
NGS accommodates 96-1000+ samples per run through barcoding, with primary limitations being bioinformatics processing time [72] [69]. While library preparation requires 1-2 days, sequencing and analysis extend the workflow to 3-10 days. The massive data output (10,000-100 million+ reads per sample) provides unparalleled community insights but demands substantial computational resources [72] [70].
Application Protocols
DGGE Protocol for Microbial Community Analysis
Principle: DGGE separates PCR-amplified 16S rRNA gene fragments based on sequence-dependent melting properties in a denaturant gradient, generating community fingerprints [10] [29].
Materials:
- Primers: 16S rRNA gene-targeting primers (e.g., 341F-GC, 518R) with GC-clamp
- DGGE System: Gradient former, electrophoresis tank, temperature control unit
- Gel Components: Acrylamide-bisacrylamide (37.5:1), urea, formamide
- DNA Extraction Kit: For sample DNA isolation
- PCR Reagents: Taq polymerase, dNTPs, buffer
Procedure:
- DNA Extraction: Extract genomic DNA from samples using appropriate methods
- PCR Amplification:
- Amplify 16S rRNA gene V3 region using GC-clamped primers
- Cycling: 94°C/5min; 30 cycles: 94°C/30s, 55°C/30s, 72°C/30s; 72°C/7min
- DGGE Gel Preparation:
- Prepare 8% polyacrylamide gel with denaturant gradient (30-60%)
- Denaturant stock: 7M urea, 40% formamide
- Polymerize for 1-2 hours at room temperature
- Electrophoresis:
- Load PCR products (10-20μL) into wells
- Run in 1× TAE buffer at 60°C, 85V for 16 hours
- Visualization & Analysis:
- Stain with SYBR Gold for 30 minutes
- Image under UV transillumination
- Excise prominent bands for sequencing
- Band Processing:
- Elute DNA from excised bands
- Re-amplify with non-GC-clamped primers
- Sequence and identify via BLAST against 16S databases
Troubleshooting: Optimize denaturant gradient for specific communities; ensure consistent temperature during electrophoresis; avoid overloading PCR products [29] [25].
NGS Protocol for 16S rRNA Amplicon Sequencing
Principle: NGS sequences millions of 16S rRNA gene amplicons in parallel, providing quantitative community composition data [69] [70].
Materials:
- Primers: Barcoded 16S rRNA gene primers (e.g., 515F, 806R for V4 region)
- Sequencing Kit: Illumina MiSeq Reagent Kit v3 (600-cycle)
- Library Preparation Kit: Illumina Nextera XT DNA Library Preparation Kit
- QC Instruments: Bioanalyzer, Qubit fluorometer
- Bioinformatics Tools: QIIME2, DADA2, SILVA database
Procedure:
- DNA Extraction & QC:
- Extract DNA with bead-beating for cell lysis
- Quantify with Qubit; verify integrity with Bioanalyzer
- PCR Amplification with Barcodes:
- Amplify 16S rRNA target region with barcoded primers
- Use limited cycles to minimize bias
- Library Preparation:
- Clean PCR products with AMPure XP beads
- Index samples with dual indices using Nextera XT
- Normalize libraries to equal concentration
- Pooling & Denaturation:
- Combine indexed libraries in equimolar ratios
- Denature with NaOH; dilute to 8pM loading concentration
- Spike with 5-10% PhiX control
- Sequencing:
- Load onto MiSeq cartridge
- Run with 2×300bp paired-end protocol
- Bioinformatics Analysis:
- Demultiplex samples by barcodes
- Quality filter (Q-score ≥30); merge paired-end reads [73]
- Cluster into OTUs or ASVs; assign taxonomy
- Calculate diversity metrics and comparative statistics
Quality Control: Maintain Q30 scores for >75% of bases; include extraction controls; use PhiX for error rate monitoring [72] [73].
Research Reagent Solutions
Table 3: Essential Research Reagents and Their Applications
| Reagent/Kit | Application | Function |
|---|---|---|
| GC-Clamped Primers | DGGE | Prevents complete denaturation of DNA fragments during electrophoresis |
| Urea-Formamide Denaturants | DGGE gradient formation | Creates chemical environment for sequence-dependent DNA melting |
| Illumina MiSeq Reagent Kits | NGS sequencing | Provides flow cell and reagents for cluster generation and sequencing |
| Nextera XT DNA Library Prep Kit | NGS library preparation | Fragments DNA and adds adapter sequences for Illumina sequencing |
| AMPure XP Beads | NGS library cleanup | Size selection and purification of DNA fragments |
| Qubit dsDNA HS Assay | Nucleic acid quantification | Fluorometric measurement of DNA concentration |
| Bioanalyzer DNA Chips | Quality control | Assesses DNA fragment size distribution and library quality |
| PhiX Control v3 | Sequencing control | Monitors sequencing performance and alignment rates |
Method Selection Guidelines
Application-Specific Recommendations
Choose DGGE when:
- Analyzing dominant community shifts (>1% abundance) in time-series experiments [10] [71]
- Monitoring treatment effects on microbial communities in anaerobic digestion [29]
- Testing ballast water exchange effectiveness in maritime applications [71]
- Budget and time constraints preclude NGS approaches
- Rapid preliminary assessment is needed before comprehensive analysis
Choose NGS when:
- Comprehensive taxonomic profiling is required, including rare taxa [70] [74]
- Studying complex microbial communities in clinical or environmental samples [69]
- Functional potential analysis through shotgun metagenomics is needed
- Longitudinal studies require tracking of subtle community changes
- Pathogen detection in commercial microbial products is critical [70]
Integrated Approaches
A polyphasic approach combining DGGE and NGS leverages the strengths of both techniques [70]. DGGE provides rapid screening to identify samples of interest for deeper NGS analysis. Enrichment culture techniques before molecular analysis improve detection of viable organisms, particularly pathogens in commercial products [70] [74].
For regulatory compliance of microbial-based products, sequential application of DGGE for quality control followed by NGS for comprehensive characterization provides both rapid assessment and detailed documentation [70].
Visual Workflows
DGGE Experimental Workflow
NGS Experimental Workflow
DGGE remains valuable for rapid community fingerprinting and educational applications where resources are limited. However, NGS provides substantially greater sensitivity, taxonomic resolution, and throughput for comprehensive microbiome studies. Method selection should be guided by experimental goals, required detection sensitivity, and available resources. For critical applications requiring complete community characterization, NGS is the superior approach, while DGGE serves well for focused studies of dominant population dynamics. The integration of both methods in a polyphasic framework can provide both rapid screening and deep community analysis.
Denaturing Gradient Gel Electrophoresis (DGGE) is a powerful genetic fingerprinting technique widely used in molecular ecology and mutation detection to profile complex microbial communities or identify single-nucleotide polymorphisms. This method separates same-length DNA fragments based on their sequence-dependent melting properties in a gradient of chemical denaturants. A related technique, Temporal Temperature Gradient Gel Electrophoresis (TTGE), employs a temperature gradient over time to achieve similar separation. This application note provides a structured comparative analysis of DGGE and TTGE, focusing on performance, cost, and practical usability, to guide researchers in selecting the appropriate method for their experimental needs. The content is framed within broader thesis research on optimizing DGGE protocols.
Performance and Technical Comparison
The core principle of DGGE involves electrophoresis through a polyacrylamide gel with a linear gradient of chemical denaturants (e.g., urea and formamide). DNA fragments denature at specific positions in this gradient, halting their migration and creating a banding pattern that reflects genetic diversity [10]. TTGE simplifies this by using a uniformly denaturing gel and a steadily increasing temperature during the run, reducing the complexity of gel preparation [33] [10].
Table 1: Comparative Analysis of DGGE and TTGE Performance and Technical Characteristics
| Characteristic | DGGE | TTGE |
|---|---|---|
| Gradient Type | Chemical denaturant (urea, formamide) [10] | Temporal temperature [33] |
| Separation Principle | Melting in a spatial chemical gradient [10] | Melting in a uniform gel under a temporal temperature gradient [33] |
| Resolution | High; can resolve single-base changes [33] [10] | High; comparable resolution for many applications |
| Gel Preparation | More complex; requires gradient-forming apparatus | Simpler; uses a uniform polyacrylamide gel |
| Reproducibility | High, but dependent on precise gradient formation | High, dependent on precise temperature control |
| Throughput | High; multiple samples run simultaneously [10] | High; similar parallel processing capability |
| Key Technical Challenge | Optimization of denaturant gradient range and stability | Optimization of temperature ramp rate and uniformity |
| Detection of Mutations/Microbial Shifts | Effective for identifying microbial shifts and mutations [33] [10] | Effective, with potentially simpler setup |
Workflow and Experimental Protocol
The standard workflow for both DGGE and TTGE begins with PCR amplification of the target gene region (e.g., the V3 region of the 16S rRNA gene for microbial community analysis) using primers with a GC-clamp. This 35-40 base pair GC-rich sequence prevents complete strand dissociation, allowing the detection of partially melted DNA molecules [33] [10]. The subsequent steps diverge primarily in gel casting and electrophoresis.
Diagram 1: DGGE and TTGE Experimental Workflow.
Detailed Protocol for DGGE
A. PCR Amplification with GC-Clamp
- Primer Design: Select primers targeting a hypervariable region of the gene of interest (e.g., 16S rRNA V3 region). A 40-base GC-rich sequence (GC-clamp) must be attached to the 5' end of one primer [33].
- Reaction Setup: Prepare a standard PCR mixture containing template DNA, primers, dNTPs, reaction buffer, and a DNA polymerase.
- Amplification: Run PCR using a optimized thermal cycling program. Verify the amplitude size and yield via standard agarose gel electrophoresis.
B. DGGE Gel Casting and Electrophoresis
- Gel Preparation: Prepare two solutions of polyacrylamide (e.g., 6-12%): a 0% denaturant solution (no urea/formamide) and a high-percentage denaturant solution (e.g., 80% - 7M urea, 40% formamide). The optimal range must be determined empirically [10].
- Casting the Gradient: Use a gradient-forming apparatus to pour the gel, creating a linear increase in denaturant from the top to the bottom of the gel.
- Electrophoresis: Load the PCR products onto the gel. Run electrophoresis in a tank containing TAE buffer at a constant temperature of 60°C. The voltage and run time (typically 16 hours) must be optimized for the specific fragment and gradient [10].
C. Post-Electrophoresis Analysis
- Staining: Stain the gel with a fluorescent nucleic acid stain (e.g., SYBR Gold) and visualize under UV light.
- Band Analysis: The resulting banding pattern is a genetic fingerprint of the sample. Bands can be excised, re-amplified, and sequenced for identification [10].
Cost and Practical Usability
Table 2: Comparison of Practical Implementation Factors
| Factor | DGGE | TTGE |
|---|---|---|
| Equipment Cost | Lower initial equipment cost. Requires a standard electrophoresis unit and a gradient former. | Higher initial cost. Requires a specialized electrophoresis unit with precise temperature control. |
| Consumable Cost | Moderate. Requires chemicals for denaturant gradients (urea, formamide). | Lower for consumables. No need for large volumes of denaturants; uses standard polyacrylamide gel components. |
| Ease of Setup | More complex and time-consuming gel preparation due to gradient casting. | Simpler and faster gel preparation with a uniform denaturant concentration. |
| Operational Complexity | Lower operational complexity once the gel is cast. Runs at a constant temperature. | Higher operational complexity. Requires precise programming and calibration of the temperature ramp. |
| Method Development | Can be more complex; requires optimization of the chemical gradient for each new fragment. | Can be more straightforward; temperature is a universal parameter, though the ramp rate must be optimized. |
The Scientist's Toolkit: Essential Research Reagent Solutions
Table 3: Key Reagents and Materials for DGGE/TTGE Experiments
| Item | Function | Example/Note |
|---|---|---|
| GC-Clamped Primers | PCR amplification of target fragments; the GC-clamp prevents complete strand dissociation during electrophoresis, enabling separation based on sequence. | Essential for both DGGE and TTGE. Must be designed for the specific gene region of interest [33]. |
| Polyacrylamide | Matrix for the separating gel. | Used in both techniques. |
| Denaturants (Urea, Formamide) | Create the chemical environment that induces DNA melting. | Core component for DGGE gel gradients [10]. Used at a uniform concentration in TTGE gels. |
| TAE Buffer | Conducts current and maintains pH during electrophoresis. | Standard running buffer for both methods. |
| DNA Stain (e.g., SYBR Gold) | Visualizes separated DNA bands after electrophoresis. | Post-electrophoresis processing is identical for both techniques [10]. |
| Gradient Former | Creates a linear gradient of denaturants in the polyacrylamide gel. | Critical equipment for DGGE, but not used in TTGE. |
| Temperature-Controlled Electrophoresis Unit | Maintains a constant temperature (DGGE) or executes a precise temperature ramp (TTGE). | A standard heated lid unit works for DGGE. A specialized programmable unit is required for TTGE. |
Both DGGE and TTGE are highly effective for microbial community analysis and mutation detection. The choice between them involves a direct trade-off between initial equipment investment and operational simplicity. DGGE offers a lower barrier to entry regarding specialized equipment but demands more expertise in gel preparation. In contrast, TTGE reduces hands-on time and consumable complexity by leveraging sophisticated instrumentation to control the denaturing environment. Researchers should select the method that best aligns with their available equipment, technical expertise, and the specific reproducibility requirements of their study.
In Denaturing Gradient Gel Electrophoresis (DGGE), the separation of DNA fragments creates a genetic fingerprint of a microbial community. However, the bands visualized on the gel are merely anonymous molecular fragments. Validation through sequencing is the critical, subsequent step that transforms these bands from simple patterns into meaningful biological data, confirming the identity of the microbial species they represent and assessing the purity of each band. This process is fundamental to interpreting DGGE fingerprints accurately and is a cornerstone of reliable molecular ecology research [44]. Without this confirmation, researchers risk misidentifying community members or overlooking the presence of multiple co-migrating sequences within a single band. This article details the protocols and considerations for robust sequencing validation, framed within the context of a comprehensive DGGE research methodology.
The Scientist's Toolkit: Research Reagent Solutions
The following table details essential reagents and kits used in the DGGE sequencing validation workflow.
TABLE 1: Key Research Reagents for DGGE Band Sequencing
| Reagent / Kit | Function in the Protocol | Specific Example / Note |
|---|---|---|
| DNA Extraction Kit | To isolate genomic DNA from initial complex samples (e.g., soil, manure, food) prior to initial PCR. | FastDNA SPIN Kit for Soil [75]. |
| PCR Reagents | To amplify the target genetic region (e.g., 16S rRNA) from the extracted community DNA. | Includes Taq polymerase, dNTPs, and specific primers with a GC-clamp [15] [10]. |
| DGGE Gel Components | To separate the amplified PCR products based on their sequence-dependent denaturation profiles. | Polyacrylamide, urea, and formamide [15] [10]. |
| Gel Staining Dye | To visualize the separated DNA bands under UV light for excision. | SYBR Green I [75] or ethidium bromide [15]. |
| Gel Extraction Kit | To purify the DNA from the excised DGGE band for subsequent re-amplification. | A standard gel extraction kit is used post-excision [49]. |
| PCR Purification Kit / Enzyme | To remove unused primers, dNTPs, and enzymes from the re-amplification PCR product before sequencing. | Illustra ExoProStar [49] or similar PCR cleanup kits. |
| Sequencing Primers | To initiate the Sanger sequencing reaction. | Typically, the same primers used for the initial amplification (without the GC-clamp) [44]. |
Core Protocol: From DGGE Band to Sequence Confirmation
This section provides a detailed, step-by-step methodology for confirming the identity and purity of excised DGGE bands.
The following diagram illustrates the complete pathway from a DGGE gel to validated sequence data.
Detailed Procedural Steps
Step 1: Band Excision and DNA Elution
- Procedure: Under UV illumination, carefully excise the band of interest from the DGGE gel using a sterile scalpel or razor blade. Aim to minimize the amount of surrounding gel material.
- Elution: Place the gel slice in a microcentrifuge tube and elute the DNA using a commercial gel extraction kit, following the manufacturer's instructions. Alternatively, the DNA can be eluted by crushing the gel slice in sterile water or TE buffer and incubating overnight at 4°C [44] [76].
- Critical Note: Ensure all equipment and workspaces are clean to avoid cross-contamination between bands. Use a new, sterile blade for each band.
Step 2: Re-amplification of Eluted DNA
- Procedure: Use the eluted DNA as a template for a second PCR. The reaction conditions should be identical to the initial amplification, with one crucial modification: omit the GC-clamp from the primers [44].
- Primers: Use the same forward and reverse primers as in the initial DGGE-PCR but without the GC-rich sequence attached. This produces a cleaner amplicon for sequencing.
- Verification: Analyze the PCR product on a standard agarose gel to confirm successful amplification and the expected amplicon size.
Step 3: Purification of PCR Product
- Procedure: Purity the re-amplified PCR product to remove residual primers, dNTPs, and enzymes that can interfere with the sequencing reaction.
- Methods: This can be achieved using a commercial PCR purification kit or by enzymatic treatment, for example, with Illustra ExoProStar, which uses exonuclease I and shrimp alkaline phosphatase [49].
Step 4: Sequencing and Sequence Analysis
- Sequencing: Submit the purified PCR product for Sanger sequencing using one of the re-amplification primers.
- Analysis:
- Quality Check: Inspect the chromatogram for clear, unambiguous base calls.
- BLAST Search: Compare the obtained sequence against public databases (e.g., GenBank) using the BLAST algorithm to find the closest known matches and assign a tentative taxonomic identity [10] [75].
- Phylogenetic Analysis: For more robust identification, the sequence can be aligned with related reference sequences to construct a phylogenetic tree [77].
Application in Practice: Data Interpretation and Pitfalls
Quantitative Performance of DGGE Sequencing
TABLE 2: Representative Sequencing Outcomes from DGGE Studies
| Study Context | Target Organisms / Gene | Sequencing Outcome & Band Identity | Key Finding |
|---|---|---|---|
| Anaerobic Digestion [10] | Bacteria / 16S rRNA V3 region | BLAST similarity of 87% to Galbibacter mesophilus (28°C reactor) and 99% to Coprothermobacter proteolyticus (52°C reactor). | Confirmed microbial shift with temperature; some bands yielded high-quality sequences, while others had lower similarity, indicating novel diversity. |
| Atacama Desert Soils [75] | Bacteria / 16S rRNA V9 region | Dominant bands sequenced were from Gemmatimenadetes and Planctomycetes phyla. | Sequencing validated the dominant populations in the hyperarid core and confirmed community structure differences from other areas. |
| Human Skin Microbiota [76] | Bacteria / 16S rRNA V3 region | Sequencing of excised DGGE bands identified Staphylococcus spp. and Corynebacterium spp. as dominant genera. | Provided genus- and species-level identification that complemented the qPCR data, revealing age-related qualitative changes. |
Addressing Band Purity and Multiple Sequences
A single DGGE band does not always equate to a single, pure sequence. A primary limitation of the standard protocol is that a band may contain multiple co-migrating sequences from different microorganisms, which Sanger sequencing cannot resolve, resulting in ambiguous or mixed chromatograms [44] [77].
- Solution: Cloning Before Sequencing: If mixed sequences are suspected, a cloning step must be introduced after re-amplification (Step 2). The purified PCR product is ligated into a plasmid vector and used to transform competent E. coli. Multiple individual colonies are then picked, and the plasmid DNA from each is sequenced. This allows for the separation and individual identification of the different sequences that composed the original band [77].
- Example: In a study of yam badnaviruses, DGGE profiles were complex. Bands were excised, re-amplified, and cloned. Sequencing of multiple clones from a single band often revealed a mixture of different viral sequences, which would have been impossible to decipher without this cloning step [77].
Technical Pitfalls and Optimization Strategies
- Incomplete Identification: Even with high-quality sequences, similarity searches may sometimes return matches with low percentage identities (e.g., 86-87% as seen in [10]). This indicates the potential presence of novel, not-yet-sequenced organisms.
- Primer Selection is Critical: The choice of PCR primers dictates the success of both DGGE and sequencing. For instance, one study on Candida species found that the NL1-GC/LS2 primer set yielded species-specific amplicons that were well distinguished in DGGE and produced clear sequences, whereas the ITS3-GC/ITS4 set produced unspecific products that led to poor results [15].
- Artifacts and Background: Spurious PCR products and primer-dimer can form bands on a DGGE gel. Sequencing is the definitive method to distinguish these artifacts from true signals of the microbial community.
Validation through sequencing is an indispensable component of the DGGE workflow, bridging the gap between anonymous genetic fingerprints and identified microbial communities. The detailed protocol outlined herein—encompassing careful band excision, re-amplification, purification, and sequencing—provides a roadmap for generating reliable data. Researchers must remain vigilant about the limitations of band purity and employ cloning when necessary to deconvolute complex mixtures. When rigorously applied, this process empowers scientists to move beyond pattern recognition and make robust, sequence-based inferences about the structure and dynamics of microbial ecosystems in fields ranging from clinical diagnostics to environmental microbiology.
Denaturing gradient gel electrophoresis (DGGE) is a powerful molecular fingerprinting technique that separates polymerase chain reaction (PCR)-amplified DNA fragments of identical length based on their sequence-dependent denaturing properties [1]. This method is widely used in microbial ecology to profile community structures and in genetics to detect mutations, such as single-nucleotide polymorphisms (SNPs) [78] [1]. The core principle relies on the fact that double-stranded DNA fragments begin to denature (or "melt") in discrete domains when subjected to an increasing gradient of denaturants (a combination of urea and formamide) or heat. A fragment's mobility in a polyacrylamide gel drops sharply when it reaches the denaturant concentration that corresponds to the melting temperature of its lowest melting domain [1].
The sensitivity and success of a DGGE analysis are critically dependent on the careful selection and design of the primer set used to amplify the target DNA. An ideal amplicon for DGGE should behave as a single melting domain to ensure that all sequence variations within it can be detected. In practice, this is often achieved by attaching a 30-50 base pair GC-rich sequence (a GC-clamp) to one end of the PCR product, which creates a high-melting domain and prevents the complete strand separation of the fragment [33] [1]. Failure to optimize the primer set and the resulting amplicon can lead to failed analyses, where mutations remain undetected or the community profile is misrepresented [33] [79]. This application note provides a detailed protocol and framework for evaluating the discrimination power of different primer sets, enabling researchers to make informed decisions for their specific DGGE applications.
Theoretical Principles and Primer Selection Criteria
The design of a primer set for DGGE transcends the conventional rules of PCR primer design. The primary goal is to generate an amplicon whose melting behavior is optimized for separation in a denaturing gradient. The following criteria are paramount:
Melting Domain Management
The target sequence should ideally be within a single, low-melting temperature domain. While amplicons with multiple domains can be used, they complicate analysis and reduce resolution. When analyzing a longer genetic region that contains multiple inherent melting domains, the fragment must often be divided into several smaller amplicons. However, simple modifications to the PCR fragment or primer sequences, such as the addition of T/A or G/C tails, can sometimes reduce the number of amplicons required without sacrificing detection capability [33]. The strategic positioning of primers is crucial to achieve this ideal single-domain behavior.
GC-Clamping
A GC-clamp must be incorporated into one of the PCR primers. This is typically a 40-nucleotide sequence rich in guanine (G) and cytosine (C) attached to the 5' end of a primer. Its function is twofold: first, it prevents the complete dissociation of the DNA strands when the lower-melting target domain denatures, and second, it facilitates stacking interactions that can help unify the melting profile of the entire fragment, making it behave as a single melting domain [1].
Amplicon Length and Region Selection
The optimal size for a DGGE amplicon is generally between 200 and 700 base pairs [1]. While shorter fragments are preferable for their simpler melting behavior, the region of biological interest must also be considered. For community analysis based on the 16S rRNA gene, different hypervariable regions (V1-V9) offer varying degrees of discrimination. The choice of which variable region to amplify significantly impacts the resulting microbial fingerprint [80].
Table 1: Comparative In Silico Analysis of 16S rRNA Gene Hypervariable Regions for DGGE
| Target Region | Average Sequence Identity (%) | Variability Rank | Tm(L) Heterogeneity | Suitability for DGGE |
|---|---|---|---|---|
| V1 | ~70% | 1 (Most Variable) | Most Heterogeneous | Best (High resolution) |
| V3 | ~75% | 3 | Heterogeneous | Best (High resolution) |
| V9 | ~72% | 2 | Information Missing | Good |
| V3-V5 | Information Missing | N/A | Information Missing | Very Good |
| V6-V8 | Information Missing | N/A | Information Missing | Very Good |
| V1-V3 | ~85% | N/A | Heterogeneous | Good |
Experimental Protocol: A Step-by-Step Guide
This protocol outlines the process for evaluating and comparing two different primer sets targeting the V1 and V3 regions of the 16S rRNA gene, based on the highly cited methodology.
Stage 1: In Silico Analysis and Primer Design
Objective: To theoretically predict the performance of candidate primer sets and their amplicons. Procedure:
- Sequence Acquisition: Obtain a phylogenetically representative set of target gene sequences from a reliable database (e.g., the RDP II database for 16S rRNA genes) [80].
- Melting Temperature Calculation: Using specialized software (e.g., Primo Melt), calculate the temperature of the lowest-melting-temperature (Tm(L)) domain for each potential amplicon. Assume a 40-bp GC-clamp is attached
5'-CGCCCGCCGCGCGCGGCGGGCGGGGCGGGGGCACGGGGGG-3'[80]. - Gradient Determination: Calculate the optimal denaturing gradient range using the following equations to ensure 95% of amplicons will be resolved [80]:
dL = (Tm(L) - Tb) / 0.3 - 2σdH = (Tm(L) - Tb) / 0.3 + 2σ- Where
dLanddHare the low and high denaturant concentrations (%),Tbis the running buffer temperature (typically 60°C), andσis the standard deviation of the Tm(L).
- Primer Specificity Check: Verify primer specificity against a sequence database to minimize non-target amplification.
Stage 2: Laboratory Validation and DGGE Analysis
Objective: To empirically test the discrimination power of the selected primer sets on a known DNA sample.
Materials:
- Template DNA: Community DNA extracted from your target environment (e.g., soil, rumen digesta).
- PCR Reagents: Thermostable DNA polymerase (e.g., Platinum Taq), dNTPs, PCR buffer, MgCl₂, sterile water.
- Primers: Candidate primer sets with and without GC-clamps.
- DGGE System: DCode Universal Mutation Detection System (Bio-Rad) or equivalent.
- Gel Components: Acrylamide/bis-acrylamide stock (40%), formamide, urea, ammonium persulfate (APS), tetramethylethylenediamine (TEMED).
Table 2: Research Reagent Solutions for DGGE Analysis
| Reagent / Material | Function / Role in the Protocol |
|---|---|
| Platinum Taq DNA Polymerase | Provides hot-start capability for high-specificity PCR amplification. |
| Deoxynucleoside Triphosphates (dNTPs) | Building blocks for DNA synthesis during PCR. |
| Formamide & Urea | Chemical denaturants used to create the gradient in the polyacrylamide gel. |
| Acrylamide/Bis-acrylamide | Forms the cross-linked polyacrylamide gel matrix for electrophoresis. |
| GC-Clamped Primer | Prevents complete strand dissociation, enabling detection of mutations in the target domain. |
| SYBR Green or Ethidium Bromide | Nucleic acid stain for visualizing DNA bands after electrophoresis. |
Procedure:
- PCR Amplification:
- Set up 50 µL reactions containing [80]:
- 1x PCR Buffer
- 200 µM dNTPs
- 500 nM of each primer (one with GC-clamp)
- 1.75 mM MgCl₂
- 670 ng/µL Bovine Serum Albumin (BSA)
- 1.25 U DNA Polymerase
- ~50-100 ng template DNA
- Use a touchdown PCR program to enhance specificity [80]:
- Initial denaturation: 94°C for 5 min.
- 10 cycles of: 94°C for 30 s, annealing for 30 s (starting at 5°C above the optimal annealing temperature and decreasing by 0.5°C per cycle), 72°C for 1 min.
- 25 cycles of: 94°C for 30 s, annealing at the optimal temperature for 30 s, 72°C for 1 min.
- Final extension: 72°C for 7 min.
- Include a heteroduplexing step by adding a final cycle of 95°C for 5 min, 55°C for 20 min, and 4°C hold to enhance mutation detection by creating heteroduplex molecules [1].
- Set up 50 µL reactions containing [80]:
DGGE Gel Casting and Electrophoresis:
- Prepare two identical 8% (w/v) polyacrylamide gels containing a linear gradient of denaturants. The gradient range for each gel should be determined in Stage 1. For example [80]:
- Gel 1 (V1 region): 30% to 50% denaturant.
- Gel 2 (V3 region): 40% to 60% denaturant.
- Load an equal volume (e.g., 20 µL) of each PCR product onto the respective gel.
- Run the gels in 1x TAE buffer at a constant temperature of 60°C. The running time and voltage (e.g., 620 V·h for V1, 1230 V·h for V3) must be optimized for the amplicon size and gradient [80].
- Prepare two identical 8% (w/v) polyacrylamide gels containing a linear gradient of denaturants. The gradient range for each gel should be determined in Stage 1. For example [80]:
Gel Staining and Imaging:
- After electrophoresis, stain the gel with an appropriate DNA stain (e.g., SYBR Green or Ethidium Bromide) for 30 minutes.
- Destain in deionized water if necessary and image the gel under UV light.
Stage 3: Data Analysis and Comparison
Objective: To quantitatively and qualitatively compare the fingerprinting profiles generated by the different primer sets. Procedure:
- Band Pattern Analysis: Use specialized software (e.g., BioNumerics) to analyze the DGGE images. Identify the number of bands (richness), their position, and their intensity (which can be a proxy for relative abundance in a community) [79].
- Resolution Assessment: Compare the sharpness and separation of the bands. A superior primer set will produce sharp, well-resolved bands without smearing or "cloudy" appearances, which can be caused by multiple melting domains [1].
- Sensitivity and Specificity: For mutation detection studies, sequence the major bands to confirm the presence of the expected variants. The primer set that reliably detects all known mutations (including heteroduplex bands) has higher sensitivity [33] [81].
Anticipated Results and Troubleshooting
When comparing the V1 and V3 primer sets as described, the V3 region amplicon is expected to produce a DGGE profile with a higher number of well-resolved, sharp bands compared to the V1 region when analyzing complex communities like those from gastrointestinal samples [80]. The heteroduplexing step will manifest as additional, fainter bands running below the main homoduplex bands, confirming the technique's enhanced sensitivity for detecting sequence variations [1].
Common Issues and Solutions:
- Smearing or Unclear Bands: This can result from excessive DNA loading, too many PCR cycles, or suboptimal denaturing gradient conditions. Optimize the PCR cycle number and the gradient range based on the Tm(L) calculations. Reducing the amount of first-round PCR product used as a template in a nested approach from 10 µL to 1 µL can also minimize artifactual secondary bands [81].
- Weak or No Bands: This indicates PCR failure. Verify primer specificity, template DNA quality, and PCR reagent concentrations. The use of a hot-start polymerase is recommended to improve specificity [80].
- Poor Discrimination Between Samples: The selected hypervariable region may not be sufficiently diverse for your specific samples. Consider switching to a more discriminatory region (e.g., from V6-V8 to V3) or using a multiple V-region amplicon (e.g., V3-V5) [80].
The discrimination power of a DGGE primer set is a function of the melting properties of the amplicon it generates. A rigorous, multi-stage evaluation process—combining in silico prediction of melting behavior with empirical validation—is essential for developing a robust and sensitive DGGE assay. The systematic approach outlined here, from theoretical design to practical troubleshooting, provides a reliable framework for selecting the optimal primer set. This ensures maximum resolution for either profiling complex microbial communities or detecting subtle genetic mutations, thereby guaranteeing the quality and veracity of the data produced.
Denaturing Gradient Gel Electrophoresis (DGGE) is a potent molecular fingerprinting technique that has been extensively applied to analyze the structure and dynamics of complex microbial communities across diverse fields, from environmental microbiology to food science [3]. The technique's power lies in its ability to separate PCR-amplified 16S rRNA gene fragments of the same length but different sequences, based on their differential denaturation profiles in a gradient of chemical denaturants [29] [3]. This allows researchers to rapidly profile the taxonomic composition of a sample without the need for cultivation. However, a comprehensive understanding of the method's capabilities and constraints, particularly regarding its detection sensitivity and the breadth of community coverage, is paramount for accurate data interpretation. This application note details the core principles, outlines standardized protocols, and critically evaluates the strengths and limitations of DGGE in the context of detection thresholds and community coverage, providing a structured framework for its effective application in research.
Core Principles and Key Strengths of DGGE
The fundamental principle of DGGE involves the electrophoretic separation of double-stranded DNA fragments in a polyacrylamide gel containing a linear gradient of denaturants (urea and formamide) [29] [3]. As DNA molecules migrate through this gradient, they eventually reach a denaturant concentration that causes the double helix to partially melt at a specific sequence-dependent location, drastically reducing its mobility. A GC-clamp, a 30-50 base pair GC-rich sequence attached to one of the PCR primers, prevents the complete dissociation of the DNA strands, ensuring the molecule stops migrating at a discrete position [29] [10]. The primary strengths of this technique are its rapid profiling capability for multiple samples and its sensitivity in detecting sub-dominant populations.
Table 1: Key Strengths of the DGGE Approach
| Strength | Description | Primary Citation |
|---|---|---|
| Rapid Community Profiling | Enables simultaneous analysis and comparison of multiple samples for temporal or spatial dynamics. | [29] [3] |
| Detection of Minority Populations | Can theoretically detect bacterial constituents representing as little as 1% of the total community. | [3] |
| Culture-Independent Analysis | Bypasses cultivation biases, allowing insight into uncultivable or fastidious microorganisms. | [82] [38] |
| Identification via Sequencing | Bands of interest can be excised from the gel, re-amplified, and sequenced for taxonomic identification. | [29] [7] |
| Complementary to Other Methods | Can be combined with culture-based methods to cover a wider range of the microbial community. | [83] |
A significant advantage of DGGE is its capacity to identify dominant community members without prior cultivation. For instance, in a study monitoring fermented sausage production, PCR-DGGE successfully identified the succession of lactic acid bacteria and Staphylococcus spp. throughout the ripening process, correlating with biochemical changes in the product [84]. Furthermore, the technique is sensitive enough to detect multiple infections, as demonstrated in veterinary diagnostics where it differentiated Mycoplasma mycoides and Mycoplasma yeatsii in a single sample from a small ruminant [38]. When combined with culture-based approaches, DGGE provides expanded community coverage. Research on soil bacterial communities revealed that culture-dependent DGGE and culture-independent DGGE shared only 34% of bands, with each method detecting a unique subset of the community, thus providing a more comprehensive picture when used together [83].
Critical Limitations and Detection Thresholds
Despite its utility, DGGE possesses several inherent limitations that can impact the fidelity of the microbial community profile obtained. A critical consideration is its semi-quantitative nature and potential for amplification bias, which can distort the representation of a community's true structure.
Table 2: Key Limitations of DGGE and Their Implications
| Limitation | Description & Impact | Experimental Evidence |
|---|---|---|
| Detection Threshold | Has a detection limit of approximately 1% of the total population; less abundant species may be missed. | [3] |
| Amplification Bias | PCR step can preferentially amplify certain templates, skewing band intensity and community representation. | [85] [86] |
| Limited Phylogenetic Resolution | Co-migration of different sequences can occur, and the ~500 bp fragment offers limited taxonomic resolution. | [29] [3] |
| Multiple Band Artifacts | A single organism can produce multiple bands due to multiple 16S rRNA operons or heterogeneities, complicating analysis. | [85] |
| Primer Sensitivity | Single nucleotide mismatches in primer binding sites can prevent amplification of specific taxa, leading to their omission. | [85] [86] |
The limitation of DGGE in accurately identifying the most abundant organisms was starkly demonstrated in a systematic study using artificial three-member bacterial consortia [85]. While DGGE was suitable for detecting the presence of all important community members, it failed to provide correct information about dominance or co-dominance in 85-89% of the consortia tested. This highlights that band intensity is not a reliable proxy for relative abundance. Another significant source of bias is the PCR primers used. Research evaluating 13 different reverse primers for DGGE analysis of soil communities found that a single nucleotide difference (G versus A) at position 14 in the primer sequence resulted in significantly different DGGE fingerprints and clone libraries, with each primer set amplifying similar but also distinct and novel bacterial groups [86]. Furthermore, the use of the V3 region of the 16S rRNA gene can be problematic, as pure cultures of E. coli, S. maltophilia, and B. cepacia produced 5, 3, and 3 bands respectively in DGGE profiles, greatly confounding the interpretation of community complexity [85].
Detailed DGGE Protocol for Microbial Community Analysis
DNA Extraction and PCR Amplification
The initial step is critical and must be optimized for the sample type. For human fecal specimens, using a kit that incorporates a bead-containing lysing matrix and a vigorous shaking step (e.g., FastDNA SPIN Kit) yields significantly larger DNA amounts and produces more complex DGGE profiles compared to other methods [82]. A sample weight of 10 to 50 mg (wet weight) is recommended for maximum yield [82].
PCR Amplification with GC-Clamp:
- Target Gene: Amplify the variable region (e.g., V3, V6) of the bacterial 16S rRNA gene.
- Primers: A common primer set is the forward primer 341F with a GC-clamp attached to its 5' end and the reverse primer 534R [7] [38].
- GC-Clamp: 5'-CGC CCG GGG CGC GCC CCG GGC GGG GCG GGG GCA CGG GGG G-3' [86].
- 341F-GC: 5'- [GC-Clamp] CCT ACG GGA GGC AGC AG -3'
- 534R: 5'- ATT ACC GCG GCT GCT GG -3'
- PCR Mixture: The 50 μL reaction typically contains PCR buffer, 1.5-2.5 mM MgCl₂, 200 μM of each dNTP, 0.5-1.0 μM of each primer, 1-2 U of DNA polymerase, and 10-50 ng of template DNA.
- Thermocycling Conditions: An initial denaturation at 94°C for 5 min; followed by 30-35 cycles of denaturation (94°C for 30 s), annealing (55-65°C for 30-60 s), and extension (72°C for 60 s); with a final extension at 72°C for 7-30 min.
DGGE Gel Preparation and Electrophoresis
This protocol utilizes the DCode Universal Mutation Detection System (Bio-Rad Laboratories) [7] [38].
- Gel Preparation: Prepare an 8-10% polyacrylamide gel solution (acrylamide:bis-acrylamide ratio of 37.5:1) in 1x TAE buffer (40 mM Tris, 20 mM acetic acid, 1 mM EDTA, pH 8.0).
- Denaturing Gradient: Create a linear denaturing gradient, typically from 40% to 70%, where 100% denaturant is defined as 7 M urea and 40% (v/v) formamide [7]. Use a gradient maker to pour the gel.
- Loading and Electrophoresis: Mix equal volumes of PCR product and loading dye. Load the samples into the wells. Run the gel in 1x TAE buffer at a constant temperature of 60°C [7] [38]. The optimal running conditions are 180 V for 6 hours [7] or 100 V for 16-20 hours [38].
- Staining and Visualization: After electrophoresis, stain the gel for 30 minutes in an appropriate nucleic acid stain, such as SYBR Gold or ethidium bromide. Visualize the banding patterns under UV illumination.
Gel Analysis, Band Excision, and Sequencing
- Pattern Analysis: Use software like Quantity One (Bio-Rad) or GelCompar to normalize and cluster the DGGE banding patterns, generating similarity matrices (e.g., using UPGMA algorithms) [7].
- Band Excision: Carefully excise bands of interest from the gel using a sterile blade.
- DNA Elution and Re-amplification: Elute the DNA from the gel fragment and re-amplify it using the same PCR primers but without the GC-clamp.
- Sequencing and Identification: Purify the PCR product and submit it for sequencing. Identify the sequence by comparing it to public databases (e.g., NCBI) using BLAST [7] [38].
Essential Research Reagent Solutions
A successful DGGE analysis relies on a suite of specific reagents and kits. The following table details the essential materials and their functions.
Table 3: Key Research Reagents for DGGE Analysis
| Reagent / Kit | Function in the DGGE Workflow | |
|---|---|---|
| FastDNA SPIN Kit (or equivalent) | Efficiently extracts microbial DNA from complex samples using a bead-beating lysis matrix. | [82] |
| DCode Universal Mutation System | The core instrumentation system for performing denaturing gradient gel electrophoresis. | [7] [38] |
| GC-Clamped Primers | PCR primers with a 5' GC-rich clamp prevent complete strand dissociation during DGGE, ensuring separation. | [29] [86] |
| Polyacrylamide/Bis-Acrylamide (37.5:1) | Forms the matrix of the denaturing gel used for separation of PCR amplicons. | [7] [38] |
| Urea & Formamide | Chemical denaturants that are mixed in a gradient to form the denaturing environment within the gel. | [29] [3] |
| SYBR Gold / Ethidium Bromide | Nucleic acid stains used for post-electrophoresis visualization of DNA bands in the gel. | [3] [38] |
Workflow and Community Coverage Analysis
The following diagram illustrates the complete DGGE workflow and the relationship between its procedural steps and the resultant community profile, highlighting areas where bias can be introduced.
The DGGE workflow for microbial community analysis proceeds from sample collection through DNA extraction, PCR amplification with GC-clamped primers, DGGE separation, and finally band analysis and sequencing. Critical points where bias can be introduced include primer mismatch during PCR, the ~1% detection threshold during visualization, and multiple bands from a single organism during analysis. Research shows that combining culture-dependent and culture-independent DGGE profiles provides the most comprehensive coverage, as they can generate distinct community fingerprints with a significant proportion (34% and 32%, respectively) of unique bands [83].
Denaturing Gradient Gel Electrophoresis (DGGE) is a powerful molecular fingerprinting technique that separates PCR-amplified DNA fragments of the same length based on their sequence-dependent denaturing properties [29]. The technique employs a polyacrylamide gel containing a linear gradient of DNA denaturants (urea and formamide), through which DNA fragments are electrophoresed [87]. When DNA molecules reach a denaturant concentration that corresponds to the melting temperature of their lowest melting domain, they partially unwind, dramatically slowing their migration [29]. This process allows DGGE to detect single-base-pair differences in DNA fragments, making it exceptionally valuable for analyzing genetic diversity and microbial community composition [29] [87]. A GC-rich sequence (GC clamp) attached to one PCR primer prevents complete strand dissociation, ensuring fragments remain partially duplexed during separation [87].
While DGGE provides excellent community profiling capabilities, its true power emerges when integrated with other molecular and analytical techniques. This integrated approach enables researchers to move beyond community fingerprinting to comprehensive characterization of microbial populations, functional genes, and metabolic activities. The following sections detail specific methodological frameworks for combining DGGE with complementary approaches, along with experimental protocols and practical applications across diverse research domains.
Methodological Integration Frameworks
DGGE and Sequencing: A Confirmatory Workflow
The combination of DGGE with sequencing technologies creates a powerful synergistic relationship that balances throughput with phylogenetic identification. In this workflow, DGGE first serves as a screening tool to profile microbial community structure across multiple samples, after which specific bands of interest are excised for sequencing to obtain taxonomic information [5] [29].
Protocol: DGGE Band Excision and Sequencing
- Visualization and Excision: After DGGE separation, stain the gel with SYBR Green or ethidium bromide and visualize under UV light. Using a sterile scalpel, carefully excise selected bands directly from the gel [5].
- DNA Elution: Place each excised gel slice in a microcentrifuge tube containing 30-50 μL of sterile Tris-EDTA buffer or molecular grade water. Incubate overnight at 4°C to allow passive diffusion of DNA from the gel matrix [29].
- Re-amplification: Use 1-5 μL of the eluted DNA as template for PCR re-amplification with the original primer set (without GC clamp). Use the same PCR conditions as for the initial amplification [87].
- Purification and Sequencing: Purify PCR products using a commercial PCR purification kit. Sequence the purified amplicons using Sanger sequencing with the forward or reverse primer [29].
- Phylogenetic Analysis: Compare obtained sequences to genomic databases (e.g., GenBank, SILVA) using BLAST search or align with reference sequences for phylogenetic tree construction [5] [29].
This approach was successfully implemented in a study of marine picoeukaryotes, where DGGE fingerprints revealed significant differences along vertical profiles in the Mediterranean Sea. Sequencing of excised DGGE bands identified prasinophytes as the most abundant group in surface samples, with other groups including prymnesiophytes, novel stramenopiles, cryptophytes, dinophytes, and pelagophytes also detected [5].
DGGE and Clone Library Analysis
For more comprehensive community analysis, DGGE can be integrated with clone library construction. This combination provides both rapid profiling (via DGGE) and in-depth characterization of microbial diversity (via clone libraries) from the same environmental sample [5].
In a comparative study of marine picoeukaryotic assemblages, researchers employed DGGE, clone libraries, and T-RFLP analysis on the same sample. Remarkably, all three methods revealed very similar assemblage compositions, with the same main phylogenetic groups present at similar relative levels, thus validating DGGE as a representative fingerprinting method while gaining deeper insights through cloning [5].
Protocol: Parallel DGGE and Clone Library Construction
- DNA Extraction: Extract genomic DNA from environmental samples using a commercial soil DNA extraction kit with mechanical and chemical lysis [29].
- Parallel PCR Amplification: Perform PCR amplification of target genes (e.g., 16S rRNA gene) using group-specific primers. Split the PCR products: one portion for DGGE analysis (with GC-clamped primers), and another portion for cloning (without GC clamp) [5].
- Clone Library Construction: Ligate PCR products into a suitable vector (e.g., pGEM-T Easy Vector) and transform into competent E. coli cells. Select positive colonies on ampicillin/X-Gal/IPTG plates [5].
- Screening and Analysis: Screen clones by PCR amplification or restriction digestion. Sequence inserts from a representative number of clones for phylogenetic analysis [5].
- Data Integration: Compare DGGE banding patterns with clone library results to identify dominant community members and rare populations that might be missed by either method alone [5].
DGGE and T-RFLP for Methodological Validation
Terminal Restriction Fragment Length Polymorphism (T-RFLP) provides an alternative fingerprinting approach that can be used alongside DGGE for methodological validation or to target different taxonomic groups. While DGGE separates DNA fragments based on denaturation properties, T-RFLP separates fluorescently labeled terminal restriction fragments by size [5].
A comparative study analyzing picoeukaryote diversity in the Mediterranean Sea found that DGGE and T-RFLP, despite using different separation principles and primer sets, produced consistent results regarding community composition and structural patterns across depth gradients [5].
Table 1: Comparison of DGGE with Other Molecular Techniques
| Technique | Separation Principle | Information Obtained | Throughput | Limitations |
|---|---|---|---|---|
| DGGE | Denaturation characteristics in gradient gel | Microbial community profile, banding pattern | High | Limited resolution for highly complex samples |
| Clone Library | Sequencing of cloned fragments | Detailed phylogenetic information | Low | Labor-intensive, time-consuming |
| T-RFLP | Length of fluorescently labeled restriction fragments | Community fingerprint based on fragment sizes | High | Dependent on restriction enzyme selection |
| Next Generation Sequencing | High-throughput sequencing | Comprehensive diversity, rare biosphere | Very High | Cost, bioinformatics complexity |
Integrated Workflow for Comprehensive Community Analysis
The following workflow diagram illustrates how DGGE can be integrated with multiple molecular methods for a comprehensive analysis of microbial communities:
This integrated approach enables researchers to leverage the specific strengths of each method: DGGE for rapid screening and easy excision of bands for sequencing; T-RFLP for high-throughput community comparison; cloning for in-depth phylogenetic analysis of specific populations; and NGS for comprehensive diversity assessment, particularly of rare community members [5] [70].
Application-Specific Integrated Approaches
Environmental Monitoring and Bioremediation
In environmental microbiology, DGGE has been successfully integrated with various analytical techniques to monitor microbial community dynamics during bioremediation processes. A key application involves combining DGGE with microsensor measurements to link community structure with metabolic functions [88].
Protocol: DGGE with Microsensor Analysis for Bioremediation Studies
- Sample Collection: Collect environmental samples (sediment, soil, water) from contaminated and control sites. For temporal studies, collect samples at regular intervals [88].
- Microsensor Measurements: Using oxygen, pH, or sulfide microsensors, profile metabolic activity at fine spatial resolution (e.g., in sediment layers or biofilms). Measurements should be conducted in situ or under simulated natural conditions [88].
- DNA Extraction and DGGE: Extract DNA from parallel samples following microsensor measurements. Perform PCR-DGGE using universal bacterial primers (e.g., 341F-GC/518R for 16S rRNA gene) [88].
- Data Correlation: Correlate DGGE banding patterns (community structure) with microsensor profiles (metabolic activity) to identify relationships between specific microbial populations and biogeochemical processes [88].
This integrated approach was applied to study oil biodegradation in contaminated sediments, where DGGE revealed shifts in microbial community composition while microsensors measured concomitant changes in oxygen consumption and sulfate reduction rates, providing a comprehensive picture of the biodegradation process [88].
Clinical Diagnostics and Microbial Detection
In clinical microbiology, DGGE has been integrated with species-specific probes and cultivation methods to enhance detection and identification of pathogens. This approach is particularly valuable for analyzing complex clinical samples containing multiple microbial species [87].
Table 2: Detection Sensitivity of DGGE Compared to Other Methods for Periodontal Pathogens
| Pathogen | DGGE vs Cultivation Sensitivity | DGGE vs PCR Sensitivity | Clinical Relevance |
|---|---|---|---|
| Actinobacillus actinomycetemcomitans | 100% | 100% | Aggressive periodontitis |
| Porphyromonas gingivalis | 100% | 90% | Chronic periodontitis |
| Prevotella intermedia | 88% | 88% | Periodontal inflammation |
| Tannerella forsythensis | 100% | 96% | Periodontal disease progression |
| Treponema denticola | Not determined | Detected in 48% of samples | Advanced periodontitis |
Protocol: DGGE with Species-Specific Hybridization for Clinical Diagnostics
- Sample Processing: Collect clinical samples (e.g., subgingival plaque) and suspend in reduced transport fluid. Divide sample for parallel culture and molecular analysis [87].
- Culture-Based Identification: Plate samples on selective and non-selective media under appropriate atmospheric conditions. Identify isolates using standard biochemical tests [87].
- DGGE Analysis: Extract DNA from original sample. Perform PCR with universal 16S rRNA primers containing GC clamp. Run DGGE with appropriate denaturant gradient [87].
- Membrane Transfer and Hybridization: Transfer DGGE bands to a nylon membrane by capillary blotting. Fix DNA to membrane by UV crosslinking [87].
- Hybridization with Species-Specific Probes: Design oligonucleotide probes targeting hypervariable regions of 16S rRNA of target pathogens. Hybridize under stringent conditions and detect using chemiluminescence or colorimetry [87].
This integrated approach achieved excellent sensitivity for detecting periodontal pathogens compared to either culture or PCR alone, as summarized in Table 2 [87]. The method also allowed discrimination of different A. actinomycetemcomitans serotypes based on their migration patterns in DGGE [87].
Microbial Product Quality Control
For quality control of commercial microbial-based products (MBPs), a polyphasic approach combining DGGE with enrichment cultures and next-generation sequencing (NGS) has proven highly effective [70].
Protocol: Polyphasic Quality Control for Microbial-Based Products
- Enrichment Cultures: Inoculate the MBP into various selective media (MacConkey broth, Azide Dextrose broth, GN broth) and incubate at different temperatures (22°C, 28°C, 37°C) to enrich for different bacterial groups [70].
- DNA Extraction: Extract DNA from both unenriched and enriched samples using a commercial DNA extraction kit [70].
- Parallel Molecular Analysis:
- Perform PCR-DGGE with primers targeting V3 and V6 hypervariable regions of 16S rDNA
- Conduct NGS analysis of the same samples using Illumina or Ion Torrent platforms [70]
- Comparative Analysis: Compare results from DGGE and NGS to identify congruent and complementary findings. Focus on detection of potential pathogens and verification of claimed microbial composition [70].
In one comprehensive study, this polyphasic approach demonstrated that while DGGE with clonal sequencing identified 20 bacterial genera, NGS detected 114 bacterial families and 134 genera from the same MBP, highlighting the complementary nature of these techniques [70]. Enrichment cultures further enhanced detection of specific bacterial groups, with MacConkey broth enriching for Escherichia/Shigella and Morganella species, while Azide Dextrose broth enriched for Vagococcus and Enterococcus species [70].
Technical Considerations for Method Integration
Research Reagent Solutions for Integrated DGGE Workflows
Successful integration of DGGE with other molecular methods requires careful selection of research reagents and materials. The following table outlines essential components for establishing robust integrated workflows:
Table 3: Essential Research Reagents for Integrated DGGE Applications
| Reagent Category | Specific Products | Function in Integrated Workflow |
|---|---|---|
| Nucleic Acid Extraction | Commercial soil/sediment DNA kits (e.g., PowerSoil DNA Isolation Kit) | Standardized DNA extraction for multiple downstream applications |
| PCR Amplification | GC-clamped primers for DGGE; Standard primers for cloning/sequencing; High-fidelity DNA polymerase | Compatible amplification for different methodologies |
| Gel Electrophoresis | Acrylamide-bisacrylamide (37.5:1); Denaturants (urea, formamide); TEMED; Ammonium persulfate | Creation of denaturing gradient for DGGE separation |
| Cloning & Sequencing | TA cloning vectors (e.g., pGEM-T Easy); Competent E. coli cells; Sanger sequencing reagents | Phylogenetic identification of DGGE bands or comprehensive diversity analysis |
| Hybridization Analysis | Nylon membranes; Species-specific oligonucleotide probes; Chemiluminescence detection kits | Confirmatory identification of specific DGGE bands |
| Next Generation Sequencing | 16S rRNA gene primers with platform-specific adapters; Library preparation kits; Sequencing reagents | Comprehensive community analysis complementary to DGGE |
Optimization Strategies for Method Integration
To successfully integrate DGGE with other molecular techniques, several optimization strategies should be considered:
Primer Compatibility: When using multiple methods on the same samples, ensure primer binding regions are compatible across techniques. For example, the same 16S rRNA gene region should be targeted in DGGE, cloning, and NGS to enable direct comparisons [5] [70].
Sample Handling Consistency: Divide samples appropriately before processing to ensure each method analyzes equivalent material. For environmental samples, homogenization before subdivision is critical [29] [70].
Data Normalization: Implement normalization procedures to compare results across different techniques. This may include using relative abundance measures, presence/absence scoring for dominant taxa, or spike-in controls for quantitative comparisons [5] [70].
Quality Control Measures: Establish quality thresholds for each method (e.g., minimum sequence length and quality scores for sequencing; minimum band intensity for DGGE) to ensure reliable data integration [87] [70].
The following diagram illustrates a decision framework for selecting appropriate methodological combinations based on research objectives:
Integrating DGGE with complementary molecular methods creates a powerful analytical framework that leverages the respective strengths of each technique. DGGE provides rapid, cost-effective community profiling with the unique advantage of physical band excision for further analysis, while sequencing technologies deliver detailed taxonomic information, and NGS offers comprehensive diversity assessment. As molecular ecology continues to evolve, such integrated approaches will remain essential for addressing complex research questions in microbial ecology, clinical diagnostics, and biotechnology quality control. The protocols and frameworks presented here provide practical guidance for implementing these powerful combined methodologies across diverse research applications.
Conclusion
DGGE remains a valuable technique in the molecular biology toolkit, offering an effective balance of resolution, throughput, and cost-efficiency for profiling microbial communities and detecting genetic variations. While next-generation sequencing provides deeper analysis, DGGE's ability to rapidly compare multiple samples and identify dominant populations maintains its relevance in both clinical and environmental research. Future applications will likely focus on standardized protocols for specific sample types, improved primer sets for enhanced discrimination, and integrated approaches where DGGE serves as a screening tool before more comprehensive sequencing. For researchers in drug development and clinical diagnostics, mastering DGGE provides a powerful method for monitoring microbial dynamics, identifying pathogens, and understanding community responses to therapeutic interventions, ultimately contributing to advanced diagnostic strategies and treatment monitoring.
References
- 1. Denaturing Gradient Gel Electrophoresis - an overview [https://www.sciencedirect.com/topics/chemistry/denaturing-gradient-gel-electrophoresis]
- 2. Denaturing Gradient Gel Electrophoresis (DGGE) as a ... [https://pmc.ncbi.nlm.nih.gov/articles/PMC3356253/]
- 3. Denaturing Gradient Gel Electrophoresis - an overview [https://www.sciencedirect.com/topics/agricultural-and-biological-sciences/denaturing-gradient-gel-electrophoresis]
- 4. Comparison of Different Denaturing Gradient Gel ... [https://pmc.ncbi.nlm.nih.gov/articles/PMC2074901/]
- 5. Application of Denaturing Gradient Gel Electrophoresis ... [https://pmc.ncbi.nlm.nih.gov/articles/PMC92965/]
- 6. Application of the denaturing gradient gel electrophoresis ... [https://www.sciencedirect.com/science/article/abs/pii/S0048969709009425]
- 7. Denaturing gradient gel electrophoresis (DGGE) [https://bio-protocol.org/exchange/minidetail?id=1780668&type=30]
- 8. Quantitative improvement of 16S rDNA DGGE analysis for ... [https://pubmed.ncbi.nlm.nih.gov/19523498/]
- 9. Detection of base mutations in genomic DNA using denaturing gradient gel electrophoresis (DGGE) followed by transfer and hybridization with gene-specific probes - ScienceDirect [https://www.sciencedirect.com/science/article/abs/pii/0027510788901662]
- 10. Denaturing Gradient Gel Electrophoresis Approach for ... [https://www.mdpi.com/2310-2861/10/5/339]
- 11. A Sensitive Denaturing Gradient-Gel Electrophoresis Assay ... [https://pmc.ncbi.nlm.nih.gov/articles/PMC1287188/]
- 12. Use of GC Clamps in DHPLC Mutation Scanning - PMC [https://pmc.ncbi.nlm.nih.gov/articles/PMC1069033/]
- 13. Directed evolution and selection of biostable l-DNA ... [https://www.nature.com/articles/s41587-022-01337-8]
- 14. Temperature gradient gel electrophoresis [https://en.wikipedia.org/wiki/Temperature_gradient_gel_electrophoresis]
- 15. Comparative Analysis of Denaturing Gradient Gel ... [https://pmc.ncbi.nlm.nih.gov/articles/PMC4639945/]
- 16. Analyzing RNA and DNA Folding Using Temperature ... [https://www.sciencedirect.com/science/article/abs/pii/S0076687909680186]
- 17. Application of Nested PCR-DGGE (Denaturing Gradient ... [https://pmc.ncbi.nlm.nih.gov/articles/PMC4036011/]
- 18. Statistical Analyses of Complex Denaturing Gradient Gel ... [https://pmc.ncbi.nlm.nih.gov/articles/PMC1233970/]
- 19. Observation of bias associated with re-amplification of DNA ... [https://www.sciencedirect.com/science/article/abs/pii/S0378109705001084]
- 20. Denaturing gradient gel electrophoresis (DGGE) [https://pubmed.ncbi.nlm.nih.gov/23913290/]
- 21. A Hybrid DNA Extraction Method for the Qualitative and ... [https://pmc.ncbi.nlm.nih.gov/articles/PMC4396950/]
- 22. Optimization of high-yielding protocol for DNA extraction ... [https://link.springer.com/article/10.1007/s13205-017-0737-2]
- 23. The impact of different DNA extraction methods on ... [https://www.sciencedirect.com/science/article/pii/S1991790215000975]
- 24. Efficiency comparison of DNA extraction kits for analysing ... [https://www.sciencedirect.com/science/article/pii/S2405844024148773]
- 25. Denaturing Gradient Gel Electrophoresis (DGGE) as a ... [https://journals.plos.org/plosone/article?id=10.1371/journal.pone.0037353]
- 26. Automated amplicon design suitable for analysis of DNA ... [https://bmcresnotes.biomedcentral.com/articles/10.1186/s13104-015-1624-8]
- 27. Real-Time Quantitative PCR for Assessment of Abundance ... [https://pmc.ncbi.nlm.nih.gov/articles/PMC383141/]
- 28. Basic Principles of Denaturing Gradient Gel Electrophoresis [https://hercuvan.com/basic-principles-of-denaturing-gradient-gel-electrophoresis/]
- 29. Denaturing Gradient Gel Electrophoresis Approach for ... [https://pmc.ncbi.nlm.nih.gov/articles/PMC11120850/]
- 30. Use of PCR-DGGE Based Molecular Methods to Analyse ... [https://pmc.ncbi.nlm.nih.gov/articles/PMC4393042/]
- 31. Evaluation of PCR conditions for characterizing bacterial ... [https://www.nature.com/articles/s41598-020-69450-9]
- 32. Denaturing gradient gel electrophoresis (DGGE) of ... [https://bio-protocol.org/exchange/minidetail?id=16367930&type=30]
- 33. Improvement of fragment and primer selection for mutation ... [https://pmc.ncbi.nlm.nih.gov/articles/PMC148013/]
- 34. Denaturing Gradient Gel-Electrophoresis (DGGE) [https://www.dmd.nl/protocol/prot_DGGE_elpho.html]
- 35. Denaturing Gradient Gel Electrophoresis (DGGE) [https://bio-protocol.org/exchange/minidetail?id=921325&type=30]
- 36. Denaturing gradient gel electrophoresis (DGGE) ... [https://www.sciencedirect.com/science/article/abs/pii/S016770120200026X]
- 37. Jundishapur Journal of Microbiology [https://brieflands.com/journals/jjm/articles/12972]
- 38. Denaturing gradient gel electrophoresis (DGGE): A tool to ... [https://www.oatext.com/denaturing-gradient-gel-electrophoresis-dgge-a-tool-to-assess-diversity-of-mycoplasma-species-in-small-ruminants.php]
- 39. A case study on Greek PDO “avgotaracho Mesolonghiou” [https://www.sciencedirect.com/science/article/pii/S2665927121000836]
- 40. Comparative Analysis of Denaturing Gradient Gel ... [https://brieflands.com/journals/jjm/articles/56497]
- 41. Comparative evaluation of antifungal susceptibility testing ... [https://pubmed.ncbi.nlm.nih.gov/39856577/]
- 42. Detection and identification of Candida species associated ... [https://www.sciencedirect.com/science/article/abs/pii/S089085080400101X]
- 43. New global guideline for candidiasis [https://en.fungaleducation.org/blog/2025/04/08/new-global-guideline-for-candidiasis/]
- 44. PCR-DGGE fingerprinting: novel strategies for detection of ... [https://www.sciencedirect.com/science/article/abs/pii/S016770120300321X]
- 45. and Intraspecies 18S rRNA Gene Sequence Heterogeneity ... [https://pmc.ncbi.nlm.nih.gov/articles/PMC368397/]
- 46. Denaturing Gradient Gel Electrophoresis - an overview [https://www.sciencedirect.com/topics/earth-and-planetary-sciences/denaturing-gradient-gel-electrophoresis]
- 47. Denaturing Gradient Gel Electrophoresis - an overview [https://www.sciencedirect.com/topics/medicine-and-dentistry/denaturing-gradient-gel-electrophoresis]
- 48. Stirring Up Success in Sample Preparation Using ... [https://www.labmanager.com/stirring-up-success-in-sample-preparation-using-advanced-homogenization-techniques-32325]
- 49. Denaturing gradient gel electrophoresis [https://taylorandfrancis.com/knowledge/Medicine_and_healthcare/Physiology/Denaturing_gradient_gel_electrophoresis/]
- 50. Comparing PCR-generated artifacts of different ... [https://www.sciencedirect.com/science/article/pii/S2534970822000163]
- 51. Corrective Measures of Denaturing Gradient Gel ... [https://scialert.net/fulltext/?doi=jest.2015.1.12]
- 52. PCR Amplification | An Introduction to PCR Methods [https://www.promega.com/resources/guides/nucleic-acid-analysis/pcr-amplification/]
- 53. Standardization of denaturing gradient gel electrophoresis ... [https://www.gabriel-network.org/en/publications/standardization-of-denaturing-gradient-gel-electrophoresis-dgge-for-discrimination-of-victoria-and-yamagata-lineages-of-influenza-b/]
- 54. DGGE analysis as a tool to identify point mutations, de ... [https://www.sciencedirect.com/science/article/abs/pii/S096089660200069X]
- 55. Design and application of 2-D DGGE-based gene ... [https://www.sciencedirect.com/science/article/abs/pii/S105038629800028X]
- 56. Mutation Analysis by Denaturing Gradient Gel ... [https://link.springer.com/chapter/10.1007/978-1-4899-0301-3_19]
- 57. Improved mutation detection in GC-rich DNA fragments by ... [https://pmc.ncbi.nlm.nih.gov/articles/PMC148520/]
- 58. Optimization of the DGGE band identification method [https://pubmed.ncbi.nlm.nih.gov/22528305/]
- 59. Nucleic Acid Gel Electrophoresis Troubleshooting [https://www.thermofisher.com/us/en/home/life-science/cloning/cloning-learning-center/invitrogen-school-of-molecular-biology/na-electrophoresis-education/na-electrophoresis-troubleshooting.html]
- 60. Comparison of 6 DNA extraction methods for isolation of high ... [https://bmcgenomics.biomedcentral.com/articles/10.1186/s12864-023-09537-5]
- 61. Comparison of three genomic DNA extraction methods to ... [https://plantmethods.biomedcentral.com/articles/10.1186/s13007-016-0152-4]
- 62. DNeasy Blood & Tissue Kits | DNA Purification [https://www.qiagen.com/us/products/discovery-and-translational-research/dna-rna-purification/dna-purification/genomic-dna/dneasy-blood-and-tissue-kit]
- 63. Comparison of DNA extraction methods on different ... [https://www.nature.com/articles/s41598-024-59086-4]
- 64. A comparison of five DNA extraction methods from ... [https://www.sciencedirect.com/science/article/pii/S0379073823001809]
- 65. A Comparison of Three Automated Nucleic Acid Extraction ... [https://pmc.ncbi.nlm.nih.gov/articles/PMC11678849/]
- 66. Denaturing gradient gel electrophoresis [https://www.research.ed.ac.uk/en/publications/denaturing-gradient-gel-electrophoresis]
- 67. Optimization of the DGGE method band identification [https://link.springer.com/article/10.1007/s12223-012-0130-9]
- 68. Using DGGE and 16S rRNA Gene Sequence Analysis ... [https://pmc.ncbi.nlm.nih.gov/articles/PMC4417478/]
- 69. High throughput sequencing technology facility research of ... [https://www.frontiersin.org/journals/plant-science/articles/10.3389/fpls.2023.1208111/full]
- 70. Evaluation of denaturing gradient gel electrophoresis ... [https://www.sciencedirect.com/science/article/abs/pii/S0167701219300995]
- 71. Denaturing gradient gel electrophoresis shows that ... [https://www.sciencedirect.com/science/article/abs/pii/S0025326X09004962]
- 72. Determining Performance Metrics for Targeted Next ... [https://pmc.ncbi.nlm.nih.gov/articles/PMC6172655/]
- 73. Sequencing Quality Scores [https://www.illumina.com/science/technology/next-generation-sequencing/plan-experiments/quality-scores.html]
- 74. Evaluation of denaturing gradient gel electrophoresis ... [https://pubmed.ncbi.nlm.nih.gov/31051187/]
- 75. Bacterial Community Structure in the Hyperarid Core of the ... [https://pmc.ncbi.nlm.nih.gov/articles/PMC1694221/]
- 76. Nested PCR-denaturing gradient gel electrophoresis ... [https://www.sciencedirect.com/science/article/pii/S094450131400024X]
- 77. PCR-DGGE Analysis: Unravelling Complex Mixtures of ... [https://www.mdpi.com/1999-4915/9/7/181]
- 78. Highly Discriminatory Single-Nucleotide Polymorphism ... [https://pmc.ncbi.nlm.nih.gov/articles/PMC2897452/]
- 79. Quantitative improvement of 16S rDNA DGGE analysis for ... [https://www.sciencedirect.com/science/article/abs/pii/S0167701209001778]
- 80. Comparisons of Different Hypervariable Regions of rrs ... [https://pmc.ncbi.nlm.nih.gov/articles/PMC492348/]
- 81. Polymerase chain reaction/denaturing gradient gel ... - PubMed [https://pubmed.ncbi.nlm.nih.gov/10608248/]
- 82. Comparison of DNA extraction kits for PCR-DGGE analysis of human intestinal microbial communities from fecal specimens - PubMed [https://pubmed.ncbi.nlm.nih.gov/20492702/]
- 83. DGGE fingerprinting of culturable soil bacterial ... [https://www.sciencedirect.com/science/article/abs/pii/S0038071707000314]
- 84. Denaturing Gradient Gel Electrophoresis Analysis of the 16S rRNA Gene V1 Region To Monitor Dynamic Changes in the Bacterial Population during Fermentation of Italian Sausages - PMC [https://pmc.ncbi.nlm.nih.gov/articles/PMC93279/]
- 85. DGGE with genomic DNA: suitable for detection of numerically important organisms but not for identification of the most abundant organisms - PubMed [https://pubmed.ncbi.nlm.nih.gov/18929384/]
- 86. Analysis of Bacterial Communities in Soil by Use ... [https://pmc.ncbi.nlm.nih.gov/articles/PMC2394888/]
- 87. Denaturing Gradient Gel Electrophoresis as a Diagnostic ... [https://pmc.ncbi.nlm.nih.gov/articles/PMC1594801/]
- 88. Chapter 6 Applications of denaturing gradient gel ... [https://www.sciencedirect.com/science/article/pii/S1571919705800308]