Metagenomics for Microbial Community Analysis: Techniques, Applications, and Best Practices in Biomedical Research
This article provides a comprehensive overview of metagenomics and its transformative role in analyzing complex microbial communities.
Metagenomics for Microbial Community Analysis: Techniques, Applications, and Best Practices in Biomedical Research
Abstract
This article provides a comprehensive overview of metagenomics and its transformative role in analyzing complex microbial communities. Tailored for researchers, scientists, and drug development professionals, it covers foundational principles from microbial diversity to resistome analysis, explores cutting-edge methodological approaches including mNGS and tNGS, addresses critical troubleshooting and data analysis challenges, and offers validation frameworks for clinical and industrial applications. By synthesizing current research and practical insights, this guide serves as an essential resource for leveraging metagenomics in pharmaceutical development, diagnostic innovation, and therapeutic discovery.
Unlocking Microbial Dark Matter: Principles and Exploratory Potential of Metagenomics
Metagenomics represents a fundamental shift in the study of microbial communities, allowing researchers to investigate genomic material recovered directly from environmental samples, thus bypassing the need for laboratory cultivation [1]. The term "metagenome" was first introduced by Handelsman et al., who used genomic fragments from environmental samples cloned in E. coli to explore new mechanisms and antibiotic features [1]. This approach has revolutionized microbial ecology by providing unprecedented access to the vast diversity of microorganisms that cannot be cultured using standard methods, enabling insights into the structure, function, and interactions of microbial communities across diverse environments—from natural and engineered systems to the human body [2] [1].
Metagenomic studies are generally classified into two primary approaches based on the type of data generated: amplicon metagenomics (targeted gene sequencing) and shotgun metagenomics (whole-genome sequencing) [1]. While amplicon metagenomics typically focuses on taxonomic profiling through the sequencing of marker genes like 16S/18S/26S rRNA or ITS regions, shotgun metagenomics sequences all DNA fragments in a sample, enabling functional gene analysis and metabolic pathway reconstruction [1] [3]. The continuous advancement of sequencing technologies and bioinformatic tools has significantly expanded the applications of metagenomics in human health, agriculture, food safety, and environmental monitoring [1].
Comparative Analysis of Metagenomic Approaches
The selection between amplicon and shotgun metagenomic approaches depends on research objectives, budgetary constraints, and desired outcomes. The table below summarizes the key characteristics of each method.
Table 1: Comparison of Amplicon and Shotgun Metagenomic Approaches
| Feature | Amplicon Metagenomics | Shotgun Metagenomics |
|---|---|---|
| Data Type | Targeted marker gene sequences (e.g., 16S rRNA) [1] | All DNA fragments in a sample [1] |
| Primary Application | Taxonomic profiling and microbial diversity [1] | Functional gene mining and metabolic pathway analysis [1] |
| Sequencing Depth | Moderate | High |
| Cost | Lower | Higher |
| Bioinformatic Complexity | Lower | Higher |
| Ability to Discover New Genes | Limited | Comprehensive |
| Resolution | Often to genus level | Can achieve species or strain level |
| Functional Insights | Indirect inference | Direct prediction |
Experimental Protocol for Metagenomic Analysis
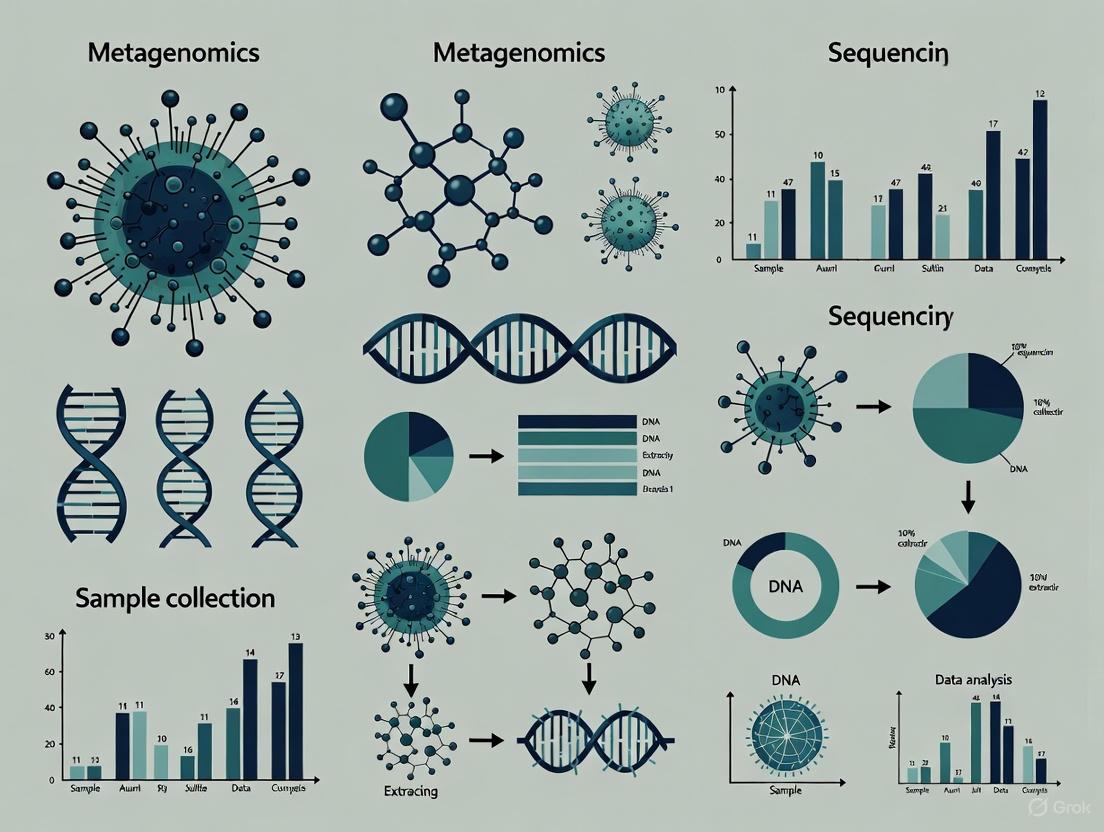
A robust metagenomic study requires careful execution of a multi-step protocol, from sample collection to data visualization. The following section outlines a standardized workflow.
Sample Collection and DNA Extraction
- Sample Collection: Collect samples (e.g., soil, water, fecal matter) directly from the field using sterile techniques to prevent contamination from external sources [1]. The sample type and collection method must be tailored to the specific research question and environment.
- DNA Extraction: Perform DNA extraction using protocols or commercial kits specifically designed for metagenomic studies to maximize yield and minimize impurities from host DNA or inhibitors [1]. Common kits include the FastDNA Spin Kit for Soil, MagAttract PowerSoil DNA KF Kit, and PureLink Microbiome DNA Purification Kit [1]. The efficiency of DNA extraction is critical for downstream sequencing success.
Sequencing Standards and Quantitative Metagenomics
For absolute quantification of targets within a metagenome, the use of spike-in DNA standards is recommended.
- Spike-in Standards: Add synthetic DNA standards at known concentrations to the sample prior to DNA extraction [2]. These standards, such as the Sequins dsDNA standards or custom single-stranded DNA (ssDNA) fragments, serve as internal controls for quantifying absolute abundance of microbial populations, genes, or viruses [2].
- Quantitative Computational Analysis: Use computational tools like QuantMeta to determine the absolute abundance of targets. This tool establishes entropy-based detection thresholds to confirm target presence and implements methods to identify and correct read mapping or assembly errors, thereby improving quantification accuracy [2].
Library Preparation and Sequencing
- Amplicon Sequencing: For amplicon metagenomics, amplify specific hypervariable regions of marker genes (e.g., V3-V4 of the 16S rRNA gene) using universal primers [1]. The amplified products are then prepared for sequencing.
- Shotgun Sequencing: For shotgun metagenomics, fragment the extracted DNA into smaller pieces and prepare sequencing libraries without a targeted amplification step [1].
- Sequencing Platforms: Utilize next-generation sequencing platforms such as Illumina (short reads), or PacBio and Oxford Nanopore Technologies (long reads) to generate the sequence data [1].
The following diagram illustrates the complete experimental workflow from sample to sequence.
Computational Analysis of Metagenomic Data
The analysis of sequenced metagenomic data involves a multi-step computational pipeline to transform raw reads into biological insights. The key steps are detailed below, with corresponding visual workflow.
Data Pre-processing
- Data Integrity Assessment: Verify file completeness and integrity using cryptographic hashing (e.g.,
md5sum) [3]. - Quality Control: Assess read quality with tools like FastQC [3]. Remove adapter sequences, and trim low-quality bases using Trimmomatic or KneadData [3]. Accept libraries where ≥85% of bases have a Phred score ≥30 (Q30) [3].
- Host DNA Removal: Align reads to a host reference genome (e.g., GRCh38 for human samples) using Bowtie2 or Kraken2 to filter out host-derived sequences, thereby enriching microbial signals [3].
Assembly, Binning, and Gene Prediction
- De Novo Assembly: Assemble quality-filtered short reads into contiguous sequences (contigs) using assemblers like MEGAHIT or metaSPAdes [3].
- Binning: Cluster contigs into Metagenome-Assembled Genomes (MAGs) based on sequence composition and abundance, using tools such as MetaBAT 2 [3]. Refine bins with pipelines like MetaWRAP to meet quality thresholds (completeness and contamination) [3].
- Gene Prediction and Clustering: Predict open reading frames (ORFs) from contigs or MAGs with Prokka or Prodigal [3]. Create a non-redundant gene catalog by clustering predicted proteins using CD-HIT or MMseqs2 [3].
Taxonomic and Functional Annotation
- Taxonomic Profiling: Classify microbial constituents using a combination of tools. MetaPhlAn 4 offers species-level precision with clade-specific marker genes, Kraken 2 provides high sensitivity via k-mer hashing, and GTDB-Tk enables phylogenomic placement of novel lineages [3].
- Functional Annotation: Assign functional terms to predicted genes by comparing them against databases such as eggNOG, KEGG (using KofamKOALA), CAZy, and MEROPS [3]. Detect antimicrobial resistance genes with AMRFinderPlus [3].
Quantitative Metagenomics and Data Analysis
Gene and Taxon Abundance Quantification
Quantifying abundance is essential for understanding community structure and functional potential. Two primary strategies are employed:
- Read-Mapping Strategy: Map quality-controlled reads back to the non-redundant gene catalog or reference genomes using alignment tools like BWA or Bowtie 2 [3]. Calculate gene coverage with tools such as CoverM [3].
- k-mer-based Strategy: Use alignment-free tools like Salmon for faster abundance estimation based on k-mer frequencies [3].
- Normalization: Normalize abundance counts using measures like TPM (Transcripts Per Million) for cross-sample comparison or RPKM (Reads Per Kilobase per Million) for single-end libraries [3].
Limits of Detection and Quantification
The quantitative metagenomics approach, while powerful, has specific performance boundaries. The QuantMeta tool establishes a detection threshold of approximately 500 copies/μl, which is higher than the detection limit of quantitative PCR (qPCR)-based assays (approximately 10 copies/μl), even at a sequencing depth of 200 million reads per sample [2]. This highlights the importance of understanding the limitations of the method when interpreting results, especially for low-abundance targets.
Table 2: Key Reagents and Computational Tools for Metagenomics
| Category/Item | Specific Examples | Function and Application |
|---|---|---|
| DNA Extraction Kits | FastDNA Spin Kit for Soil, MagAttract PowerSoil DNA KF Kit, PureLink Microbiome DNA Purification Kit [1] | Efficient lysis and purification of microbial DNA from complex samples. |
| Synthetic DNA Standards | Sequins dsDNA standards, custom ssDNA fragments [2] | Spike-in controls for absolute quantification of targets in a metagenome. |
| Quality Control Tools | FastQC, MultiQC, Trimmomatic, KneadData [3] | Assess and improve read quality; remove adapters and low-quality bases. |
| Host Removal Tools | Bowtie2, BWA, Kraken2 [3] | Filter out host-derived sequences to increase microbial read proportion. |
| Assembly & Binning Tools | MEGAHIT, metaSPAdes, MetaBAT 2, MetaWRAP [3] | Reconstruct contiguous sequences (contigs) and Metagenome-Assembled Genomes (MAGs). |
| Annotation & Profiling Tools | MetaPhlAn 4, Kraken 2, GTDB-Tk, Prokka, eggNOG-mapper, HUMAnN 3 [3] | Perform taxonomic classification and functional annotation of genes/MAGs. |
Advanced Applications and Future Perspectives
Metagenomics has moved beyond basic characterization to enable advanced applications in various fields. In human health, it is used to explore the gut microbiome's role in disease and health, and to track pathogens and antimicrobial resistance genes in clinical and wastewater samples [2] [1]. In drug discovery, functional metagenomics facilitates the culture-independent discovery of novel bioactive small molecules and enzymes from uncultured microorganisms [4]. In environmental sciences, metagenomics helps monitor bioremediation processes, assess ecosystem health, and understand biogeochemical cycling (e.g., carbon, nitrogen, sulfur) in diverse habitats, from landfills to extreme environments [1] [4].
Future developments in metagenomics will likely be driven by the increased adoption of long-read sequencing technologies, which improve genome assembly completeness [1]. Furthermore, the integration of metagenomics with other 'omics' technologies (metatranscriptomics, metaproteomics) and the application of more sophisticated computational models will provide a more holistic and mechanistic understanding of microbial community functions and dynamics [1].
Application Note
This application note outlines advanced metagenomic protocols for exploring microbial communities in two critical yet underexplored ecosystems: the human gut and environmental low-biomass habitats. Leveraging graph-based neural networks for predictive modeling and stringent contamination controls, these frameworks support the broader thesis that advanced metagenomics is essential for translating microbial community analysis into actionable insights for human health and environmental management.
Enhanced metagenomic strategies now enable researchers to move beyond taxonomic catalogs to functional and predictive insights. In the human gut, this reveals the microbiota's role in metabolic and immunological pathways, with dysbiosis linked to conditions like inflammatory bowel disease (IBD), obesity, and type 2 diabetes [5]. In parallel, low-biomass environments—such as drinking water, the atmosphere, and certain human tissues—present unique challenges where contaminating DNA can overwhelm the true biological signal, necessitating specialized methods from sample collection to data analysis [6].
A key advancement is the ability to predict temporal microbial dynamics. A graph neural network model developed for wastewater treatment plants (WWTPs) accurately forecasted species-level abundance up to 2-4 months into the future using only historical relative abundance data [7]. This demonstrates the power of computational models to anticipate community fluctuations critical for ecosystem management and stability.
Experimental Protocols
Protocol 1: Predictive Modeling of Microbial Community Dynamics Using Graph Neural Networks
This protocol describes a method for predicting future abundance of individual microbial taxa in a time-series dataset, as demonstrated in full-scale wastewater treatment plants [7]. The "mc-prediction" workflow uses historical relative abundance data to forecast community dynamics.
Materials and Reagents
- Biological Sample: Longitudinal samples from the ecosystem of interest (e.g., activated sludge, human gut).
- DNA Extraction Kit: Standard kit for environmental or host-associated samples.
- 16S rRNA Gene Amplicon Reagents: Primers (e.g., 515F/806R for bacteria), high-fidelity DNA polymerase, and purification reagents.
- Sequencing Platform: Illumina MiSeq, HiSeq, or similar next-generation sequencer.
- Computational Resources: High-performance computing cluster with at least 32 GB RAM and Python 3.8+ installed.
- Software: "mc-prediction" workflow (https://github.com/kasperskytte/mc-prediction) [7].
Procedure
- Sample Collection and Sequencing: Collect time-series samples (e.g., 2-5 times per month for several years). Extract genomic DNA and perform 16S rRNA gene amplicon sequencing using a standardized protocol [7] [8].
- Bioinformatic Processing: Process raw sequences through a standard amplicon sequence variant (ASV) pipeline (e.g., DADA2). Classify ASVs taxonomically using an ecosystem-specific database like MiDAS 4 for wastewater [7].
- Data Curation: Filter the ASV table to include the top 200 most abundant taxa. Create a chronological 3-way split of the data into training, validation, and test sets (e.g., 60%/20%/20%) [7].
- Pre-clustering of ASVs: Cluster ASVs into groups (e.g., of 5 ASVs) based on learned graph network interaction strengths from the model itself. Alternatively, use ranked abundance clustering or biological function as a secondary strategy [7].
- Model Training and Prediction:
- For each cluster, train a graph neural network model on moving windows of 10 consecutive historical samples.
- The model architecture should include: a graph convolution layer to learn microbe-microbe interaction strengths, a temporal convolution layer to extract temporal features, and an output layer with fully connected neural networks [7].
- Use the validation set for hyperparameter tuning. The model output is the predicted relative abundance for each ASV across the next 10 consecutive time points.
- Model Validation: Evaluate prediction accuracy on the held-out test set using metrics such as Bray-Curtis dissimilarity, mean absolute error, and mean squared error, comparing predictions to true historical data [7].
Troubleshooting
- Low Prediction Accuracy: Ensure the time-series is long enough (≥3 years); increase the number of training samples. Experiment with different pre-clustering methods (e.g., ranked abundance instead of biological function) [7].
- Computational Intensity: The model is designed to be trained on individual time-series. For very large datasets, ensure adequate RAM and consider using GPU acceleration.
Protocol 2: Metagenomic Analysis of Low-Biomass Microbiome Samples
This protocol provides a stringent workflow for marker gene and metagenomic analysis of low-biomass samples (e.g., human tissue biopsies, drinking water, atmospheric samples) where contamination is a critical concern [6].
Materials and Reagents
- Personal Protective Equipment (PPE): Gloves, goggles, cleanroom suits, face masks, and shoe covers.
- DNA Decontamination Reagents: 80% ethanol, DNA degradation solution (e.g., 1-5% sodium hypochlorite (bleach)), or commercially available DNA removal solutions.
- DNA-Free Consumables: Single-use, sterile, DNA-free swabs, collection vessels, and filter units.
- Negative Controls: DNA-free water, empty collection vessels, swabs of air in the sampling environment, and aliquots of preservation solutions.
- DNA Extraction Kit: Kit validated for low-biomass inputs, preferably with an internal DNA standard to assess recovery.
- Sequencing Library Kit: Kit suitable for low-input DNA, with unique dual-indexes to track cross-contamination.
Procedure
- Pre-Sampling Decontamination:
- Decontaminate all reusable equipment and surfaces with 80% ethanol followed by a DNA degradation solution (e.g., bleach). Use UV-C light sterilization where applicable [6].
- Use single-use, DNA-free plasticware and collection vessels whenever possible. Autoclaving is insufficient for removing trace DNA [6].
- Sample Collection with Contamination Controls:
- Personnel must wear appropriate PPE (gloves, mask, cleansuit) to minimize contamination from human operators [6].
- Collect samples with minimal handling. Simultaneously, collect multiple negative controls, such as:
- An empty collection vessel.
- A swab exposed to the air in the sampling environment.
- An aliquot of the sample preservation solution [6].
- DNA Extraction and Sequencing:
- Process samples and negative controls together through all subsequent steps.
- Extract DNA using a protocol that minimizes reagent contamination. Include an internal DNA standard (e.g., from a species not expected in the sample) to quantify DNA recovery efficiency and identify inhibition [6] [8].
- Prepare sequencing libraries with unique dual-indexes to mitigate the risk of index hopping and cross-contamination between samples [6].
- Bioinformatic Analysis and Contaminant Removal:
- Process sequences through a standard metagenomic or 16S rRNA gene pipeline.
- Use positive and negative control data in conjunction with tools like
decontam(R package) to statistically identify and remove contaminant sequences present in negative controls from the true sample data [6].
Troubleshooting
- High Contamination in Controls: Review decontamination procedures for reagents and equipment. Increase the number and type of negative controls to better identify contamination sources [6].
- Low DNA Yield: For very low yields, Multiple Displacement Amplification (MDA) can be used but may introduce sequence bias and chimeras; results should be interpreted with caution [8].
Data Presentation
Table 1: Quantitative Performance of Graph Neural Network for Predicting Microbial Dynamics
Table summarizing the prediction accuracy and parameters from a study predicting species dynamics in 24 wastewater treatment plants [7].
| Metric | Value / Range | Description / Context |
|---|---|---|
| Prediction Horizon | 10 time points (2–4 months); up to 20 points (8 months) | Accuracy maintained for 2-4 months, sometimes longer [7] |
| Number of Samples | 4,709 total across 24 plants | 3–8 years of sampling, 2–5 times per month [7] |
| Taxonomic Resolution | Amplicon Sequence Variant (ASV) | Highest possible resolution for 16S rRNA gene data [7] |
| Top ASVs Covered | 52–65% of total sequence reads | Analysis focused on the top 200 most abundant ASVs [7] |
| Optimal Pre-clustering Method | Graph network interaction strengths | Outperformed clustering by biological function or ranked abundance [7] |
Table 2: Key Microbial Metabolites and Their Roles in Human Health and Disease
Table based on a review of gut microbiota's functional role in homeostasis and dysbiosis [5].
| Microbial Metabolite | Producing Taxa (Examples) | Role in Human Health & Disease |
|---|---|---|
| Short-chain Fatty Acids (SCFAs) e.g., Butyrate, Acetate | Faecalibacterium prausnitzii, Clostridial clusters | Reinforce intestinal barrier, induce T-reg differentiation, anti-inflammatory; depletion linked to IBD [5] |
| Secondary Bile Acids e.g., Deoxycholic acid | Clostridium scindens | Disrupts FXR signaling in the liver; implicated in onset of NAFLD [5] |
| Indole Derivatives | Akkermansia muciniphila, other symbionts | Enhance mucosal immunity, produce anti-inflammatory metabolites [5] |
Signaling Pathways and Workflow Visualizations
Low-Biomass Metagenomic Workflow
Gut-Brain Axis Signaling Pathways
The Scientist's Toolkit
Research Reagent Solutions for Metagenomic Workflows
| Item | Function & Application |
|---|---|
| Ecosystem-Specific Taxonomic Database (e.g., MiDAS 4) | Provides high-resolution taxonomic classification for 16S rRNA gene amplicon data from specific environments like wastewater, improving annotation accuracy [7]. |
| DNA Degradation Solution (e.g., Bleach) | Crucial for decontaminating surfaces and equipment in low-biomass studies. Removes contaminating DNA that persists after ethanol treatment or autoclaving [6]. |
| Unique Dual-Indexed Sequencing Primers | Allows for multiplexing of samples while minimizing the risk of index hopping and cross-contamination during high-throughput sequencing, essential for all study types [6]. |
| Internal DNA Standard | A known, alien DNA sequence added to samples during DNA extraction. Used in low-biomass studies to quantify DNA recovery efficiency and identify PCR inhibition [6] [8]. |
| Multiple Displacement Amplification (MDA) Reagents | Used to amplify femtogram amounts of DNA to microgram yields for sequencing when sample biomass is extremely low. Carries risks of amplification bias and contamination [8]. |
| Diniprofylline | Diniprofylline |
| 20-Hydroxyecdysone | 20-Hydroxyecdysone (Ecdysterone)|CAS 5289-74-7 |
Antimicrobial resistance (AMR) represents one of the most severe threats to global public health, with drug-resistant infections causing millions of deaths annually [9] [10]. The resistome, defined as the comprehensive collection of all antimicrobial resistance genes (ARGs) and their precursors in a given environment, extends far beyond clinical settings into natural and engineered ecosystems [11] [12]. Understanding these environmental resistomes is crucial, as they serve as reservoirs for the emergence and dissemination of resistance determinants to clinically relevant pathogens.
Metagenomics, the sequenced-based analysis of genetic material recovered directly from environmental or clinical samples, has emerged as a transformative tool for AMR surveillance [9]. This culture-independent approach enables researchers to comprehensively profile resistance genes and their bacterial hosts across diverse microbial communities, providing unprecedented insights into the distribution, evolution, and transmission of AMR determinants [11] [10]. This Application Note details standardized protocols for resistome profiling in diverse environments, framing the methodologies within the broader context of microbial community analysis research.
Experimental Design and Workflows
The successful profiling of environmental resistomes requires careful experimental design, spanning sample collection, DNA processing, sequencing, and computational analysis. The following section outlines core and advanced methodologies.
Core Metagenomic Workflow for Resistome Profiling
The foundational workflow for resistome analysis involves sample collection, DNA extraction, library preparation, sequencing, and bioinformatic analysis. The diagram below illustrates this integrated pipeline.
Advanced Workflow for Linking ARGs to Hosts and Plasmids
For studies requiring the association of ARGs with their microbial hosts and mobile genetic elements (MGEs), long-read sequencing technologies and specialized bioinformatic methods are recommended. The following workflow details this advanced approach.
Key Experimental Protocols
Sample Collection and Preservation from Diverse Environments
Principle: Consistent collection and stabilization methods are critical for obtaining representative microbial community DNA and minimizing bias [11] [10].
Materials:
- Sterile sample containers (50mL conical tubes for water; zip-lock bags for soil/sediment)
- RNAlater stabilization solution
- Cold chain equipment (coolers, ice packs, -80°C freezer)
- Personal protective equipment (gloves, lab coat)
- GPS unit for geolocation
- pH and conductivity meters
Procedure:
- Water/Sediment Sampling: Collect at least 50mL of water or 10g of sediment from each site using sterile containers. For wastewater samples, collect from subsurface to avoid debris [11].
- Immediate Preservation: For DNA-based studies, immediately mix samples with RNAlater (1:5 sample:preservative ratio) or flash-freeze in liquid nitrogen for long-term storage at -80°C [10].
- Metadata Recording: Document critical parameters including GPS coordinates, date/time, pH, temperature, conductivity, and visible characteristics.
- Transport: Maintain cold chain (2-8°C) during transport to laboratory. Process samples within 24 hours of collection.
DNA Extraction and Library Preparation for Metagenomic Sequencing
Principle: High-quality, high-molecular-weight DNA is essential for representative metagenomic analysis. Extraction methods must efficiently lyse diverse microbial taxa while minimizing bias [10].
Materials:
- PowerSoil DNA Isolation Kit (MO BIO Laboratories) or QIAamp Fast DNA Stool Mini Kit
- Qubit Fluorometer and dsDNA HS Assay Kit
- Agarose gel electrophoresis equipment
- Illumina Nextera XT or ONT Ligation Sequencing Kit
Procedure:
- Cell Lysis: Process 0.25-0.5g of sample according to kit protocols, incorporating both mechanical and chemical lysis steps.
- DNA Purification: Bind DNA to silica membrane, wash thoroughly, and elute in low-EDTA TE buffer or nuclease-free water.
- Quality Assessment: Quantify DNA using Qubit Fluorometer. Verify integrity via 0.8% agarose gel electrophoresis. Ensure A260/A280 ratio of 1.8-2.0.
- Library Preparation: For Illumina: Fragment 1ng DNA, attach indices with Nextera XT Kit. For Nanopore: Use Ligation Sequencing Kit with native DNA for methylation analysis [13].
- Library QC: Validate fragment size distribution using Bioanalyzer/TapeStation. Quantify libraries for pooling.
Bioinformatic Analysis of Resistome Data
Principle: Computational pipelines identify and quantify ARGs in metagenomic data while providing taxonomic context and risk assessment [14] [15].
Materials:
- High-performance computing cluster or server (minimum 8GB RAM, 4 CPU cores)
- Bioinformatic tools: AMRViz, ResistoXplorer, CARPDM
- Reference databases: CARD, ResFinder, MEGARes
Procedure:
- Quality Control: Remove adapter sequences and low-quality reads using Fastp or Trimmomatic.
- ARG Profiling:
- Read-based: Align reads to ARG databases using BLAST or Bowtie2.
- Assembly-based: Assemble quality-filtered reads into contigs using metaSPAdes or Flye. Annotate contigs with Prokka.
- Taxonomic Profiling: Assign reads/contigs to taxonomic groups using MetaPhlAn or Kraken2.
- Data Analysis: Import ARG abundance tables into ResistoXplorer for statistical analysis, visualization, and resistome risk scoring [14].
- Host Linking: For long-read data, use methylation patterns (via NanoMotif) to associate plasmids with bacterial hosts [13].
Data Presentation and Analysis
Quantitative Resistome Profiles from Environmental Studies
Table 1: Resistome composition across diverse environmental samples based on recent metagenomic studies. Data are presented as relative abundance (%) of ARGs by drug class.
| Drug Class | Wastewater (India) [11] | Poultry (Nepal) [10] | Urban Gutters (India) [12] |
|---|---|---|---|
| Multidrug | 40.49% | 22.5% | 18.7% |
| MLS | 15.84% | 12.8% | 9.3% |
| Beta-lactam | 7.95% | 15.2% | 35.4% |
| Tetracycline | 6.52% | 18.6% | 8.9% |
| Aminoglycoside | 4.18% | 9.4% | 12.1% |
| Fluoroquinolone | 2.37% | 6.2% | 7.5% |
| Other | 22.65% | 15.3% | 8.1% |
Table 2: Key ARG subtypes and their prevalence in environmental samples. Data indicates presence (+) and relative abundance where quantified.
| ARG Subtype | Molecular Mechanism | Wastewater [11] | Poultry [10] | Human Gut [10] |
|---|---|---|---|---|
| sul1 | Sulfonamide resistance | High | + | + |
| acrB | Multidrug efflux pump | High | + | + |
| OXA variants | Beta-lactamase | High | + | + |
| mdr(ABC) | Multidrug transport | High | + | + |
| tet(M) | Tetracycline resistance | Moderate | + | + |
| qnrS | Fluoroquinolone resistance | Low | + | + |
| blaCTX-M | Extended-spectrum beta-lactamase | Moderate | + | + |
Methodological Comparisons for Resistome Profiling
Table 3: Comparison of key methodological approaches for resistome profiling in metagenomic studies.
| Method Aspect | Standard Approach | Advanced Approach | Utility |
|---|---|---|---|
| Sequencing Technology | Illumina short-read | Oxford Nanopore/PacBio long-read | Enables plasmid reconstruction and host linking [13] |
| Gene Detection | Read-based alignment | Assembly-based contig analysis | Provides genomic context for ARGs [13] |
| Host Assignment | Taxonomic binning | Methylation pattern matching | Links plasmids to specific bacterial hosts [13] |
| Variant Detection | Not applicable | Strain-level haplotyping | Identifies resistance-associated point mutations [13] |
| Cost Efficiency | Standard shotgun sequencing | Targeted enrichment (CARPDM) | Increases sensitivity for low-abundance ARGs [16] |
The Scientist's Toolkit
Table 4: Essential research reagents and computational tools for resistome profiling.
| Tool/Reagent | Type | Function | Application Notes |
|---|---|---|---|
| PowerSoil DNA Kit | Wet lab reagent | DNA extraction from environmental samples | Effective for difficult samples; minimizes inhibitors |
| CARPDM Probe Sets | Wet lab reagent | Targeted enrichment of ARGs | Increases ARG detection sensitivity; cost-effective [16] |
| Oxford Nanopore R10.4.1 | Sequencing consumable | Long-read sequencing with methylation detection | Enables plasmid host linking via methylation patterns [13] |
| AMRViz | Computational tool | Visualization and analysis of AMR genomics | Generates interactive reports on resistome structure [15] |
| ResistoXplorer | Computational tool | Statistical resistome analysis | Performs differential abundance and risk scoring [14] |
| Comprehensive Antibiotic Resistance Database (CARD) | Reference database | ARG annotation and classification | Essential for standardized gene naming [16] |
| NanoMotif | Computational tool | Methylation motif detection | Identifies common methylation patterns for host linking [13] |
| Ellipticine hydrochloride | Ellipticine hydrochloride, CAS:5081-48-1, MF:C17H15ClN2, MW:282.8 g/mol | Chemical Reagent | Bench Chemicals |
| Gentamicin | Gentamicin, CAS:1403-66-3, MF:C21H43N5O7, MW:477.6 g/mol | Chemical Reagent | Bench Chemicals |
Metagenomic approaches to resistome profiling provide powerful capabilities for tracking AMR across diverse environments. The standardized protocols detailed in this Application Note enable comprehensive characterization of resistance genes, their mechanisms of transfer, and their bacterial hosts. The integration of wet lab methodologies with advanced computational tools creates a robust framework for environmental AMR surveillance within a One Health context.
As resistome profiling technologies continue to evolve, particularly through long-read sequencing and targeted enrichment approaches, researchers will gain increasingly precise insights into the emergence and dissemination of antimicrobial resistance in complex microbial communities. These advancements will ultimately inform evidence-based interventions and mitigation strategies to curb the spread of resistant contaminants across ecosystems.
The vast majority of microorganisms on Earth have eluded laboratory cultivation, creating a significant gap in our understanding of microbial life. Only approximately 1% of environmental bacteria can be grown using standard techniques, leaving a staggering 99% of microbial diversity largely unexplored and referred to as "microbial dark matter" [17] [18]. This uncultured majority represents an enormous reservoir of genetic and metabolic novelty with profound implications for biotechnology, medicine, and fundamental biology.
The discovery of this hidden world emerged from the observation of the "great plate count anomaly" – the consistent discrepancy between microscopic cell counts and colony-forming units, which can differ by four to six orders of magnitude in some environments [19] [17]. Molecular techniques, particularly 16S rRNA gene sequencing, confirmed that most microbial lineages have no cultivated representatives, with the majority of the 85+ bacterial phyla identified through sequencing remaining uncultured [17]. This review provides application notes and protocols for accessing this untapped diversity through integrated cultivation and metagenomic approaches.
Methodological Approaches: Bridging the Cultivation Gap
Advanced Cultivation Techniques
Diffusion Chamber-Based Methods The diffusion chamber and its high-throughput descendant, the Isolation Chip (iChip), enable cultivation by simulating natural environmental conditions [17] [18]. These devices consist of semi-permeable membranes that allow chemical exchange with the native environment while trapping bacterial cells for observation.
Table 1: Comparison of Cultivation Techniques for Unculturable Microbes
| Technique | Key Principle | Success Rate | Applications |
|---|---|---|---|
| Diffusion Chamber/iChip | Semi-permeable membrane allows environmental diffusion | Up to 40% recovery vs. 0.05% on plates [17] | Broad-spectrum antibiotic discovery [18] |
| Complex Carbon Enrichment | Natural organic carbon sources (e.g., sediment DOM) | Enriches distinct phyla (Verrucomicrobia, Planctomycetes) [20] | Subsurface microbial cultivation |
| Co-culture Approaches | Simulates microbial interdependencies | Enables growth of dependent species [17] | Studying microbial interactions |
| Resuscitation-Promoting Factors | Bacterial cytokines stimulate growth | Increases diversity of cultured taxa [21] | Soil and environmental samples |
Protocol 2.1.1: Diffusion Chamber Cultivation
- Prepare a diluted cell suspension from environmental samples (e.g., soil, sediment)
- Sandwich the suspension between semi-permeable membranes mounted on washers
- Incubate the chamber in the natural environment or simulated conditions for 2-6 weeks
- Monitor microcolony formation microscopically
- Transfer established microcolonies to standard media for further cultivation
Complex Carbon Source Enrichment Natural organic carbon sources dramatically improve cultivation success for diverse microorganisms. Sediment dissolved organic matter (DOM) and bacterial cell lysate outperform simple carbon sources in enriching for underrepresented phyla [20].
Protocol 2.1.2: Complex Carbon Enrichment
- Prepare carbon sources:
- Extract sediment DOM with Milli-Q water (4:1 water:sediment ratio)
- Prepare bacterial cell lysate by autoclaving and sonicating Pseudomonas culture
- Set up microcosms: 89 mL filtered groundwater + 10 mL unfiltered groundwater inoculum + 1 mL carbon source
- Incubate under environmental conditions (e.g., 15°C for subsurface samples)
- Subculture every 30 days onto solid media with corresponding carbon sources
Metagenomic and Single-Cell Approaches
Metagenomic Sequencing Strategies Metagenomics enables genomic analysis without cultivation through two primary approaches: amplicon sequencing (targeting 16S/18S/ITS genes) and shotgun sequencing (capturing all DNA) [1]. Recent advances in long-read sequencing (Nanopore, PacBio) have significantly improved genome recovery from complex environments [22].
Table 2: Metagenomic Sequencing Platforms and Applications
| Platform | Read Length | Applications | Considerations |
|---|---|---|---|
| Illumina | Up to 300 bp | Amplicon sequencing (16S), shallow shotgun | High accuracy, short reads limit assembly |
| PacBio | >1,000 bp | Full-length 16S, metagenome-assembled genomes | Higher cost, better assembly |
| Oxford Nanopore | >1,000 bp | Complex environment genome recovery [22] | Portable, higher error rate (improving) |
Protocol 2.2.1: Metagenome-Assembled Genome Recovery
- DNA Extraction: Use specialized kits (e.g., FastDNA Spin Kit for Soil) appropriate for sample type
- Library Preparation & Sequencing: Generate ~100 Gbp long-read data per sample for complex soils [22]
- Bioinformatic Processing:
- Quality control (FastQC, Trimmomatic)
- Assembly (metaSPAdes, Canu)
- Binning (MetaBAT2, MaxBin2)
- Refinement (CheckM, DAS Tool)
Single-Cell Genomics Single-cell amplified genome (SAG) approaches isolate and amplify genomes from individual cells, bypassing cultivation entirely. The Cleaning and Co-assembly of SAGs (ccSAG) workflow significantly improves genome quality by removing chimeric sequences [23].
Protocol 2.2.2: Single-Cell Genome Amplification and Analysis
- Single-Cell Isolation: Use microfluidic droplet technology or fluorescence-activated cell sorting
- Whole-Genome Amplification: Multiple displacement amplification (MDA) with phi29 polymerase
- Sequencing and Cleaning:
- Apply ccSAG workflow for chimera removal
- Perform cross-reference mapping to identify chimeric reads
- Co-assemble multiple related SAGs to improve coverage
Figure 1: Integrated Workflow for Studying Uncultured Microbes. This diagram illustrates the complementary relationship between cultivation-dependent and cultivation-independent approaches, highlighting how metagenomic data can guide cultivation strategies and vice versa [24] [21].
Research Reagent Solutions
Table 3: Essential Research Reagents for Uncultured Microbe Studies
| Reagent/Category | Specific Examples | Function/Application |
|---|---|---|
| DNA Extraction Kits | FastDNA Spin Kit for Soil, MagAttract PowerSoil DNA KF Kit, ZymoBIOMICS Magbead DNA Kit | Optimized DNA extraction from complex matrices [1] |
| Enrichment Additives | Sediment DOM, Bacterial cell lysate, Resuscitation-promoting factors (Rpf) | Mimic natural growth conditions [20] [21] |
| Amplification Enzymes | Phi29 DNA polymerase (MDA), Bst polymerase (LAMP) | Whole-genome amplification from single cells [25] [23] |
| Culture Media Supplements | Groundwater base, Micrococcus luteus supernatant, Specific vitamin mixes | Provide essential growth factors [21] [20] |
| Sequencing Reagents | Nanopore flow cells, PacBio SMRT cells, Illumina library prep kits | Generate metagenomic and single-cell data [1] [22] |
Applications and Case Studies
Antibiotic Discovery from Uncultured Microbes
The therapeutic potential of uncultured microbes is exemplified by the discovery of teixobactin, a potent antibiotic from the previously uncultured bacterium Eleftheria terrae [18]. This breakthrough resulted from applying diffusion chamber technology to soil samples, enabling the cultivation and subsequent screening of previously inaccessible microbes.
Key Findings:
- Teixobactin shows excellent activity against Gram-positive pathogens regardless of antibiotic resistance profile
- Targets lipid II and lipid III (precursors of cell wall components), making resistance development unlikely
- Represents a new class of antibiotics with a unique mechanism of action
- Currently in late-stage preclinical development [18]
Similarly, darobactin was discovered from nematode gut symbionts and exhibits potent activity against problematic Gram-negative pathogens by targeting the BamA complex [18]. These discoveries highlight the potential of targeted cultivation approaches to address the antibiotic discovery void.
Genome-Resolved Metagenomics for Diversity Expansion
Recent advances in long-read sequencing have dramatically expanded our catalog of microbial diversity. A 2025 study applying Nanopore sequencing to 154 soil and sediment samples recovered 15,314 previously undescribed microbial species, expanding the phylogenetic diversity of the prokaryotic tree of life by 8% [22].
Methodological Innovations:
- Custom mmlong2 workflow for enhanced MAG recovery from complex samples
- Deep sequencing (~100 Gbp per sample) to capture rare community members
- Iterative binning approaches to improve genome quality
- Recovery of complete biosynthetic gene clusters and CRISPR-Cas systems [22]
This expansion of reference genomes substantially improves species-level classification of metagenomic datasets, creating a positive feedback loop for future discovery efforts.
Figure 2: Metagenome-Guided Cultivation Pipeline. This workflow illustrates how genetic information from metagenomic studies can inform targeted cultivation strategies, creating a virtuous cycle of discovery and validation [24].
The integration of cultivation-based and molecular approaches has created unprecedented opportunities to access the uncultured microbial majority. While each method has distinct advantages, their synergistic application provides the most powerful strategy for illuminating microbial dark matter. Metagenomic data guide cultivation strategies by revealing metabolic requirements, while cultivated isolates provide reference genomes that enhance metagenomic interpretations [24].
Future advancements will likely focus on several key areas:
- High-throughput cultivation platforms that simultaneously test multiple growth conditions
- In situ cultivation techniques that better simulate natural environments
- Improved single-cell genomics that reduce amplification bias and chimerism
- Machine learning approaches to predict cultivation requirements from genomic data
- Standardized methodologies for comparing and integrating results across studies
As these technologies mature, we anticipate accelerated discovery of novel microbial taxa, metabolic pathways, and bioactive compounds from previously inaccessible microbial lineages. The systematic exploration of uncultured microbes will continue to transform our understanding of microbial ecology and provide new solutions to challenges in medicine, biotechnology, and environmental sustainability.
Application Notes: Analyzing Microbial Interaction Networks
Understanding the dynamics within microbial communities requires a multi-faceted approach, combining mechanistic metabolic modeling with data-driven predictive algorithms. The integration of these methods provides a powerful framework for analyzing both host-microbe and microbe-microbe interactions within metagenomics research. The table below summarizes the core computational approaches available to researchers.
Table 1: Computational Approaches for Analyzing Microbial Community Interactions
| Method Name | Core Principle | Primary Application | Input Data Requirements | Key Outputs |
|---|---|---|---|---|
| MetConSIN [26] | Infers interactions from Genome-Scale Metabolic Models (GEMs) via Dynamic Flux Balance Analysis (DFBA). | Mechanistic understanding of metabolite-mediated interactions in a specific environment. | Genome-Scale Metabolic Models (GEMs) for community members; initial metabolite concentrations. | Time-varying networks of microbe-metabolite interactions; growth and consumption rates. |
| Graph Neural Network (GNN) [7] | Uses deep learning on historical abundance data to model relational dependencies between taxa. | Predicting future species-level abundance dynamics in a community. | Longitudinal time-series data of microbial relative abundances (e.g., 16S rRNA amplicon sequencing). | Forecasted future community composition; inferred interaction strengths between taxa. |
| Community Metabolic Modeling [27] | Simulates metabolic fluxes and cross-feeding relationships using constraint-based reconstruction and analysis (COBRA). | Investigating metabolic interdependencies and emergent community functions between host and microbes. | GEMs for host and microbial species; constraints from experimental data (optional). | Predictions of nutrient exchange, metabolic complementation, and community impact on host. |
The choice of method depends on the research goal and available data. MetConSIN offers a bottom-up, mechanistic perspective, revealing how available environmental metabolites shape interactions [26]. In contrast, Graph Neural Network models provide a top-down, data-driven approach, capable of predicting future community structures based on historical patterns alone, which is particularly valuable when detailed mechanistic knowledge is limited [7]. For direct host-microbe interactions, community metabolic modeling integrates host and microbial GEMs to simulate the reciprocal metabolic influences at this interface [27].
Protocols
Protocol 1: Constructing a Metabolically Contextualized Species Interaction Network (MetConSIN)
This protocol details the process of inferring a dynamic network of microbe-metabolite interactions from Genome-Scale Metabolic Models (GEMs) [26].
I. Materials and Reagents
- Genomic Data: High-quality genome sequences for all microbial members of the community.
- GSM Reconstruction Software: CarveME [26] or modelSEED [26] for automated construction of GEMs.
- Computational Environment: A MATLAB or Python environment capable of running Constraint-Based Reconstruction and Analysis (COBRA) Toolbox simulations.
- Metabolite Data: Initial concentrations of key environmental metabolites.
II. Experimental Procedure
Step 1: Genome-Scale Model (GSM) Reconstruction
- Obtain the genome for each microbial species in the community.
- Use an automated reconstruction tool (e.g., CarveME or modelSEED) to convert each genome into a draft GSM [26].
- Manually curate the models, focusing on exchange reactions that allow metabolites to be transported in and out of the cell, as these are critical for community interaction.
Step 2: Formulating the Dynamic Flux Balance Analysis (DFBA) Problem
- Define the shared extracellular metabolite pool
y, representing the environment. - For each microbe
iwith biomassx_i, its growth is governed by:dx_i/dt = x_i(γ_i · ψ_i), whereψ_iis the flux vector obtained by solving the FBA linear program for that microbe, andγ_iis the vector encoding the biomass objective function [26]. - The change in metabolite
jis given by:dy_j/dt = -Σ x_i (Γ*_i ψ_i)_j, whereΓ*_iis the stoichiometric matrix for exchange reactions [26]. This couples the microbes through shared metabolites.
Step 3: Simulating Community Dynamics
- Solve the DFBA system numerically. The simulation involves solving a linear program at each time step to find the optimal metabolic flux
ψ_ifor each organism, given the current metabolite concentrationsy[26]. - A key insight is that the optimal solution can be represented as a solution to a system of linear equations for a period of time, which improves computational efficiency [26].
Step 4: Network Inference and Interpretation
- The solutions to the DFBA problem are reformulated as a system of Ordinary Differential Equations (ODEs) [26].
- The coefficients of this ODE system directly define the interaction network between microbes and metabolites.
- Analyze the resulting network to identify keystone species (highly connected microbes) and critical metabolites that mediate major cross-feeding events.
The following workflow diagram illustrates the core steps of the MetConSIN protocol:
Protocol 2: Predicting Community Dynamics with Graph Neural Networks (GNNs)
This protocol uses the "mc-prediction" workflow to forecast the future abundance of individual taxa in a microbial community using historical time-series data [7].
I. Materials and Reagents
- Longitudinal Microbiome Data: A time-series of microbial community profiles (e.g., 16S rRNA amplicon sequencing) with a sufficient number of consecutive time points.
- Computing Resources: A computing environment with Python and the necessary deep learning libraries (e.g., PyTorch, DGL).
- Software: The "mc-prediction" workflow, available from the GitHub repository at
https://github.com/kasperskytte/mc-prediction[7].
II. Experimental Procedure
Step 1: Data Preprocessing and Clustering
- Process your raw sequencing data to obtain a table of Amplicon Sequence Variant (ASV) relative abundances across all time points.
- Select the top ~200 most abundant ASVs for analysis, as these typically represent the majority of the community biomass [7].
- Pre-clustering Strategy: To improve model performance, pre-cluster ASVs into smaller groups. The most effective methods are:
Step 2: Model Training and Validation
- For each cluster of ASVs, a separate Graph Neural Network model is trained.
- The model uses a moving window of 10 consecutive historical samples as input to predict the next 10 time points [7].
- The dataset must be split chronologically into training, validation, and test sets to ensure temporal validity.
Step 3: Architecture and Execution
- The GNN architecture consists of three key layers:
- Graph Convolution Layer: Learns the interaction strengths and extracts features between the ASVs in the cluster [7].
- Temporal Convolution Layer: Extracts temporal features and patterns from the historical sequence.
- Output Layer: A fully connected neural network that uses the extracted features to predict the future relative abundance of each ASV.
- Train the model and use the test set to evaluate prediction accuracy using metrics like Bray-Curtis dissimilarity, Mean Absolute Error, and Mean Squared Error [7].
Step 4: Forecasting and Analysis
- Use the trained model to forecast future community states.
- Analyze the learned graph interaction strengths to generate hypotheses about potential ecological relationships (e.g., competition, cooperation) between ASVs.
The workflow for this predictive protocol is outlined below:
The Scientist's Toolkit: Research Reagent Solutions
Table 2: Essential Reagents and Materials for Microbial Community Interaction Studies
| Item Name | Function/Application | Example Use Case |
|---|---|---|
| EcoFAB 2.0 [28] | A standardized, sterile fabricated ecosystem device for highly replicable plant-microbiome experiments. | Studying the impact of a defined synthetic microbial community on plant phenotype and root exudation under controlled conditions [28]. |
| Low-Biomass DNA Sampling Kit [29] | A specialized protocol and kit for collecting and extracting microbial DNA from samples with very low cell density, such as drinking water. | Citizen-science-led collection of tap water microbiome samples for metabarcoding and pathogen detection [29]. |
| 16S rRNA V4 Region Primers [29] | Standard primers for amplifying the V4 hypervariable region of the 16S rRNA gene for high-throughput metabarcoding. | Characterizing the total bacterial community and identifying opportunistic pathogens in environmental samples [29]. |
| Synthetic Bacterial Communities (SynComs) [28] | Defined mixtures of genetically tractable bacterial strains. | Testing hypotheses about community assembly and specific strain functions in gnotobiotic experiments [28]. |
| ModelSEED / CarveME [26] | Bioinformatics platforms for the automated construction of Genome-Scale Metabolic Models (GEMs) from genomic data. | Generating initial draft metabolic models for constraint-based modeling of microbial communities [26]. |
| Swertianin | Swertianin | |
| 2,5-Dihydroxybenzoic acid | 2,5-Dihydroxybenzoic Acid|High-Purity Research Chemical | 2,5-Dihydroxybenzoic Acid (Gentisic Acid) for research applications. This product is For Research Use Only (RUO) and is not intended for diagnostic or personal use. |
From Sample to Insight: Metagenomic Workflows and Their Pharmaceutical Applications
In the field of microbial community analysis, next-generation sequencing (NGS) technologies have become indispensable for researchers and drug development professionals. The two principal strategies employed are shotgun metagenomic sequencing (mNGS), an untargeted approach that sequences all genomic DNA in a sample, and targeted sequencing (tNGS), which focuses on specific marker genes or genomic regions of interest [30] [31] [32]. The choice between these methods significantly influences the insights obtained, impacting project cost, analytical depth, and experimental outcomes [30] [33]. These approaches are not mutually exclusive but can serve as complementary tools within a research strategy [30]. This application note provides a detailed comparison of these methodologies, supported by structured data and protocols, to guide researchers in selecting the optimal approach for their specific projects in microbial ecology, infectious disease, and therapeutic development.
Comparative Analysis: mNGS vs. tNGS
The decision between shotgun and targeted methods hinges on multiple factors, including research objectives, budgetary constraints, and available bioinformatics resources. The table below summarizes the core characteristics of each method.
Table 1: Core Methodological Comparison of Shotgun Metagenomics and Targeted Sequencing
| Factor | Shotgun Metagenomic Sequencing (mNGS) | Targeted Sequencing (tNGS) |
|---|---|---|
| Core Principle | Untargeted sequencing of all genomic DNA [31] [32] | Amplification and sequencing of specific, pre-defined genomic regions (e.g., 16S, ITS) [30] [31] |
| Taxonomic Coverage | All domains (Bacteria, Archaea, Viruses, Fungi, Eukaryotes) [31] [32] | Limited to the target; 16S for Bacteria/Archaea, ITS for Fungi [30] [31] |
| Typical Taxonomic Resolution | Species- to strain-level [30] [34] [32] | Genus-level, sometimes species-level [30] [32] |
| Functional Profiling | Yes, identifies microbial genes and metabolic pathways [30] [32] | No, but prediction is possible from 16S data [32] |
| Cost per Sample | Higher (Starting at ~$150, depends on depth) [32] | Lower (~$50 USD for 16S) [32] |
| Bioinformatics Complexity | Intermediate to Advanced [32] | Beginner to Intermediate [32] |
| Sensitivity to Host DNA | High (can be problematic in host-rich samples) [32] | Low (due to specific amplification) [32] |
| Best Suited For | Pathogen discovery, functional potential, strain-level analysis [30] [35] | Large-scale screening, community profiling, cost-sensitive studies [30] [33] |
Performance and Application Insights
Recent studies highlight how the choice of method impacts results in different sample types. In a 2025 analysis of 131 temperate grassland soils, both methods provided moderately similar outcomes for major phylum detection and community differentiation. However, shotgun sequencing provided deeper taxonomic resolution and access to more current databases, making it suitable for detailed microbial profiling, while amplicon sequencing remained a cost-effective, less computationally demanding option [33]. Conversely, a 2023 study on wastewater surveillance found that untargeted shotgun sequencing was unsuitable for genomic monitoring of low-abundance human pathogenic viruses, as viral reads were dominated by bacteriophages and made up less than 0.6% of total sequences. In this context, targeted methods like tiled-PCR or hybrid-capture enrichment were necessary for robust genomic epidemiology [36].
Experimental Protocols
Protocol 1: Shotgun Metagenomic Sequencing for Microbiome Analysis
This protocol is designed for comprehensive profiling of all microbial DNA from complex samples like stool or soil [31] [32].
1. DNA Extraction: Extract high-quality, high-molecular-weight DNA using a kit designed for complex samples (e.g., DNeasy PowerSoil Pro Kit for soil) [33]. Quantity DNA using a fluorometer (e.g., Qubit) and assess quality via spectrophotometer (e.g., Nanodrop) and gel electrophoresis [33].
2. Library Preparation:
- Fragmentation: Mechanically shear DNA into smaller fragments (e.g., 200-500 bp) via sonication or enzymatic tagmentation [31] [32].
- Adapter Ligation: Clean up fragmented DNA and ligate sequencing adapters containing unique index sequences for sample multiplexing [32] [35].
- PCR Amplification (Optional): Amplify the adapter-ligated DNA with a limited number of PCR cycles to enrich for successfully ligated fragments [32].
3. Sequencing: Pool libraries in equimolar ratios and sequence on an Illumina NovaSeq or PacBio Sequel system to a depth of 20-50 million reads per sample, depending on complexity [33] [37]. Higher depth is required for strain-level resolution or low-abundance organisms.
4. Bioinformatic Analysis:
- Quality Control & Host Filtering: Use FastQC and Trimmomatic to remove low-quality reads and sequences from the host genome (e.g., human, porcine) [38] [37].
- Assembly & Binning: Assemble quality-filtered reads into contigs using MEGAHIT or metaSPAdes. Recover metagenome-assembled genomes (MAGs) using binning tools like MetaBAT2 [33].
- Taxonomic & Functional Assignment: Classify reads and MAGs against reference databases (e.g., GTDB, NCBI) using Kraken2 or MetaPhlAn. Predict functional genes with HUMAnN2 or by aligning to databases like CARD for antimicrobial resistance genes [38] [33].
Protocol 2: Targeted 16S rRNA Gene Sequencing
This protocol details amplicon sequencing of the bacterial 16S rRNA gene for efficient community profiling [32] [33].
1. DNA Extraction: Follow the same procedure as in Protocol 1 to obtain high-quality DNA.
2. Library Preparation:
- Primary PCR: Amplify one or more hypervariable regions of the 16S rRNA gene (e.g., V4 region with 515F/926R primers) in a PCR reaction containing 2x KAPA HiFi HotStart ReadyMix, primers, and template DNA [33].
- Secondary PCR (Indexing PCR): Perform a second, limited-cycle PCR using the primary PCR product as a template to add flow cell adapters and unique dual indices (e.g., with the Nextera XT Index Kit) [33].
- Clean-up and Pooling: Purify the amplified DNA using magnetic beads. Quantify the final libraries, normalize to equimolar concentrations, and pool them for sequencing [33].
3. Sequencing: Sequence the pooled library on an Illumina MiSeq or iSeq platform with a 2x250 or 2x300 cycle kit to achieve sufficient overlap of the amplicon [33].
4. Bioinformatic Analysis:
- ASV/OTU Picking: Process raw sequences using DADA2 or QIIME2 to denoise reads, merge paired-end sequences, remove chimeras, and generate amplicon sequence variants (ASVs) or operational taxonomic units (OTUs) [33].
- Taxonomic Classification: Assign taxonomy to ASVs/OTUs by comparing them to a curated 16S rRNA database (e.g., SILVA, Greengenes2) using a naive Bayes classifier within QIIME2 [33].
- Functional Prediction (Optional): Use tools like PICRUSt2 to predict the functional potential of the microbial community based on the 16S rRNA gene data [32].
Workflow and Decision-Making Visualizations
Method Selection Workflow
The following diagram outlines a logical pathway for choosing between mNGS and tNGS based on key research questions.
Wet-Lab Workflow Comparison
This diagram illustrates the key procedural differences between the mNGS and tNGS laboratory workflows.
The Scientist's Toolkit: Essential Research Reagents and Materials
Successful execution of mNGS or tNGS projects relies on a suite of trusted reagents, kits, and bioinformatics tools. The following table details key solutions used in the protocols and literature cited herein.
Table 2: Key Research Reagent Solutions for Metagenomic Sequencing
| Item Name | Function/Application | Specific Example(s) |
|---|---|---|
| DNA Extraction Kit | Isolation of high-quality, inhibitor-free genomic DNA from complex samples. | DNeasy PowerSoil Pro Kit (Qiagen) [33], QIAamp Viral RNA Mini Kit (Qiagen) [37] |
| PCR Enzymes & Master Mix | Robust and high-fidelity amplification for library preparation or targeted amplicon generation. | KAPA HiFi HotStart ReadyMix (Kapa Biosystems) [33] |
| Library Prep & Indexing Kit | Preparation of sequencing libraries from fragmented DNA, including adapter ligation and indexing. | Nextera XT DNA Library Prep Kit (Illumina) [33] |
| Targeted Enrichment Panel | Hybrid-capture based enrichment of specific viral or microbial targets from complex metagenomic libraries. | ViroCap [37], Respiratory Virus Oligos Panel (RVOP) [36] |
| Sequencing Platform | High-throughput generation of short- or long-read sequence data. | Illumina MiSeq/NovaSeq [33], PacBio Sequel (for full-length 16S) [34] |
| Bioinformatics Tools | Software and pipelines for data quality control, assembly, taxonomic classification, and functional analysis. | QIIME2, DADA2 (for 16S) [33], Kraken2, MetaPhlAn, HUMAnN2 (for shotgun) [38] [32] [33] |
| Reference Databases | Curated collections of genomic or gene sequences for taxonomic and functional assignment. | SILVA, Greengenes2 (for 16S) [33], GTDB, CARD (for AMR genes) [38] [33] |
| Geraniol | Geraniol | High-Purity Terpene for Research | |
| GI254023X | GI254023X, CAS:260264-93-5, MF:C21H33N3O4, MW:391.5 g/mol | Chemical Reagent |
The choice between shotgun metagenomics and targeted sequencing is fundamental to the design of any microbial community study. Shotgun metagenomics offers a comprehensive, untargeted view of the entire microbiome, providing species- to strain-level resolution and critical insights into functional potential, making it ideal for pathogen discovery, functional genomics, and detailed mechanistic studies [30] [32] [35]. Its primary constraints are higher cost and bioinformatics complexity [32] [33]. In contrast, targeted sequencing provides a cost-effective, highly sensitive, and accessible method for focused taxonomic profiling and large-scale screening studies, particularly when monitoring specific bacterial and archaeal groups via the 16S rRNA gene [30] [32] [33].
As sequencing technologies continue to advance and costs decrease, shotgun metagenomics is becoming more widely adopted. However, targeted methods remain a powerful and efficient tool for many research questions [33]. Ultimately, the selection should be guided by a clear alignment between the methodological strengths of each approach and the specific goals of the research project. Furthermore, as demonstrated in recent studies, these methods can be powerfully combined, using tNGS for initial screening and mNGS for deeper investigation, thereby maximizing both resource efficiency and scientific insight [30] [36].
The discovery of novel bioactive compounds is crucial for addressing emerging challenges in drug development, agriculture, and industrial biotechnology. Functional and sequence-based metagenomic approaches have revolutionized this field by enabling researchers to access the vast metabolic potential of unculturable microorganisms from diverse environments [39] [40]. These complementary strategies allow scientists to bypass traditional cultivation limitations and directly mine genetic and functional elements from complex microbial communities.
Functional metagenomics relies on the expression of cloned environmental DNA in heterologous hosts to detect desired activities, while sequence-based approaches leverage bioinformatics analyses of metagenomic sequencing data to identify genes encoding novel biocatalysts and biosynthetic pathways [39]. The integration of these methods within a metagenomic framework provides a powerful toolkit for identifying novel bioactive compounds with potential therapeutic and industrial applications, ultimately contributing to a deeper understanding of microbial community functions in various ecosystems.
Key Approaches and Workflows
Sequence-Based Metagenomic Discovery
Sequence-based metagenomics involves direct genetic analysis of environmental samples through DNA sequencing and bioinformatics screening. This approach identifies putative bioactive compound genes based on sequence similarity to known biosynthetic pathways and genetic elements.
Experimental Workflow:
- Sample Collection: Diverse environments serve as microbial sources. Thermophilic compost samples have revealed abundant glycoside hydrolases (GH families GH3, GH5, and GH9) [39] [40]. Alpine permafrost cores on the Tibetan Plateau show distinct stratigraphic variations in microbial community structure and functional potential [41].
- DNA Extraction: Direct isolation of metagenomic DNA from environmental samples, often requiring specialized protocols to overcome inhibitors like humic acids [39].
- Sequencing & Assembly: Shotgun sequencing followed by assembly into metagenome-assembled genomes (MAGs) [39].
- Bioinformatic Analysis: Annotations against specialized databases (e.g., CAZy for carbohydrate-active enzymes) identify genes encoding putative bioactive compounds [39] [42].
- Heterologous Expression: Candidate genes cloned and expressed in suitable hosts (e.g., E. coli) for functional validation [39].
Functional Metagenomic Discovery
Functional metagenomics focuses on phenotypic detection of desired activities from environmental DNA libraries cloned into cultivable host systems, enabling discovery without prior sequence knowledge.
Experimental Workflow:
- Metagenomic Library Construction: Large-insert DNA libraries (e.g., fosmid, cosmid, BAC) constructed from environmental DNA [39].
- Host Transformation: Libraries introduced into heterologous expression hosts (typically E. coli).
- Activity Screening: High-throughput functional assays detect desired activities (e.g., enzyme activity, antimicrobial effects, antitumor properties) [39] [42].
- Hit Identification: Active clones isolated and sequenced to identify genes responsible for observed activities.
- Compound Characterization: Bioassay-guided fractionation and structural elucidation of bioactive compounds [43].
The following diagram illustrates the integrated workflow combining both sequence-based and functional metagenomic approaches for bioactive compound discovery:
Applications and Case Studies
Comparative Analysis of Discovery Approaches
The table below summarizes key characteristics and applications of sequence-based and functional metagenomic approaches for bioactive compound discovery:
| Aspect | Sequence-Based Discovery | Functional Discovery |
|---|---|---|
| Basis of Discovery | Genetic sequence similarity & homology [39] | Phenotypic expression & activity [39] |
| Key Applications | CAZyme identification (e.g., GH3, GH5, GH9) [39] [40], Biosynthetic Gene Cluster (BGC) mining [42] | Novel enzyme activities, Antibiotic resistance genes, Metabolic pathways [39] |
| Throughput | High (computational screening) | Medium to high (depends on assay format) |
| Prior Knowledge Required | Yes (reference databases) | No (activity-driven) |
| Advantages | Identifies cryptic/silent gene clusters, Comprehensive community profiling [39] [41] | Detects completely novel functions, No sequence bias [39] |
| Limitations | May miss novel sequences with low homology, Dependent on database quality | Expression barriers in heterologous hosts, Low abundance activities may be missed |
| Example Outcomes | Thermophilic compost GH families [39], Streptomyces BGCs [42] | Fosmid clones with β-glucosidase activity [39], Antimicrobial activities from marine bacteria [42] |
Success Stories in Bioactive Compound Discovery
Integrated approaches have successfully identified diverse bioactive compounds with significant potential:
Compost-Derived Carbohydrate-Active Enzymes: Portuguese thermophilic compost samples analyzed via both sequence and function-based metagenomics revealed abundant glycoside hydrolases (GH families GH3, GH5, and GH9). Functional screening of fosmid libraries demonstrated high β-glucosidase activity, identifying enzymes capable of efficient lignocellulosic biomass conversion under industrial conditions [39] [40].
Marine-Derived Bioactives: The marine bacterium Streptomyces albidoflavus VIP-1, isolated from the Red Sea tunicate Molgula citrina, exhibited significant antimicrobial and antitumor activities. Genomic analysis revealed numerous biosynthetic gene clusters (BGCs) encoding polyketide synthases (PKS), non-ribosomal peptide synthetases (NRPS), and terpenes—highlighting the strain's potential for producing novel therapeutic compounds [42].
Microbial Community Dynamics in Fermentation: Metagenomic analysis of rice-flavor Baijiu fermentation identified Lichtheimia, Kluyveromyces, Lacticaseibacillus, Lactobacillus, Limosilactobacillus, and Schleiferilactobacillus as core functional microbiota responsible for flavor production. Glycoside hydrolases (GHs) and glycosyl transferases (GTs) were identified as key carbohydrate-active enzymes driving the process [44].
Essential Research Reagents and Tools
Research Reagent Solutions
The table below outlines essential reagents, tools, and their applications in functional and sequence-based metagenomic discovery:
| Category | Specific Items | Function/Application | Examples from Literature |
|---|---|---|---|
| Sampling & DNA Extraction | Soil/compost sampling kits, Humic acid removal reagents, Metagenomic DNA extraction kits | Obtain high-quality environmental DNA free from inhibitors | Compost samples from Portuguese companies [39], Alpine permafrost cores [41] |
| Library Construction | CopyControl fosmid library kit, End-repair enzymes, Ligation reagents, Packaging extracts | Construct large-insert metagenomic libraries for functional screening | Fosmid libraries from compost DNA [39] |
| Sequencing & Analysis | Shotgun sequencing services, CAZy database, AntiSMASH, MEGAN, QIIME2 | Sequence metagenomic DNA and analyze for BGCs and CAZymes | CAZyme annotation in compost microbiomes [39], BGC analysis in Streptomyces [42] |
| Screening Assays | Esculin, Cellulase from T. reesei, Antibiotic discs, MTT assay reagents | Detect enzyme activities and bioactivities (antimicrobial, antitumor) | β-glucosidase activity screening [39], Antimicrobial and antitumor screening [42] |
| Cultivation Platforms | Applikon Biotechnology micro-bioreactor system, R2A agar/broth, NSW supplements | Cultivate difficult microbes and activate silent BGCs through varied conditions | MATRIX platform for microbial cultivation [45], Streptomyces isolation on R2A [42] |
Functional and sequence-based metagenomic approaches provide complementary pathways for unlocking the chemical diversity encoded in environmental microbiomes. While sequence-based methods enable comprehensive profiling of genetic potential through bioinformatics, functional approaches directly probe the phenotypic expression of metagenomic DNA. The integration of both strategies—supported by advanced bioinformatics, high-throughput screening, and innovative cultivation platforms—offers a powerful framework for discovering novel bioactive compounds with applications across medicine, industry, and biotechnology.
As metagenomic technologies continue to evolve, leveraging these integrated approaches will be essential for tapping into the vast untapped reservoir of microbial metabolic diversity, particularly from extreme and underexplored environments. This will not only accelerate drug discovery but also enhance our understanding of microbial community functions and interactions in diverse ecosystems.
The escalating crisis of antimicrobial resistance has necessitated a paradigm shift in antibiotic discovery, moving from traditional screening of cultivable soil microbes to advanced metagenomic analysis of unculturable species [18]. This transition is crucial because standard laboratory techniques can only culture approximately 1% of environmental bacteria, leaving the vast majority of soil microbial diversity—often termed "microbial dark matter"—unexplored for their pharmaceutical potential [46] [18]. The discovery of teixobactin in 2015 from a previously uncultured soil bacterium, Eleftheria terrae, validated innovative cultivation-based and molecular approaches for accessing this untapped resource [47] [18]. This application note details the experimental frameworks and methodologies that enable researchers to systematically investigate soil microbiomes for novel antibiotic compounds, positioning metagenomics as a cornerstone technology for modern microbial community analysis in drug discovery research.
The Teixobactin Breakthrough: A Case Study in Novel Antibiotic Discovery
Teixobactin represents the first member of a novel class of antibiotics discovered using the iChip (Isolation Chip) technology, which enables the cultivation and screening of previously unculturable soil bacteria [47] [18]. This depsipeptide antibiotic exhibits potent activity against Gram-positive pathogens—including methicillin-resistant Staphylococcus aureus (MRSA), vancomycin-resistant enterococci (VRE), and Mycobacterium tuberculosis—while demonstrating no detectable resistance development in vitro, even after 27 consecutive passages of S. aureus in its presence [47] [48].
Unique Mechanism of Action
Teixobactin employs a distinctive two-pronged attack on the bacterial cell envelope that elegantly circumvents conventional resistance mechanisms:
- Dual Target Binding: Teixobactin specifically binds to two essential precursors of cell wall biosynthesis: lipid II (peptidoglycan precursor) and lipid III (teichoic acid precursor) [49] [48]. These targets are not proteins but rather conserved lipid-bound molecules, making them less susceptible to mutation-based resistance [48].
- Supramolecular Assembly: Upon target binding, teixobactin molecules self-assemble into antiparallel β-sheet structures that further organize into stable fibrils and eventually compact fibrillar sheets on the membrane surface [49]. This supramolecular complex sequesters lipid II, making it unavailable for peptidoglycan biosynthesis [49].
- Membrane Disruption: The teixobactin-lipid II fibrillar structures integrate into the membrane, causing significant membrane thinning of approximately 0.5 nm and compromising membrane integrity [49]. This dual mechanism—inhibiting cell wall synthesis while simultaneously disrupting membrane function—explains teixobactin's exceptional efficacy and low resistance profile [49].
Table 1: Key Properties of Teixobactin
| Property | Description | Significance |
|---|---|---|
| Source Organism | Eleftheria terrae (uncultured soil bacterium) | First antibiotic discovered using iChip technology [47] |
| Chemical Class | Depsipeptide with unusual amino acids | Contains L-allo-enduracididine with cyclic guanidine moiety [50] |
| Spectrum | Gram-positive bacteria and mycobacteria | Effective against MRSA, VRE, and M. tuberculosis [47] |
| Resistance | No detectable resistance | Targets conserved lipid-bound precursors [48] |
| Therapeutic Efficacy | Effective in mouse infection models | Reduces bacterial load in MRSA and S. pneumoniae infections [47] |
Metagenomic Workflows for Antibiotic Discovery
Metagenomic approaches enable comprehensive analysis of soil microbial communities without the limitation of cultivability, facilitating the identification of novel antibiotic-producing taxa and their biosynthetic gene clusters (BGCs). Two complementary workflows—function-based screening and sequence-based analysis—provide powerful tools for antibiotic discovery.
Function-Based Screening Using Advanced Cultivation Techniques
The iChip technology revolutionized function-based screening by enabling high-throughput cultivation of unculturable soil bacteria through diffusion-based environmental simulation [18].
Diagram 1: iChip screening workflow for unculturable bacteria.
Protocol 1: iChip Cultivation and Screening of Unculturable Soil Bacteria
Materials Required:
- iChip device (semi-permeable membrane sandwiched between metal washers)
- Fresh soil samples from diverse environments
- Dilution buffers (phosphate-buffered saline)
- Low-nutrient agar media
- Antibiotic susceptibility testing materials
Procedure:
- Sample Preparation: Collect soil samples from various depths and ecosystems. Suspend 1 g of soil in 10 mL of sterile dilution buffer and homogenize gently [18].
- Cell Dilution: Perform serial dilutions to obtain a bacterial concentration of approximately 1 cell per microliter [18].
- iChip Assembly: Mix the diluted cell suspension with low-nutrient agar and apply to the semi-permeable membrane of the iChip device. Assemble the device according to manufacturer specifications [18].
- In Situ Incubation: Place the assembled iChip in the original soil sampling site or a simulated natural environment in the laboratory. Incubate for 2-4 weeks to allow microcolony formation [18].
- Colony Recovery: Disassemble the iChip and transfer developed microcolonies to traditional culture media. Notably, once established via iChip, up to 40% of previously unculturable bacteria will grow on standard laboratory media [18].
- Antibiotic Screening: Screen bacterial isolates for antibiotic production using standard zone-of-inhibition assays against target pathogens (e.g., MRSA, VRE) [18].
Sequence-Based Analysis Through Metagenomic Sequencing
Sequence-based metagenomic approaches enable direct analysis of soil microbial communities and their biosynthetic potential without cultivation biases.
Protocol 2: Metagenomic Analysis of Soil Microbiomes for Biosynthetic Gene Cluster Discovery
Materials Required:
- DNA extraction kits optimized for soil samples
- High-throughput sequencing platforms
- Bioinformatics computational resources
- Reference databases (e.g., MIBiG, antiSMASH)
Procedure:
- DNA Extraction: Extract high-molecular-weight DNA from 0.5-1.0 g soil samples using commercial soil DNA extraction kits with bead-beating for comprehensive cell lysis [46].
- Metagenomic Sequencing: Prepare sequencing libraries using Illumina or Nanopore technologies. Sequence to a minimum depth of 10-20 Gb per sample to adequately capture microbial diversity [46].
- Metagenome-Assembled Genome (MAG) Construction: Process raw sequences through quality filtering, assembly (using MEGAHIT or metaSPAdes), and binning (using MaxBin or MetaBAT) to reconstruct MAGs [46].
- Taxonomic Classification: Classify MAGs using the Genome Taxonomy Database (GTDB) to identify novel phylogenetic lineages [46].
- Biosynthetic Gene Cluster (BGC) Prediction: Identify BGCs in MAGs using antiSMASH, PRISM, or similar tools. Compare identified BGCs against known clusters in the MIBiG database [46].
- Metabolic Pathway Reconstruction: Use KEGG and MetaCyc to reconstruct metabolic pathways, focusing on secondary metabolite biosynthesis and stress response mechanisms [44].
Table 2: Soil Metagenomic Sequencing and Assembly Metrics
| Parameter | Recommended Specification | Typical Output from SMAG Catalogue |
|---|---|---|
| Sequencing Depth | 10-20 Gb per sample | 3304 soil metagenomes analyzed [46] |
| Assembly Approach | Single-sample assembly | 40,039 MAGs reconstructed [46] |
| MAG Quality | ≥50% completeness, ≤10% contamination | 9.1% high-quality (≥90% complete, ≤5% contaminated) [46] |
| Novelty Rate | Comparison to reference databases | 78.4% unknown species-level genome bins [46] |
| BGC Detection | antiSMASH with custom databases | 43,169 BGCs identified from soil MAGs [46] |
Analytical Techniques for Mode of Action Characterization
Once antibiotic activity is confirmed, elucidating the precise mechanism of action is essential for understanding efficacy and resistance potential.
Structural Characterization of Antibiotic-Target Complexes
Protocol 3: Solid-State NMR (ssNMR) for Atomic-Level Mechanism Studies
Materials Required:
- Uniformly 13C,15N-labelled antibiotic (produced via native host cultivation or synthesis)
- Target molecules (e.g., lipid II, lipid III)
- Lipid membranes (e.g., liposomes)
- High-field NMR spectrometer with magic-angle spinning capability
Procedure:
- Sample Preparation: Incorporate 13C,15N-labelled teixobactin and lipid II into liposomes at physiological ratios (typically 1:1 to 1:5 antibiotic:target) [49].
- NMR Data Collection: Acquire 2D 13C-13C correlation spectra with proton-driven spin diffusion to characterize the structure of the antibiotic-target complex [49].
- Interface Mapping: Perform 2D 1H-31P correlation experiments to identify specific atomic contacts between teixobactin and the pyrophosphate moiety of lipid II [49].
- Oligomerization Assessment: Analyze 13C-13C spectra with long mixing times to detect intermolecular contacts indicative of β-sheet formation and oligomerization [49].
Visualization of Membrane Interactions
Protocol 4: High-Speed Atomic Force Microscopy (HS-AFM) for Real-Time Membrane Interaction Studies
Materials Required:
- Supported lipid bilayers containing lipid II
- HS-AFM instrument with small-amplitude mode capability
- Antibiotic solutions at therapeutic concentrations
Procedure:
- Membrane Preparation: Form supported lipid bilayers on mica substrates containing 1-5 mol% lipid II to mimic bacterial membrane composition [49].
- Real-Time Imaging: Image the membrane surface in buffer solution before antibiotic addition to establish baseline topography [49].
- Complex Formation Monitoring: Inject teixobactin solution (0.1-1 μM final concentration) while continuously scanning the membrane surface to visualize initial binding events [49].
- Kinetic Analysis: Capture time-lapse images (0.5-2 frames per second) to track the formation and growth of fibrillar structures over time [49].
- Membrane Deformation Quantification: Measure height profiles across the membrane surface to quantify antibiotic-induced membrane thinning [49].
Diagram 2: Teixobactin's mechanism of action.
The Scientist's Toolkit: Essential Research Reagent Solutions
Table 3: Key Research Reagents for Soil Metagenomics and Antibiotic Discovery
| Reagent/Technology | Function | Application Notes |
|---|---|---|
| iChip Device | Cultivation of unculturable bacteria | Enables growth of ~40% of previously unculturable soil bacteria through diffusion-based environmental simulation [18] |
| Soil DNA Extraction Kits | Metagenomic DNA isolation | Must include bead-beating step for comprehensive lysis of diverse soil microbiota [46] |
| antiSMASH Database | BGC prediction and analysis | Primary tool for identifying novel biosynthetic pathways in MAGs [46] |
| GTDB Toolkit | Taxonomic classification | Gold standard for assigning taxonomy to novel MAGs [46] |
| Uniformly 13C,15N-Labelled Compounds | ssNMR studies | Essential for atomic-level resolution of antibiotic-target interactions [49] |
| Lipid II Analogues | Mode of action studies | Key target molecule for teixobactin and related antibiotics; available commercially or through purification [49] |
| Epicatechin | (-)-Epicatechin | High-purity (-)-Epicatechin for research. Explore its applications in neuroscience, cardiovascular, and metabolic studies. For Research Use Only. Not for human consumption. |
| Epigallocatechin | (-)-Epigallocatechin|High-Purity EGCG for Research | High-purity (-)-Epigallocatechin (EGCG) for lab research. Explore its antioxidant and anti-inflammatory mechanisms. For Research Use Only. Not for human consumption. |
The integration of advanced cultivation techniques like iChip technology with comprehensive metagenomic analysis has revitalized the antibiotic discovery pipeline by providing access to soil microbial dark matter. The teixobactin case study demonstrates that uncultured soil bacteria represent a rich reservoir of novel antibiotic classes with unique mechanisms of action that can circumvent conventional resistance pathways. The protocols outlined in this application note provide researchers with a structured framework for isolating unculturable microorganisms, identifying their biosynthetic potential through metagenomic analysis, and characterizing novel antibiotic compounds at atomic resolution. As metagenomic technologies continue to advance, with soil MAG catalogues expanding to encompass global microbial diversity, the drug discovery pipeline from soil microbes to novel antibiotics promises to deliver much-needed therapeutic solutions to address the escalating antimicrobial resistance crisis.
The pursuit of universal vaccines against highly variable pathogens represents a paradigm shift in immunoprophylaxis, moving from strain-specific protection to broad-spectrum efficacy. Metagenomics, the culture-independent genomic analysis of microbial communities, has emerged as a powerful tool for identifying conserved antigenic targets across entire pathogen species or genera. This approach involves direct extraction and sequencing of genetic material from diverse environmental or clinical samples, enabling comprehensive profiling of microbial populations and their functional capabilities [44] [51]. By analyzing the entire genetic repertoire of pathogens circulating in human, animal, and environmental reservoirs, researchers can identify evolutionarily conserved epitopes that are less susceptible to antigenic drift and shift—the primary mechanisms of vaccine escape.
The theoretical foundation rests on identifying core genomic elements that are indispensable for pathogen survival and thus remain conserved across different strains and variants. For respiratory pathogens like influenza and Haemophilus influenzae, metagenomic analyses have revealed surprisingly limited genetic variation despite high recombination rates, suggesting strong negative selection pressure on essential genes [52]. These conserved regions encode proteins critical for fundamental biological processes such as viral entry, cellular egress, or essential metabolic functions, making them ideal candidates for universal vaccine targets that could provide protection against diverse strains, including those with pandemic potential.
Key Applications and Case Studies
Universal Influenza Vaccine Targets
Influenza virus presents a formidable challenge due to its rapid antigenic variation and segmented genome capable of reassortment. Current hemagglutinin (HA)-targeted vaccines require annual reformulation and provide limited cross-protection. Metagenomic analysis of influenza neuraminidase (NA), however, has revealed a highly conserved active site architecture across influenza A and B viruses [53]. This conservation has been leveraged to develop broad-spectrum antiviral strategies, including the drug-Fc conjugate CD388, which demonstrates potent activity against diverse influenza strains including H1N1, H3N2, and influenza B [53]. The universal conservation of the NA active site, with median IC50 values of 1.29-2.37 nM across subtypes, underscores its viability as a universal vaccine target.
Haemophilus influenzae Vaccine Development
A comprehensive genomic study analyzing nearly 10,000 H. influenzae samples collected between 1962-2023 revealed limited genetic variation despite extensive recombination, indicating pervasive negative selection that maintains conserved genomic regions [52]. This finding is particularly significant for non-typeable H. influenzae (NTHi), which causes approximately 175 million childhood ear infections annually worldwide and is a frequent cause of pneumonia. The conserved genomic elements identified through large-scale sequencing provide promising targets for a universal vaccine that would protect against all H. influenzae strains, not just the type b variant covered by current vaccines [52].
Microbiome-Informed Vaccine Adjuvants
Beyond direct antigen targeting, metagenomics facilitates the identification of commensal bacteria and their immunomodulatory products that can enhance vaccine efficacy. Studies have revealed that specific gut microbes significantly influence immune responses to vaccination [54]. For instance, segmented filamentous bacteria enhance influenza vaccine responses through RANTES/exotoxin-dependent chemokine cascades, while Bacteroides fragilis polysaccharide A corrects Th1/Th2 imbalances via TLR2 signaling [54]. These microbiome-immune interactions present novel opportunities for developing microbiome-based adjuvants that can be co-administered with vaccines to enhance immunogenicity and breadth of protection.
Table 1: Metagenomic Applications in Vaccine Target Discovery
| Pathogen | Conserved Target Identified | Metagenomic Insight | Potential Impact |
|---|---|---|---|
| Influenza Virus | Neuraminidase active site | High conservation across influenza A/B strains; low IC50 (1.29-2.37 nM) against diverse subtypes [53] | Universal influenza prevention; covers H1N1, H3N2, H5N1, H7N9, and influenza B |
| Haemophilus influenzae | Multiple conserved genomic regions | Limited genetic variation despite high recombination rates; negative selection on core genome [52] | Single vaccine against all strains (including NTHi); prevents 200M+ childhood infections annually |
| Highly Pathogenic Avian Influenza (HPAI) | Conserved HA stalk domain | Cross-clade efficacy drops below 60% when HA similarity <88%; mucosal immunity crucial [54] | Broad poultry protection; reduced zoonotic transmission |
Experimental Protocols
Metagenomic Sequencing Workflow for Antigen Discovery
Sample Collection and Processing
- Collect representative samples from diverse ecological niches and host populations (e.g., nasal swabs, respiratory secretions, environmental samples) [44] [52].
- For respiratory pathogens, collect nasal swabs using standardized sampling protocols. In the H. influenzae study, researchers collected 4,474 nasal swabs from children in a displaced persons camp, providing comprehensive population-level data [52].
- Immediately freeze samples at -80°C to preserve nucleic acid integrity until processing [44].
DNA/RNA Extraction and Library Preparation
- Extract total nucleic acids using commercial kits with mechanical and enzymatic lysis to ensure broad microbial representation [51].
- For RNA viruses, perform reverse transcription to generate cDNA.
- Prepare sequencing libraries using Illumina-compatible protocols with dual indexing to enable multiplexing [44] [51].
- Quantify library concentration using fluorometric methods and qualify using bioanalyzer systems to ensure appropriate fragment size distribution.
Sequencing and Data Processing
- Perform whole-genome sequencing on Illumina platforms (e.g., NovaSeq) with 2×150 bp paired-end reads to achieve sufficient depth for variant calling [52].
- Process raw sequencing data through quality control pipelines including adapter trimming, quality filtering, and host sequence depletion.
- For the global H. influenzae analysis, researchers combined 4,474 newly sequenced genomes with 5,976 publicly available genomes to achieve comprehensive species representation [52].
Bioinformatic Analysis of Vaccine Targets
Assembly and Annotation
- Perform de novo assembly of quality-filtered reads using SPAdes or similar assemblers [51].
- Annotate contigs using Prokka for prokaryotes or custom pipelines for viruses.
- Classify sequences taxonomically using Kraken2 or similar tools with reference databases.
Identification of Conserved Regions
- Perform multiple sequence alignment of homologous genes across different strains using MAFFT or Clustal Omega [52].
- Calculate conservation scores for each amino acid position using Shannon entropy or similar metrics.
- Identify epitopes with high conservation scores and strong predicted immunogenicity using tools like NetMHC or BepiPred.
Functional Validation Workflow
- Clone identified conserved genes into expression vectors for recombinant protein production.
- Evaluate protein immunogenicity in animal models through immunization studies.
- Assess protective efficacy in challenge experiments with heterologous strains.
- For the influenza NA target, confirm functional conservation through enzyme inhibition assays demonstrating low IC50 values across diverse strains [53].
Table 2: Key Research Reagents for Metagenomic Vaccine Development
| Reagent/Category | Specific Examples | Function/Application | Supporting Evidence |
|---|---|---|---|
| Sequencing Kits | Illumina DNA Prep | Library preparation for metagenomic sequencing | Enabled sequencing of 4,474 H. influenzae genomes [52] |
| Nucleic Acid Extraction | Commercial kits with mechanical/enzymatic lysis | Total nucleic acid extraction from diverse samples | Used in soil metagenomics studying antibiotic resistance genes [51] |
| Bioinformatic Tools | Kraken2, SPAdes, MAFFT, BepiPred | Taxonomic classification, assembly, alignment, epitope prediction | Essential for identifying conserved regions in H. influenzae core genome [52] |
| Expression Systems | E. coli, mammalian cell lines | Recombinant antigen production for validation | Critical for producing NA proteins for influenza vaccine development [53] |
| Animal Models | Mice, ferrets, avian models | In vivo efficacy testing of vaccine candidates | Used to validate CD388 efficacy in lethal influenza challenge models [53] |
Data Analysis and Interpretation
Statistical Framework for Target Prioritization
Effective identification of universal vaccine targets requires a multi-parameter prioritization framework. Key metrics include: (1) Sequence Conservation - calculated as percentage identity across diverse strains; (2) Essentiality - determined through gene knockout studies or comparative genomics; (3) Immunogenicity - predicted through MHC binding affinity algorithms and confirmed through serological assays; and (4) Structural Accessibility - surface exposure of the target epitope assessed through structural modeling [53] [52].
For influenza NA, conservation exceeds 95% across influenza A and B strains in the active site region, with potent inhibition (IC50 1.29-2.37 nM) demonstrated across subtypes [53]. For H. influenzae, core genome analysis shows limited variation despite high recombination rates, with negative selection maintaining essential functions [52]. These quantitative metrics provide a robust framework for ranking potential targets before proceeding to costly experimental validation.
Microbiome-Based Adjuvant Discovery
Metagenomic analysis of vaccine responders versus non-responders has identified specific commensal bacteria associated with enhanced immunogenicity. Statistical correlation of microbial abundance with antibody titers reveals potential adjuvant organisms [54]. For instance, Lactobacillus species correlate with 4.1-fold increases in hemagglutination inhibition titers post-vaccination, while Faecalibacterium-derived butyrate enhances CD8+ cytotoxicity against H5N1 [54]. These findings enable development of microbiome-modulating interventions to enhance vaccine efficacy.
Technical Notes and Troubleshooting
Common Challenges in Metagenomic Vaccine Development
Sample Representation Bias Incomplete geographical or host population sampling can miss important genetic variants. Solution: Implement stratified sampling across diverse ecological niches and host species, as demonstrated in the global H. influenzae study that incorporated samples from multiple continents [52].
Host DNA Contamination Host genomic material can dominate sequencing libraries, reducing microbial sequence recovery. Solution: Implement host depletion methods using probes or enzymatic degradation, and increase sequencing depth to compensate for loss.
Insufficient Sequencing Depth Shallow sequencing may miss low-abundance strains or rare variants. Solution: For comprehensive variant detection, sequence to high depth (>50× coverage); the H. influenzae study achieved this through large-scale sequencing of nearly 10,000 genomes [52].
Functional Validation Bottlenecks High-throughput sequencing generates candidates faster than traditional validation methods can handle. Solution: Implement parallelized animal challenge models and high-throughput serological assays to accelerate validation.
Quality Control Metrics
Establish rigorous QC checkpoints throughout the pipeline: (1) Nucleic acid quality (RIN >8.0, DIN >7.0); (2) Library complexity; (3) Sequencing quality scores (Q30 >80%); (4) Assembly completeness; (5) Conservation score thresholds; (6) Experimental reproducibility [44] [51] [52]. These metrics ensure identification of genuinely conserved, immunogenic targets with potential for broad protection.
Metagenomics provides an powerful framework for identifying universal vaccine targets through comprehensive analysis of pathogen diversity and evolution. The approach has already yielded promising candidates for influenza and H. influenzae, demonstrating that conserved, essential epitopes can be identified despite high surface protein variability [53] [52]. Future developments will likely integrate artificial intelligence for epitope prediction, single-cell metagenomics for rare variant detection, and synthetic biology for rapid antigen production [54].
The convergence of metagenomics with systems immunology and microbiome science offers unprecedented opportunities for rational vaccine design against highly variable pathogens. As sequencing technologies continue to advance and computational methods become more sophisticated, metagenomics-driven vaccine discovery will play an increasingly central role in pandemic preparedness and the development of broadly protective vaccines against evolving global health threats.
The human microbiome represents a complex ecosystem of microorganisms whose dynamic interactions with the host significantly influence health and disease states. The emergence of metagenomics, defined as the study of the collection of all genomes of the microbiota, has revolutionized our ability to analyze these microbial communities without the limitations of traditional culturing techniques [55]. This paradigm shift is foundational to the development of microbiome-based therapeutics, including advanced probiotics, prebiotics, and personalized medicine approaches. By providing comprehensive insights into microbial diversity, function, and dynamics, metagenomic analysis enables researchers to identify specific microbial taxa, functional pathways, and metabolic activities that can be therapeutically targeted.
The field has witnessed remarkable technological advancements, particularly with the refinement of long-read sequencing platforms such as Oxford Nanopore Technologies (ONT) and Pacific Biosciences (PacBio) [56]. These platforms address critical limitations of short-read sequencing by generating reads spanning thousands of base pairs, which significantly improves metagenome assembly, enables detection of structural variations, and facilitates the reconstruction of complete microbial genomes from complex communities [56]. The enhanced ability to profile microbial communities with unprecedented resolution provides the essential framework for developing targeted therapeutic interventions aimed at restoring healthy microbial ecosystems.
Metagenomic Protocols for Community Analysis
Sample Collection and Preservation
Proper sample collection and handling are critical for obtaining reliable metagenomic data. The following protocol outlines standardized procedures for human gut microbiome studies, which can be adapted for other body sites:
- Sample Collection: Collect fresh stool samples in sterile, DNA-free containers. For interventional studies, collect baseline samples prior to intervention and follow-up samples at predetermined intervals. The STORMS (Strengthening The Organization and Reporting of Microbiome Studies) checklist recommends detailed documentation of collection timing, method, and immediate preservation techniques [57].
- Preservation: Immediately after collection, aliquot samples into cryovials and preserve using one of two methods: (1) flash-freezing in liquid nitrogen followed by storage at -80°C, or (2) addition of DNA/RNA stabilization buffers according to manufacturer protocols. Consistent preservation across all samples in a study is essential to prevent microbial community shifts.
- Metadata Documentation: Record comprehensive metadata for each sample, including patient demographics (age, sex, BMI), diet, medication use (especially recent antibiotics), health status, and sample characteristics (e.g., moisture content, which serves as a proxy for intestinal transit time) [58] [57]. This information is crucial for controlling confounding factors during statistical analysis.
DNA Extraction and Library Preparation
High-quality DNA extraction is fundamental for successful metagenomic sequencing:
- DNA Extraction: Use mechanical lysis (bead-beating) combined with chemical lysis to ensure efficient disruption of diverse bacterial cell walls. Employ commercial kits specifically validated for microbiome studies to maximize DNA yield and minimize bias. Include extraction controls (blank samples without biological material) to monitor potential contamination.
- Quality Control: Assess DNA quality and quantity using fluorometric methods (e.g., Qubit) and fragment analysis (e.g., Bioanalyzer). DNA integrity numbers (DIN) >7.0 are generally recommended for shotgun metagenomic sequencing.
- Library Preparation: For short-read sequencing (Illumina), use standardized library preparation kits with fragmentation, adapter ligation, and PCR amplification steps. For long-read sequencing (ONT, PacBio), follow manufacturer protocols for native DNA library preparation without fragmentation. ONT's MinION and PromethION platforms enable real-time sequencing, which is particularly valuable for rapid pathogen identification in clinical settings [56].
Metagenomic Sequencing and Profiling
The choice of sequencing approach depends on the research objectives and available resources:
- 16S rRNA Gene Sequencing: A cost-effective method for taxonomic profiling that amplifies and sequences the hypervariable regions of the bacterial 16S rRNA gene. While suitable for initial community characterization, it provides limited functional information and taxonomic resolution often only to the genus level.
- Shotgun Metagenomic Sequencing: Sequences all DNA fragments in a sample, enabling simultaneous taxonomic and functional profiling. This approach allows for strain-level discrimination, identification of metabolic pathways, and detection of antibiotic resistance genes [59]. Quantitative microbiome profiling (QMP) with spike-in standards is increasingly recommended over relative abundance profiling to avoid compositional data artifacts and enable true abundance comparisons [58].
Bioinformatics Analysis Pipeline
Computational analysis transforms raw sequencing data into biologically meaningful insights:
- Quality Control and Preprocessing: Use FastQC to assess read quality and Trimmomatic or Cutadapt to remove low-quality bases and adapter sequences. For host-associated microbiomes, align reads to the host genome (e.g., human GRCh38) and remove matching sequences to eliminate host contamination.
- Taxonomic and Functional Profiling: Employ specialized tools for comprehensive analysis. Meteor2 is a recently developed tool that leverages environment-specific microbial gene catalogs to deliver integrated taxonomic, functional, and strain-level profiling (TFSP) [59]. It supports 10 different ecosystems and demonstrates improved species detection sensitivity (45% improvement for low-abundance species) and functional abundance estimation accuracy (35% improvement compared to HUMAnN3) [59].
- Strain-Level Analysis: Tools like StrainPhlAn or the strain-tracking functionality in Meteor2 enable monitoring of strain dissemination and single nucleotide variant (SNV) detection, which is crucial for understanding microbial evolution and persistence in response to therapeutic interventions [59].
- Statistical Analysis: Conduct α-diversity (within-sample diversity) and β-diversity (between-sample diversity) analyses. Control for confounding factors (e.g., age, BMI, medication) using PERMANOVA for β-diversity comparisons and linear regression models for taxon-specific associations [58] [55]. Multiple testing correction (e.g., Benjamini-Hochberg) is essential due to the high-dimensional nature of microbiome data.
Table 1: Key Bioinformatics Tools for Metagenomic Analysis
| Tool | Primary Function | Key Features | Reference |
|---|---|---|---|
| Meteor2 | Taxonomic, functional, and strain-level profiling | Uses environment-specific gene catalogs; 45% improved sensitivity for low-abundance species | [59] |
| metaFlye | Long-read metagenome assembly | Specialized for assembling complete genomes from Nanopore/PacBio data | [56] |
| BASALT | Binning software | Groups assembled sequences into putative genomes | [56] |
| QIIME 2 | 16S rRNA analysis pipeline | Comprehensive workflow from raw sequences to diversity analysis | [55] |
| MiRIx | Microbiome response quantification | Quantifies microbiota susceptibility to antibiotics and other interventions | [60] |
Quantitative Assessment of Therapeutic Interventions
Measuring Microbiome Responses to Interventions
Robust assessment of microbiome changes following therapeutic interventions requires quantitative approaches:
- Microbiome Response Index (MiRIx): This quantitative method measures and predicts microbiome responses to specific interventions, particularly antibiotics [60]. MiRIx values quantify the overall susceptibility of the microbiota to a therapeutic agent based on bacterial phenotype databases and intrinsic susceptibility data. The approach can be applied to data from both 16S rRNA gene sequencing and shotgun metagenomics, enabling standardized comparison of intervention effects across studies [60].
- Quantitative Microbiome Profiling (QMP): Unlike relative abundance profiling, QMP incorporates internal standards or flow cytometry-based cell counting to determine absolute microbial abundances [58]. This approach reveals changes that may be masked in relative data and reduces both false-positive and false-negative rates in association studies, thereby focusing clinical development on biologically relevant targets.
- Longitudinal Sampling: Collecting multiple samples over time from the same subject provides more statistical power than cross-sectional designs for detecting intervention effects and understanding microbiome dynamics and resilience.
Table 2: Core Metrics for Assessing Therapeutic Interventions
| Metric Category | Specific Metrics | Interpretation in Intervention Studies | |
|---|---|---|---|
| α-Diversity | Chao1, Shannon, Simpson indices | Increased diversity generally indicates healthier state; decreased diversity may indicate dysbiosis | |
| β-Diversity | Bray-Curtis, UniFrac distances | Quantifies overall community shift from baseline in response to intervention | |
| Taxonomic Abundance | Absolute abundance of specific taxa | Identifies which specific microorganisms increase or decrease with intervention | |
| Functional Potential | KEGG, CAZyme, ARG abundances | Determines if intervention alters microbial community functional capacity | |
| Microbiome Response Index | MiRIx score | Predicts and quantifies susceptibility to specific antibiotics/therapeutics | [60] |
Confounder Control in Clinical Studies
Appropriate control of confounding variables is essential for accurate interpretation of therapeutic effects:
- Key Confounders: Identified major covariates that explain significant microbiome variance include intestinal transit time (measured via stool moisture content), intestinal inflammation (fecal calprotectin), and BMI [58]. These factors can supersede variance explained by primary disease states and must be accounted for in statistical models.
- Study Design Considerations: The STORMS checklist provides comprehensive guidance for reporting microbiome studies, emphasizing the importance of documenting and controlling for confounders through appropriate inclusion/exclusion criteria, stratified randomization, and statistical adjustment [57].
- Control Group Selection: In cancer microbiome studies, control individuals meeting criteria for colonoscopy but without colonic lesions often show enriched dysbiotic microbial signatures compared to healthy community controls, highlighting the importance of careful control group selection [58].
Application Notes for Therapeutic Development
Probiotic Strain Selection and Validation
Metagenomics enables data-driven probiotic development:
- Strain Identification: Use metagenomic analyses of healthy versus diseased populations to identify commensal strains that are depleted in disease states. Long-read sequencing facilitates the assembly of circularized genomes for potential probiotic candidates, enabling complete metabolic characterization [56].
- Functional Validation: Combine genomic evidence with culture-based approaches to validate probiotic functions. For example, identify strains encoding bile salt hydrolases, short-chain fatty acid production pathways, or antimicrobial compound synthesis genes, then confirm these functions in vitro.
- Ecological Considerations: Assess the ecological competence of probiotic candidates by evaluating their prevalence and abundance in healthy populations and their ability to integrate into established microbial communities.
Prebiotic Substrate Targeting
Metagenomics guides prebiotic development by identifying microbial taxa and functions to be selectively stimulated:
- Carbohydrate-Active Enzyme (CAZyme) Profiling: Use tools like Meteor2 to profile CAZyme families in microbial communities to identify which taxa possess the enzymatic capacity to utilize specific prebiotic substrates [59].
- Microbial Interaction Mapping: Construct correlation networks between microbial abundances and metabolic outputs to identify keystone taxa whose stimulation would produce desired community-wide effects.
- Personalized Approaches: Based on individual baseline microbiome compositions, identify which subjects are most likely to respond to specific prebiotic formulations by determining the presence of necessary utilization pathways in their native microbiota.
Personalized Medicine Applications
Metagenomic profiling enables multiple personalized medicine approaches:
- Microbiome-Informed Dosing: Profile patient microbiomes to identify individuals with microbial communities that may metabolize drugs differently, enabling dose adjustments for drugs known to be affected by microbial metabolism.
- Therapeutic Selection: Use baseline microbiome signatures to predict which patients are most likely to respond to specific microbiome-based interventions, maximizing therapeutic efficacy.
- Fecal Microbiota Transplantation (FMT) Monitoring: Apply strain-level tracking tools like Meteor2 to monitor engraftment of donor strains in recipients and correlate specific strain transfers with clinical outcomes [59].
The Scientist's Toolkit: Research Reagent Solutions
Table 3: Essential Research Reagents and Materials for Metagenomic Studies
| Category | Specific Product/Kit | Function and Application Notes | |
|---|---|---|---|
| Sample Preservation | DNA/RNA Shield, RNAlater | Stabilizes microbial community composition immediately after collection | |
| DNA Extraction | QIAamp PowerFecal Pro, DNeasy PowerLyzer | Bead-beating kits validated for diverse microbial cell lysis; include inhibition removal | |
| Library Preparation | Illumina DNA Prep, Oxford Nanopore Ligation Kit | Prepare sequencing libraries with minimal bias and optimal adapter ligation | |
| Quality Control | Qubit dsDNA HS Assay, Agilent 4200 TapeStation | Accurately quantify DNA and assess fragment size distribution | |
| Positive Controls | ZymoBIOMICS Microbial Community Standard | Validated mock community for evaluating entire workflow performance | [56] |
| Internal Standards | Spike-in genomic DNA from unique species | Enables absolute quantification in quantitative microbiome profiling | [58] |
| Bioinformatics | Meteor2 database, Custom bioinformatic scripts | Environment-specific gene catalogs for integrated taxonomic/functional profiling | [59] |
Metagenomic technologies have transformed our approach to microbiome-based therapeutics by providing unprecedented resolution for analyzing microbial communities. The protocols and application notes outlined here provide a framework for conducting rigorous metagenomic research that can reliably inform therapeutic development. As the field advances, the integration of long-read sequencing, quantitative profiling, and careful confounder control will be essential for translating microbial ecology insights into effective clinical interventions. The ongoing development of computational tools like Meteor2 that integrate taxonomic, functional, and strain-level analysis will further accelerate the discovery and validation of microbiome-based therapeutics, ultimately enabling more personalized and effective approaches to modulating the human microbiome for improved health outcomes.
Navigating Computational Challenges: Best Practices in Metagenomic Data Analysis
In the field of metagenomics for microbial community analysis, high-throughput sequencing (HTS) technologies have revolutionized our ability to decode complex biological systems at an unprecedented scale [61]. These technologies generate terabytes of data comprising millions of short DNA sequences, presenting both extraordinary opportunities and significant computational challenges [62] [61]. The sheer volume of data requires robust bioinformatics pipelines to process, analyze, and interpret effectively, making computational analysis the current rate-limiting factor in research progress rather than the sequencing technology itself [63].
Managing millions of short DNA sequences involves overcoming hurdles related to data volume, quality control, and computational complexity [64] [61]. The influx of next-generation sequencing and high-throughput approaches has given rise to enormous genomic datasets, creating both opportunities and challenges for comprehensive analysis [62]. This application note addresses these challenges by providing structured protocols and solutions for handling metagenomic sequence data, with particular emphasis on microbial community profiling applications relevant to researchers, scientists, and drug development professionals.
The Metagenomic Sequencing Workflow: From Sample to Insight
Metagenomic sequencing enables comprehensive profiling of all genetic material in a sample without requiring isolation of individual organisms [65]. This technology provides insights that were once impossible to obtain, from environmental samples to clinical diagnostics. The standard workflow involves multiple sophisticated computational stages that transform raw sequencing data into biologically meaningful information about microbial communities.
Key Stages in Metagenomic Analysis
- Data Acquisition: Obtaining raw sequencing data from platforms such as Illumina, Oxford Nanopore, or PacBio, typically stored in FASTQ format containing sequence reads and quality scores [61]
- Preprocessing: Quality control to assess data integrity, trimming to remove low-quality bases, and filtering to eliminate contaminants or adapter sequences [61]
- Taxonomic Classification: Assigning sequences to taxonomic units to identify microbial community members [65]
- Functional Annotation: Predicting gene functions and metabolic pathways present in the microbial community [61]
- Statistical Analysis and Visualization: Identifying patterns, correlations, and significant findings, then presenting them in accessible formats [61]
The entire process depends heavily on standards and interoperability, with common data formats like FASTQ, BAM, and VCF facilitating data exchange across platforms [65].
Experimental Protocols for Metagenomic Data Analysis
Quality Control of Raw Reads
Purpose: To assess the quality of raw sequencing data and identify problematic samples before proceeding to more computationally intensive analysis steps.
Methodology:
- File Format Handling: Begin with FASTQ files, which contain nucleotide sequences and per-base calling quality for millions of reads [66]. These files are typically large (megabytes to gigabytes) and should be kept compressed to save disk space [66].
- Quality Assessment: Use FastQC to analyze key features of the reads and generate a diagnostic report highlighting potential data quality issues [66] [67]. FastQC can be run through a visual interface or programmatically for better scalability and reproducibility [66].
- Multi-Sample Comparison: Aggregate multiple FastQC reports using MultiQC to facilitate comparison across samples and identify outliers [66].
- Quality Interpretation: Evaluate FastQC metrics including:
Interpretation: There is no universal threshold for classifying samples as good or bad quality [66]. Expect samples processed through the same procedure to have similar quality statistics. Samples with lower-than-average quality should still be processed but noted for potential issues. If all samples systematically show "warning" or "fail" flags across multiple metrics, consider repeating the experiment [66].
Read Trimming and Cleaning
Purpose: To remove technical sequences and low-quality ends from reads, thereby improving downstream analysis quality.
Methodology:
- Tool Selection: Employ specialized trimming tools such as Trimmomatic or Cutadapt [66] [67]. These tools remove technical sequences (adapters) and trim reads based on quality while maximizing read length.
- Parameter Optimization: Configure trimming parameters based on:
- Adapter sequences: Provide sequences used in library preparation
- Quality thresholds: Set appropriate quality cutoffs (e.g., Phred score)
- Minimum length: Define the shortest acceptable read length after trimming (typically ≥36 nucleotides) [66]
- Quality Verification: Re-run FastQC on trimmed reads to verify improvement in quality metrics [66].
Interpretation: Monitor the percentage of reads that survive trimming, as a high discard rate may indicate poor quality data. Effective trimming should systematically improve quality metrics while preserving sufficient read length for accurate alignment [66].
Taxonomic Classification and Profiling
Purpose: To identify the microbial composition of the sample by assigning reads to taxonomic units.
Methodology:
- Reference Database Selection: Choose appropriate taxonomic reference databases (e.g., Greengenes, SILVA, GTDB) based on your study system and requirements.
- Classification Approach: Select from multiple methodological approaches:
- Marker-based methods: Use conserved marker genes for taxonomic assignment
- Alignment-based methods: Map reads to comprehensive reference genomes
- k-mer-based methods: Utilize exact substring matches for efficient classification
- Abundance Estimation: Calculate relative abundances of identified taxa using statistical methods that account for genome size and sequencing depth biases.
- Contamination Checking: Identify potential contaminants using specialized tools and negative control samples.
Interpretation: Consider limitations in reference databases, as uncharacterized organisms may not be identified. Use multiple approaches to validate findings and be cautious when interpreting low-abundance taxa that may represent contamination or index hopping.
Functional Annotation and Pathway Analysis
Purpose: To predict the functional potential of the microbial community based on identified genes.
Methodology:
- Gene Prediction: Identify open reading frames (ORFs) in metagenomic sequences using tools like Prodigal or MetaGeneMark.
- Function Assignment: Annotate predicted genes using databases such as:
- KEGG for pathway information
- COG for orthologous groups
- eggNOG for evolutionary genealogy of genes
- Pathway Reconstruction: Map annotated genes to metabolic pathways to understand community functional potential.
- Comparative Analysis: Identify differentially abundant functions between sample groups using statistical methods.
Interpretation: Functional annotation from metagenomic data reveals community capabilities rather than actual activity (which requires metatranscriptomics). Consider completeness of pathways and potential novel functions not captured in reference databases.
Quantitative Metrics for Data Quality Assessment
Table 1: Key Quality Control Metrics in Metagenomic Sequencing Analysis
| Metric Category | Specific Measurement | Optimal Range | Potential Issues |
|---|---|---|---|
| Sequence Quality | Per-base sequence quality (Phred score) | ≥30 for most positions [67] | Quality drop at read ends [66] |
| Adapter Content | Percentage of adapter sequence | <5% [67] | High adapter contamination affecting alignment |
| GC Content | Deviation from expected distribution | Similar across samples [67] | Contamination or biased libraries |
| Sequence Duplication | Percentage of duplicated reads | Variable (higher in RNA-seq) [67] | PCR bias or low complexity libraries |
| Unknown Bases | Percentage of N calls | <1% [67] | Sequencing chemistry failures |
Table 2: Computational Requirements for Metagenomic Data Analysis
| Analysis Stage | Memory Requirements | Processing Time | Key Tools |
|---|---|---|---|
| Quality Control | Moderate (8-16 GB) | Fast (minutes to hours) | FastQC, MultiQC [66] [61] |
| Read Trimming | Low to Moderate (4-8 GB) | Fast (minutes to hours) | Trimmomatic, Cutadapt [66] [61] |
| Taxonomic Profiling | High (32+ GB) | Moderate to Long (hours to days) | Kraken2, MetaPhlAn |
| Functional Annotation | High to Very High (64+ GB) | Long (days) | HUMAnN2, MG-RAST |
| Statistical Analysis | Moderate (16-32 GB) | Fast to Moderate (hours) | R, Python packages |
Visualization of Analysis Workflows
Figure 1: Overall workflow for metagenomic sequence analysis, showing the key stages from raw data to biological interpretation.
Figure 2: Detailed quality control sub-workflow for evaluating and improving raw read quality before downstream analysis.
The Scientist's Toolkit: Essential Research Reagents and Computational Solutions
Table 3: Essential Research Reagent Solutions for Metagenomic Sequencing
| Tool Category | Specific Tools | Primary Function | Application Context |
|---|---|---|---|
| Quality Control | FastQC, MultiQC | Quality assessment and reporting [66] [67] | Initial data evaluation across all sequencing types |
| Read Trimming | Trimmomatic, Cutadapt | Adapter removal and quality trimming [66] [61] | Pre-processing before alignment or assembly |
| Taxonomic Profiling | Kraken2, MetaPhlAn | Microbial community composition analysis | Biodiversity assessment in microbial communities |
| Functional Annotation | HUMAnN2, MG-RAST | Metabolic pathway reconstruction | Functional potential of microbial communities |
| Statistical Analysis | R, Python | Differential abundance testing | Identifying significant differences between sample groups |
| Workflow Management | Nextflow, Snakemake | Pipeline automation and reproducibility [61] | Scalable, reproducible analysis workflows |
| Visualization | IGV, UCSC Genome Browser [61] | Data exploration and presentation | Result interpretation and publication |
Managing millions of short DNA sequences in metagenomic research requires robust computational pipelines that address data overload and complexity at multiple levels. By implementing the protocols and solutions outlined in this application note, researchers can transform overwhelming raw sequence data into biologically meaningful insights about microbial communities.
Emerging technologies including AI and machine learning are poised to enhance data analysis and pattern recognition in metagenomics [61]. The integration of multi-omics approaches, combining genomics with transcriptomics and proteomics data, will provide more holistic insights into microbial community function [61]. Additionally, cloud-based pipelines are increasingly adopted for improved scalability and collaboration, addressing the computational challenges associated with large-scale metagenomic studies [61].
As these technologies evolve, the field will continue to grapple with challenges related to data privacy, standardization, and the need for skilled personnel. However, with systematic approaches to data management, quality control, and analysis, metagenomic sequencing is positioned to remain a fundamental tool for microbial community analysis across diverse research and clinical applications.
Within the framework of metagenomics for microbial community analysis research, the critical step of taxonomic classification is fundamentally constrained by the limitations of reference databases. The process of assigning taxonomic labels to DNA sequences from complex environmental samples is not merely a technical procedure; it is a interpretive act heavily influenced by the completeness and quality of the databases used. Reference databases serve as the foundational dictionaries for translating genetic code into biological identity, yet their current state introduces significant biases that can skew biological interpretations and hinder discovery. This application note examines the sources and impacts of these biases, provides quantitative assessments of database performance, and outlines detailed protocols to mitigate these limitations in research practice, particularly for drug development professionals seeking to harness microbial communities for therapeutic discovery.
The Core Challenge: Database-Dependent Biases in Classification
Taxonomic classification tools rely on pre-computed databases of microbial genetic sequences, making database quality and comprehensiveness fundamental to accurate analysis [68]. Several interconnected factors contribute to database-dependent biases:
Incomplete Coverage: Public reference databases remain highly skewed toward well-studied organisms, with approximately 90% of genomes in major archives originating from just 20 microbial species [69]. This creates a systematic underrepresentation of microbial diversity from understudied environments like soils, extreme ecosystems, and host-associated niches.
Taxonomic Imbalances: The composition of databases significantly impacts classification accuracy. Studies demonstrate that classification tools perform substantially better on organisms present in databases while struggling with novel or underrepresented taxa [70] [69]. This problem is particularly acute for non-bacterial domains (archaea, eukaryotes, viruses) and specific bacterial phyla with few cultured representatives.
Sequence Type Disparities: Different classification algorithms utilize different reference components. DNA-to-DNA classifiers require comprehensive genomic databases, while DNA-to-protein tools rely on protein sequence databases, and marker-based methods (e.g., 16S rRNA) depend on curated marker gene collections [68]. Each approach exhibits distinct blind spots depending on database coverage for their specific needs.
The following workflow illustrates how these database limitations introduce biases throughout a standard metagenomic analysis pipeline:
Figure 1: Impact of Reference Database Limitations on Metagenomic Analysis Workflow. Database biases (red) introduced during classification propagate through the entire analytical process, leading to potentially skewed biological interpretations.
Quantitative Assessment of Database Performance
The impact of database choice on taxonomic classification accuracy has been quantitatively demonstrated across multiple studies and environments. The following tables summarize key performance metrics from published benchmarks evaluating different database configurations.
Table 1: Impact of Database Choice on Classification Rate for Rumen Microbiome Data [69]
| Reference Database | Composition | Classification Rate | Notable Characteristics |
|---|---|---|---|
| Hungate | Rumen microbial genomes only | 99.95% | Highly specialized for specific environment |
| RefSeq | Complete bacterial, archaeal, viral genomes from RefSeq + human genome + vectors | 50.28% | General-purpose but incomplete coverage |
| Mini Kraken2 | Subset of RefSeq contents (8GB size limit) | 39.85% | Reduced memory footprint but limited diversity |
| RUG | Rumen Uncultured Genomes (MAGs) | 45.66% | Represents uncultivated diversity |
| RefRUG | RefSeq + Rumen Uncultured Genomes (MAGs) | 70.09% | 1.4× improvement over RefSeq alone |
| RefHun | RefSeq + Hungate genomes | ~100% | Near-complete classification for target environment |
Table 2: Performance of Classification Approaches on Wastewater Microbial Communities [70]
| Classifier | Classification Approach | Genus-Level Misclassification Rate | Key Findings |
|---|---|---|---|
| Kaiju | Protein-level (six-frame translation) | ~25% | Most accurate at genus and species levels |
| Kraken2 | k-mer frequency matching | 25-50% (varies with confidence threshold) | Strong dependency on confidence thresholds |
| RiboFrame | 16S rRNA extraction + k-mer classification | Lowest after kMetaShot on MAGs | Effective but limited to ribosomal sequences |
| kMetaShot on MAGs | k-mer-based for MAGs | 0% | No erroneous genus classifications |
These quantitative assessments reveal that database specialization and supplementation directly enhance classification performance. The complete absence of misclassifications when using kMetaShot on MAGs highlights the potential of environment-specific reference resources, while the variation in Kraken2 performance with confidence thresholds underscores the importance of parameter optimization.
Experimental Protocols for Database Evaluation and Enhancement
Protocol: Benchmarking Taxonomic Classifiers with Simulated Communities
Purpose: To quantitatively evaluate the accuracy and limitations of taxonomic classification tools and reference databases using simulated metagenomic data.
Materials:
- High-quality microbial genomes from target environment
- Metagenomic sequence simulator (e.g., InSilicoSeq, CAMISIM)
- Taxonomic classification tools (Kaiju, Kraken2)
- Computing infrastructure with sufficient RAM (≥200 GB for comprehensive databases)
Procedure:
- Reference Selection: Curate a set of complete microbial genomes representing the environment of interest (e.g., 460 rumen microbial genomes from the Hungate collection) [69].
- Data Simulation: Generate synthetic metagenomic reads from the reference genomes:
- Use a sequencing simulator with appropriate error profiles
- Maintain known proportional abundances or simulate even communities
- Example: 50 million 150bp paired-end reads simulated from 460 genomes
- Database Configuration: Prepare multiple reference databases:
- General database (e.g., RefSeq)
- Specialized database (e.g., Hungate genomes)
- Hybrid database (e.g., RefSeq + specialized genomes)
- MAG-enhanced database (e.g., RefSeq + relevant MAGs)
- Classification Execution: Process simulated data with each classifier and database combination:
- For Kaiju: Test varying E-values (0.0001-0.01) and minimum match lengths (11-42 aa)
- For Kraken2: Test multiple confidence thresholds (0.05-0.99)
- Record classification rates at different taxonomic levels
- Accuracy Assessment: Compare classifications to ground truth:
- Calculate precision, recall, and F1 scores
- Identify systematic misclassifications and unclassified taxa
- Evaluate computational requirements (RAM, runtime)
Expected Outcomes: This protocol generates quantitative performance metrics that reveal database-specific limitations and optimal classifier configurations for particular environments.
Protocol: Constructing Environment-Specific Custom Databases
Purpose: To enhance taxonomic classification accuracy for understudied environments by building customized reference databases.
Materials:
- Isolate genomes from target environment
- Metagenome-Assembled Genomes (MAGs) from relevant studies
- Computational resources for database construction
- Taxonomic annotation pipeline (e.g., GTDB-Tk for MAGs)
Procedure:
- Genome Curation:
- Collect all available isolate genomes from target environment
- Compile high-quality MAGs from previous studies in similar environments
- Apply quality filters: >90% completeness, <5% contamination for MAGs
- Taxonomic Annotation:
- Assign taxonomic labels to MAGs using standardized pipelines
- Prefer full taxonomic lineages over partial assignments
- Resolve conflicts between different annotation sources
- Database Construction:
- For k-mer-based classifiers (Kraken2): Build custom database incorporating both isolate genomes and MAGs
- For alignment-based tools: Create concatenated reference sequence files
- For protein-based classifiers (Kaiju): Generate custom protein reference database
- Validation:
- Test custom database on simulated community with known composition
- Compare performance against standard reference databases
- Iteratively refine database composition based on performance
Expected Outcomes: Custom databases typically improve classification rates by 50-70% for understudied environments compared to general databases alone [69].
The Scientist's Toolkit: Essential Research Reagents and Materials
Table 3: Key Research Reagent Solutions for Metagenomic Database Enhancement
| Reagent/Resource | Function | Application Notes |
|---|---|---|
| Hungate1000 Collection | Cultured rumen microbial genomes | Provides 460+ reference genomes representing ~75% of ruminal bacterial and archaeal genera [69] |
| RefSeq Database | Comprehensive collection of reference sequences | General-purpose database but with significant gaps for understudied environments [68] |
| SILVA Database | Curated collection of ribosomal RNA sequences | Essential for marker-based approaches; contains ~2 million 16S rRNA sequences [68] |
| Metagenome-Assembled Genomes (MAGs) | Draft genomes reconstructed from metagenomic data | Represent uncultivated microbial diversity; require taxonomic annotation before database inclusion [69] |
| Kaiju Classifier | Protein-level taxonomic classification tool | Most accurate classifier in benchmarks; requires substantial RAM (>200GB) for comprehensive databases [70] |
| Kraken2 Classifier | k-mer-based taxonomic classification tool | Fast classification with configurable confidence thresholds; performance highly database-dependent [70] |
| MetaBAT2 Binner | Tool for metagenomic binning | Generates MAGs from assembled contigs; multiple settings available ("custom", "default", "metalarge") [70] |
Integrated Strategy for Mitigating Database Biases
The following workflow integrates multiple approaches to address reference database limitations systematically, providing a roadmap for researchers to enhance taxonomic classification accuracy in their metagenomic studies:
Figure 2: Comprehensive Strategy for Addressing Taxonomic Classification Biases. This integrated approach combines database enhancement, methodological optimization, and community resource development to mitigate reference database limitations.
Reference database limitations represent a fundamental challenge in metagenomic analysis that directly impacts the accuracy of taxonomic classification and subsequent biological interpretations. Quantitative assessments demonstrate that database choice can affect classification rates by more than 50 percentage points, with misclassification rates reaching 25% or higher for some commonly used tools [70] [69]. The strategies outlined in this application note—including database customization, MAG integration, systematic benchmarking, and classifier optimization—provide actionable pathways to mitigate these biases. For drug development professionals and microbial ecologists, addressing these limitations is essential for accurate characterization of microbial communities and unlocking their potential for therapeutic discovery. As the field advances, continued development of comprehensive, well-curated reference resources and robust classification methodologies will be crucial for realizing the full potential of metagenomic approaches to illuminate the hidden diversity of microbial ecosystems.
Metagenomics, the sequencing and analysis of genomic DNA from entire microbial communities, faces significant challenges in assembly due to the inherent complexity of microbiomes. Unlike single-isolate sequencing, metagenomic data originates from numerous different organisms with varying taxonomic backgrounds, unequal abundance levels, and substantial strain variation [71]. These factors lead to highly fragmented assemblies that hinder accurate genomic reconstruction and downstream analysis, particularly for antibiotic resistance gene detection and functional characterization [72].
The principal challenges in metagenomic assembly include: (1) interspecies repeats where conservative parts of genes belong to different species due to horizontal gene transfer; (2) uneven coverage of community members resulting from abundance differences; (3) closely related microorganisms with similar genomes; and (4) multiple strains of the same species [72] [71]. These challenges are particularly problematic for antibiotic resistance gene prediction, where existing tools show low sensitivity with fragmented metagenomic assemblies. Research demonstrates that more than 30% of profile HMM hits for antibiotic resistance genes are not contained within single scaffolds, highlighting the critical limitation of conventional assembly approaches [72].
Graph-Based Solutions to Assembly Limitations
Fundamental Principles of Graph-Based Assembly
Graph-based assembly methods represent a paradigm shift from conventional linear assembly approaches. Rather than producing a consensus assembly with collapsed variations, these methods utilize assembly graphs that preserve sequence relationships and variations [72]. The de Bruijn graph implementation, used by tools like MEGAHIT, employs a succinct de Bruijn graph (SdBG) to achieve low-memory assembly while maintaining critical information about sequence connectivity [71].
The key advantage of graph-based approaches lies in their ability to recover gene sequences directly from assembly graphs without relying on complete metagenomic assembly. This capability significantly improves the detection of genes fragmented across multiple contigs, such as the blaIMP beta-lactamase gene found across 10 edges of an assembly graph and 2 scaffolds in wastewater metagenome analysis [72]. For microbial community analysis, this translates to more accurate profiling of functional potential and resistance mechanisms.
Performance Advantages of Graph-Based Methods
Table 1: Performance Comparison of Assembly Approaches for AMR Gene Detection
| Assembly Method | Sensitivity for Full-Length Genes | Handling of Strain Variation | Computational Efficiency |
|---|---|---|---|
| Read-based | Limited for genes >300bp | Limited | High |
| Traditional Assembly | Moderate (fragmented for 30%+ of genes) | Collapses variations | Variable |
| Graph-based | High (recovers fragmented sequences) | Preserves variations | Moderate to high |
Graph-based methods demonstrate particular utility for complex microbial communities where traditional assemblers yield fragmented results. In wastewater treatment plant microbial communities, graph-based approaches enabled significantly improved recovery of antibiotic resistance genes compared to ordinary metagenomic assembly [72]. Similarly, for transcriptome analysis, graph-based visualization methods help interpret complex transcript isoforms from short-read RNA-Seq data that challenge conventional visualization approaches [73].
For error-prone long reads, graph-based hybrid error correction methods show distinct performance characteristics compared to alignment-based methods. Mathematical modeling reveals that the original error rate of 19% represents the limit for perfect correction, beyond which long reads become too error-prone for effective correction [74].
Application Notes: GraphAMR Pipeline for Antibiotic Resistance Gene Detection
Pipeline Architecture and Implementation
The GraphAMR pipeline represents a specialized implementation of graph-based approaches specifically designed for antibiotic resistance gene detection from fragmented metagenomic assemblies. Implemented using the Nextflow framework for scalable, reproducible computational workflows, GraphAMR utilizes assembly graphs rather than contig sets for analysis [72].
The pipeline operates through four integrated stages:
- Optional metagenomic de novo assembly using metaSPAdes with quality control via FastQC
- Profile HMM alignment to the assembly graph using PathRacer
- Detection and clustering of putative antibiotic resistance open reading frames
- Annotation of representative antibiotic resistance sequences using state-of-the-art tools
A key innovation in GraphAMR is its use of PathRacer, a tool that performs profile HMM alignment directly to assembly graphs, enabling extraction of putative antibiotic resistance gene sequences spanning multiple contigs [72]. This approach effectively bypasses the limitations of fragmented assemblies by considering all possible HMM paths through the entire assembly graph.
Experimental Protocol for GraphAMR Implementation
Table 2: Research Reagent Solutions for Graph-Based Metagenomic Assembly
| Reagent/Resource | Function | Implementation in Pipeline |
|---|---|---|
| metaSPAdes | Metagenomic assembly | Generates assembly graph from raw reads |
| PathRacer | Profile HMM alignment to graph | Identifies AMR gene paths in assembly graph |
| NCBI AMR Database | Reference HMM profiles | Provides target models for resistance genes |
| Nextflow | Workflow management | Enables scalable, reproducible analysis |
| MEGAHIT | Alternative assembler | Optional assembly using succinct de Bruijn graphs |
Sample Preparation and Sequencing Requirements:
- DNA extraction should be performed using kits suitable for microbial communities
- Sequencing via Illumina platforms (100-300bp read lengths)
- Minimum recommended coverage: 10x for dominant community members
- Quality control assessment via FastQC
GraphAMR Execution Protocol:
- Input Preparation: Provide either raw sequencing reads (FASTQ format) or existing assembly graph (GFA format)
- Assembly Step (if using raw reads): Execute metaSPAdes with parameters optimized for your community complexity
- HMM Alignment: Run PathRacer with NCBI AMR profile HMMs or custom HMMs against assembly graph
- Sequence Extraction: Extract putative antibiotic resistance gene sequences from graph paths
- Dereplication and Annotation: Cluster sequences and annotate using standard antibiotic resistance detection tools
The pipeline is publicly available at https://github.com/ablab/graphamr and supports job submission on computational clusters and cloud systems [72].
Advanced Applications in Microbial Community Analysis
Temporal Dynamics Prediction Using Graph Neural Networks
Beyond assembly improvement, graph-based approaches enable sophisticated analysis of microbial community dynamics. Recent research demonstrates that graph neural network models can accurately predict future species abundance dynamics in complex microbial communities [7].
In wastewater treatment plant microbial communities, graph neural networks trained on historical relative abundance data successfully predicted species dynamics up to 10 time points ahead (2-4 months), sometimes extending to 20 time points (8 months) [7]. The model architecture incorporates:
- Graph convolution layers that learn interaction strengths among amplicon sequence variants
- Temporal convolution layers that extract temporal features across time
- Output layers with fully connected neural networks that predict future relative abundances
This approach, implemented as the "mc-prediction" workflow, has demonstrated applicability across ecosystems, including human gut microbiome data [7].
Visualization and Interpretation of Complex Assemblies
Graph-based visualization methods significantly enhance interpretation of complex metagenomic assemblies. Tools like Graphia Professional enable 3D visualization of RNA assembly graphs where nodes represent reads and edges represent similarity scores [73]. This approach facilitates identification of issues in assembly, repetitive sequences within transcripts, and splice variants that challenge conventional visualization methods.
For metagenome analysis, these visualization techniques help researchers understand the complex topology of sequence relationships, particularly when dealing with horizontally transferred genes or strain variations that create intricate branching patterns in assembly graphs [73].
Graph Assembly Comparison
Graph-based approaches represent a fundamental advancement in addressing the persistent challenge of sequence fragmentation in metagenomic analysis. By leveraging assembly graphs rather than linear contigs, these methods enable more complete gene recovery, improved detection of strain variations, and more accurate profiling of functional potential in complex microbial communities.
The integration of graph-based assembly with machine learning approaches, particularly graph neural networks, opens new possibilities for predicting microbial community dynamics and understanding complex ecological interactions. As these methods continue to mature, they promise to enhance our ability to decipher the functional capabilities of microbiomes across environments from wastewater treatment systems to human gut ecosystems.
For researchers investigating microbial communities in drug development contexts, graph-based approaches offer more reliable detection of resistance genes and virulence factors, ultimately supporting more informed decisions in antimicrobial development and microbiome-based therapeutics. The continued refinement of these computational approaches will be essential for unlocking the full potential of metagenomics in understanding and harnessing microbial community functions.
In metagenomic research, the biological data derived from sequencing is only as interpretable as the environmental context that accompanies it. This contextual information, known as metadata, provides the essential framework that enables researchers to understand, compare, and reuse microbial community data across studies and domains. The National Microbiome Data Collaborative (NMDC) emphasizes that metadata encompasses information that contextualizes samples, including geographic location, collection date, sample preparation methods, and data processing techniques [75]. Without robust, standardized metadata, even the highest quality sequence data loses much of its scientific value and reuse potential.
The critical importance of environmental context stems from its profound influence on microbial community structure and function. Environmental parameters determine which microorganisms can survive and thrive in a given habitat, driving the ecological and functional adaptations that researchers seek to understand through metagenomic analysis. Consequently, comprehensive documentation of environmental context is not merely an administrative exercise but a fundamental scientific necessity for drawing meaningful biological insights from complex microbial community data.
Core Metadata Standards for Environmental Context
The MIxS Framework and Environmental Packages
The Minimum Information about any (x) Sequence (MIxS) standard, developed by the Genomic Standards Consortium (GSC), provides a unified framework for describing genomic sequences and their environmental origins [75]. MIxS incorporates checklists and environmental packages that standardize how researchers document sample attributes across different ecosystems. The standard includes 17 specialized environmental packages tailored to specific habitats such as soil, water, and host-associated environments, each containing mandatory and recommended descriptors relevant to that ecosystem [75].
The MIxS framework employs a triad of key environmental descriptors that collectively capture the hierarchical nature of environmental context:
- envbroadscale: Describes the major environmental system (biome) from which the sample originated, such as a forest biome or oceanic pelagic zone biome [75]
- envlocalscale: Characterizes the immediate environmental feature exerting direct influence on the sample, such as a mountain, pond, or whale fall [75]
- env_medium: Specifies the environmental material immediately surrounding the sample prior to collection, such as sediment, soil, water, or air [75]
GOLD Ecosystem Classification
The Genomes OnLine Database (GOLD) provides an alternative ecosystem classification system that organizes biosamples using a detailed five-level hierarchical path [75]. This classification system includes:
- Ecosystem: Broadest context (environmental, engineered, or host-associated)
- Ecosystem Category: Subdivision of ecosystem (e.g., aquatic, terrestrial)
- Ecosystem Type: Specific classification within categories (e.g., freshwater, marine, soil)
- Ecosystem Subtype: Additional environmental context or boundaries
- Specific Ecosystem: The environment that directly influences the sample [75]
Environmental Ontology (EnvO)
The Environment Ontology (EnvO) offers a third approach with formally defined terms identified using unique resolvable identifiers [75]. Each term in EnvO has a precise definition and sits within a logical hierarchy, enabling both humans and computers to unambiguously understand and connect environmental concepts across datasets. The NMDC has integrated EnvO as the recommended value source for the MIxS environmental triad, creating a powerful combination of consistent reporting standards with computable ontological terms [75].
Table 1: Comparison of Major Metadata Standards for Environmental Context
| Standard | Developer | Primary Focus | Structure | Key Advantages |
|---|---|---|---|---|
| MIxS | Genomic Standards Consortium (GSC) | Minimum information checklists for sequence data | Modular checklist with environmental packages | Community-driven; specific mandatory fields; 17 environment-specific packages |
| GOLD Classification | Joint Genome Institute (JGI) | Ecosystem classification for sequencing projects | Five-level hierarchical path | Comprehensive ecosystem detail; well-established in genomics research |
| EnvO | OBO Foundry | Ontological representation of environmental entities | Logical hierarchy with unique identifiers | Computable relationships; precise definitions; enables data integration |
Application Notes: Implementing Environmental Metadata Standards
Protocol for Annotating Lake Sediment Samples
Principle: Accurate environmental contextualization requires systematic application of standardized terms from appropriate resources. This protocol provides a step-by-step methodology for annotating a lake sediment sample using the MIxS-EnvO framework.
Materials:
- Sample information (collection location, habitat description, environmental measurements)
- Access to the Environment Ontology (OBO Foundry) browser
- MIxS checklist and relevant environmental package
Procedure:
- Sample Characterization: Determine the broad ecological context of the sample. For a lake sediment sample, identify the appropriate biome term. Navigate the EnvO hierarchy from "biome" to "aquatic biome" to "freshwater biome" and finally select "freshwater lake biome" [ENVO:01000252] as the value for envbroadscale [75].
Local Feature Identification: Characterize the immediate environmental feature influencing the sample. Traverse the EnvO "astronomical body part" hierarchy from "lake" to more specific categories. For an oligotrophic lake, select "oligotrophic lake" [ENVO:01000774] as the value for envlocalscale [75].
Environmental Material Specification: Define the physical material surrounding the sample. Using the EnvO "environmental material" hierarchy, navigate from "sediment" to "lake sediment" [ENVO:00000546] as the value for env_medium [75].
Supplemental Metadata Collection: Document additional relevant environmental parameters specified in the MIxS water or sediment environmental package, including:
- Geographic coordinates (latitude and longitude)
- Collection date and time
- Depth below water surface and sediment depth
- Temperature, pH, and chemical characteristics
- Sampling method and preservation approach
Validation: Verify that all terms use correct EnvO identifiers and that mandatory MIxS fields are completed. Ensure internal consistency between the various environmental descriptors.
Protocol for Metadata Standard Compliance Certification
Principle: Establishing a "certification of compliance" for metadata completeness encourages data reuse and enhances citation metrics by designating datasets ready for secondary analysis [76].
Materials:
- Study data and associated metadata
- Relevant MIxS checklist and environmental package
- Metadata validation tool or spreadsheet
Procedure:
- Standard Selection: Identify the appropriate MIxS environmental package based on the sample type (e.g., soil, water, sediment).
Mandatory Field Completion: Ensure all mandatory fields in the selected MIxS package are populated with valid values.
Ontology Term Validation: Verify that all terms requiring ontological annotation use valid identifiers from approved ontologies such as EnvO.
Data Quality Assessment: Check for internal consistency between related fields (e.g., geographic coordinates and described location).
Documentation Compilation: Assemble all required supporting documentation, including sampling protocols, measurement methodologies, and data processing workflows.
External Review: Submit metadata to a peer or automated validation service for compliance assessment.
Certification Designation: Upon successful validation, assign a compliance certification to the dataset, indicating its readiness for reuse and inclusion in meta-analyses.
The Researcher's Toolkit for Environmental Metadata
Implementing robust environmental metadata standards requires both conceptual understanding and practical tools. The following essential resources form a foundation for effective metadata management in metagenomic research.
Table 2: Essential Research Reagent Solutions for Environmental Metadata
| Tool/Resource | Type | Primary Function | Access Point |
|---|---|---|---|
| MIxS Checklists & Packages | Reporting Standard | Defines minimum information requirements for sequence data | Genomic Standards Consortium (GSC) website |
| Environment Ontology (EnvO) | Controlled Vocabulary | Provides standardized terms for environmental description | OBO Foundry Portal |
| GOLD Ecosystem Classification | Ecosystem Taxonomy | Offers hierarchical ecosystem categorization | Genomes OnLine Database (GOLD) |
| NMDC Metadata Templates | Integrated Framework | Combines MIxS, GOLD, and EnvO in curated templates | National Microbiome Data Collaborative portal |
| Metadata Validation Tools | Quality Assurance | Automated checking of metadata completeness and syntax | Repository-specific submission portals |
Integration with FAIR Data Principles
Well-structured environmental metadata is fundamental to achieving the FAIR (Findable, Accessible, Interoperable, and Reusable) data principles that guide modern scientific data management [76]. The implementation of standards like MIxS, GOLD, and EnvO directly supports these principles by making data more discoverable through standardized annotation, more accessible through clear contextual information, more interoperable through computable ontological terms, and more reusable through comprehensive documentation of experimental and environmental conditions [77].
The connection between rich environmental context and data reuse is particularly evident in large-scale meta-analyses. As noted by NMDC Ambassador Winston Anthony, "By requiring the inclusion of metadata like latitude and longitude coordinates of sampling locations and collection time/date, we now have incredibly rich, longitudinal datasets at the continental and even global scale for which we can start to mine for new microbiological insight" [77]. This demonstrates how standardized environmental metadata enables research at scales impossible through individual studies alone.
Environmental context provides the essential framework that transforms raw sequence data into biologically meaningful information about microbial communities. The implementation of robust metadata standards such as MIxS, GOLD ecosystem classification, and EnvO ontological terms is not merely a technical formality but a critical scientific practice that enables data interpretation, integration, and reuse. As the field of metagenomics continues to evolve toward more large-scale, integrative analyses, the consistent and comprehensive application of these standards will become increasingly vital for advancing our understanding of microbial communities in their environmental contexts.
By adopting the protocols and methodologies outlined in these application notes, researchers can significantly enhance the scientific value of their metagenomic datasets, contributing to a more collaborative and cumulative approach to understanding the microbial world.
The rapid expansion of public genomic repositories is outpacing the growth of computational resources, presenting a significant challenge for metagenomic analysis [78]. This disparity necessitates a generational leap in bioinformatics software, moving towards tools that deliver high performance and precision while maintaining a small memory footprint and enabling the use of larger, more diverse reference datasets in daily research [78]. The advent of long-read sequencing technologies, such as Oxford Nanopore Technologies (ONT) and Pacific Biosciences (PacBio), has further intensified this demand by generating complex datasets that provide unprecedented resolution for analyzing microbial communities directly from environmental samples [56]. This Application Note details the optimized computational protocols and scalable algorithms essential for managing the data deluge in modern metagenomics, providing a framework for efficient and accurate large-scale microbial community analysis.
Performance Benchmarks of Scalable Metagenomic Tools
Selecting the appropriate computational tool is critical for managing resources effectively. Benchmarking studies reveal significant differences in the performance and resource requirements of state-of-the-art software. The table below summarizes the quantitative performance data for key tools discussed in this protocol.
Table 1: Performance Metrics of Scalable Metagenomic Analysis Tools
| Tool | Primary Function | Key Performance Advantage | Reported F1-Score Improvement (Median) | Memory Footprint |
|---|---|---|---|---|
| ganon2 [78] | Taxonomic binning and profiling | One of the fastest tools evaluated; enables use of large, up-to-date reference sets. | Up to 0.15 (binning), Up to 0.35 (profiling) | Indices ~50% smaller than state-of-the-art methods |
| metaSVs [56] | Identification and classification of structural variations (SVs) | Resolves complex genomic variations overlooked by short-read sequencing. | Information not specified | Information not specified |
| BASALT [56] | Binning | Latest binning software for long-read data. | Information not specified | Information not specified |
| EasyNanoMeta [56] | Integrated bioinformatics pipeline | Addresses challenges in analyzing nanopore-based metagenomic data. | Information not specified | Information not specified |
These tools exemplify the shift towards algorithms that maximize output accuracy while minimizing computational overhead, a fundamental principle of computational resource optimization [56] [78].
Experimental Protocols for Scalable Metagenomic Analysis
Protocol 1: Taxonomic Profiling and Binning with Ganon2
Application: This protocol is designed for comprehensive taxonomic classification and abundance profiling of metagenomic samples using the ganon2 tool, which is optimized for speed and a small memory footprint [78].
Reagents and Computational Resources:
- Hardware: Standard high-performance computing (HPC) cluster or server.
- Software: ganon2 (open-source, available at https://github.com/pirovc/ganon).
- Reference Database: NCBI RefSeq or a customized subset.
Methodology:
- Index Construction: Build a custom reference index from a curated genomic dataset. This step is performed once per database and benefits from ganon2's efficient compression, which produces indices approximately 50% smaller than other state-of-the-art methods [78].
- Example Command:
ganon build --db-type sequences --reference-database /path/to/refseq --output-prefix my_index
- Example Command:
- Sequence Classification: Perform taxonomic binning of metagenomic reads against the pre-built index. ganon2's algorithm is designed for high-speed classification, making it feasible to process large datasets rapidly [78].
- Example Command:
ganon classify --reads /path/to/sample.fastq --index-prefix my_index --output-prefix sample_results
- Example Command:
- Profile Generation: Produce a final taxonomic profile summarizing the abundance of each taxon in the sample. ganon2 has demonstrated improvements in the F1-score median of up to 0.35 for profiling while maintaining a balanced error in abundance estimation [78].
- Example Command:
ganon report --input-prefix sample_results --output sample_profile.txt
- Example Command:
Protocol 2: Long-Read Metagenomic Assembly and Analysis
Application: This protocol leverages long-read sequencing data from ONT or PacBio platforms for improved assembly of complex genomic regions, including repeats and structural variations, leading to more complete metagenome-assembled genomes (MAGs) [56].
Reagents and Computational Resources:
- Sequencing Technology: Oxford Nanopore (e.g., MinION, PromethION) or PacBio (e.g., Sequel, Revio) platforms.
- Assembly Software: metaFlye or HiFiasm-meta for long-read and HiFi read assembly, respectively [56].
- Binning Software: BASALT for binning long-read metagenomic data [56].
Methodology:
- Basecalling and Quality Control: Convert raw current signals (ONT) or polymerase reads (PacBio) into nucleotide sequences. For ONT, utilize the super-accurate basecalling mode in Guppy or Dorado to achieve high accuracy (e.g., ≥ Q20 with R10.4.1 flow cells and Q20+ chemistry) [56].
- Metagenomic Assembly: Assemble the quality-filtered long reads into contigs using a long-read-specific assembler. metaFlye has demonstrated excellent performance in generating continuous genomic sequences, while HiFiasm-meta is specialized for high-fidelity (HiFi) PacBio reads [56].
- Example Command (metaFlye):
flye --nano-hq /path/to/reads.fastq --out-dir /path/assembly_output --meta
- Example Command (metaFlye):
- Binning and Genome Reconstruction: Group assembled contigs into putative genomes (binning) using tools like BASALT, which is designed for long-read data. This process facilitates the reconstruction of circularized genomes and the development of high-quality microbiome reference catalogs [56].
- Downstream Analysis:
- Structural Variation (SV) Detection: Use tools like metaSVs to identify insertions, deletions, inversions, and translocations in the assembled data, providing insights into microbial evolution and population genetics [56].
- Functional Annotation: Predict genes and identify key genomic elements, such as antibiotic resistance genes (ARGs) and biosynthetic gene clusters (BGCs), which are valuable for drug development [56].
Visualization of a Scalable Metagenomic Workflow
The following diagram illustrates the logical flow and resource-optimized pathway for analyzing metagenomic data, integrating both short-read and long-read strategies.
Table 2: Key Research Reagents and Computational Resources for Metagenomics
| Item Name | Function/Application | Specific Example / Note |
|---|---|---|
| PacBio Revio Sequencer | Long-read sequencing generating high-fidelity (HiFi) reads. | Provides HiFi reads with accuracy surpassing Q30, enhancing assembly quality [56]. |
| Oxford Nanopore MinION | Portable, real-time long-read sequencing. | Supports field-deployable and in-situ monitoring of environmental communities [56]. |
| NCBI RefSeq Database | Curated, non-redundant reference genome database. | A primary resource for building classification indices; ganon2 enables efficient use of its full scale [78]. |
| R10.4.1 Flow Cell (ONT) | Nanopore sequencing flow cell with updated chemistry. | Capable of generating data with an accuracy of ≥ Q20, improving base-calling precision [56]. |
| ZymoBIOMICS Gut Microbiome Standard | Mock microbial community standard. | Used for benchmarking and validating metagenomic protocols and tools [56]. |
| Human Gastrointestinal Bacteria Culture Collection (HBC) | Collection of whole-genome-sequenced bacterial isolates. | Enhances taxonomic and functional annotation in gut metagenomic studies [5]. |
Benchmarking Performance: Validation Frameworks and Comparative Method Analysis
The Critical Assessment of Metagenome Interpretation (CAMI) is a community-driven initiative that addresses the critical need for standardized benchmarking of computational metagenomic methods. As the field of metagenomics has expanded, the rapid development of diverse software tools for analyzing microbial communities has created a pressing challenge: the lack of consensus on benchmarking datasets and evaluation metrics makes objective performance assessment extremely difficult [79]. CAMI was established to tackle this problem by bringing together the global metagenomics research community to facilitate comprehensive software benchmarking, promote standards and good practices, and accelerate advancements in this rapidly evolving field [80].
The fundamental premise behind CAMI recognizes that biological interpretation of metagenomes relies on sophisticated computational analyses including read assembly, binning, and taxonomic profiling, and that all subsequent analyses can only be as meaningful as these initial processing steps [79]. Before CAMI, method evaluation was largely limited to individual tool publications that were extremely difficult to compare due to varying evaluation strategies, benchmark datasets, and performance criteria across studies [79]. This lack of standardized assessment left researchers poorly informed about methodological limitations and appropriate software selection for specific research questions.
CAMI operates through a series of challenge rounds where developers benchmark their tools on complex, realistic datasets, with results collectively analyzed to provide performance overviews. The initiative has organized multiple benchmarking challenges since 2015, with the second round (CAMI II) assessing 5,002 results from 76 program versions on datasets created from approximately 1,700 microbial genomes and 600 plasmids and viruses [81]. To further support the community, CAMI has developed a Benchmarking Portal that serves as a central repository for CAMI resources and a web server for continuous evaluation and ranking of metagenomic software, currently hosting over 28,000 results [82]. This infrastructure enables researchers to obtain objective, comparative performance data when selecting tools for their metagenomic analyses, ultimately leading to more robust and reproducible research outcomes in microbial community studies.
The CAMI Benchmarking Framework
Core Components and Evaluation Metrics
The CAMI framework systematically evaluates metagenomic software across four primary analytical tasks, each with specialized assessment methodologies and community-standardized metrics. The benchmarking process employs carefully designed datasets and evaluation protocols that reflect real-world analytical challenges.
Assembly methods are assessed using the MetaQUAST toolkit, which provides metrics including genome fraction (assembled percentage of individual reference genomes), assembly size (total length in base pairs), number of misassemblies, and count of unaligned bases [80] [79]. These combined metrics offer a comprehensive picture of assembly performance, as individually they provide insufficient assessment—for example, a large assembly size alone does not indicate high quality if misassembly rates are also high [79].
Binning methods, which assign sequences to broader categories, are divided into two subtypes. Genome binning tools group sequences into putative genomes and are evaluated using AMBER (Assessment of Metagenome BinnERs), which calculates purity and completeness at various taxonomic levels [80]. Taxonomic binning methods assign taxonomic identifiers to sequences and are assessed using similar purity and completeness metrics but within a taxonomic framework [83].
Taxonomic profiling methods, which estimate taxon abundances in microbial communities, are evaluated using OPAL, which compares predicted profiles to gold standards using multiple metrics including precision, recall, and abundance accuracy [80] [84]. Performance is measured across taxonomic ranks from strain to phylum, as methods often exhibit rank-dependent performance characteristics [79].
The CAMI evaluation philosophy emphasizes that parameter settings substantially impact performance, underscoring the importance of software reproducibility [79]. Participants are strongly encouraged to submit reproducible results using standardized software containers, enabling fair comparison and verification of results.
Table 1: CAMI Software Evaluation Metrics
| Analysis Type | Evaluation Tool | Key Metrics | Purpose |
|---|---|---|---|
| Assembly | MetaQUAST | Genome fraction, assembly size, misassemblies, unaligned bases | Assess contiguity and accuracy of reconstructed sequences |
| Genome Binning | AMBER | Purity, completeness, contamination | Evaluate quality of genome recovery |
| Taxonomic Profiling | OPAL | Precision, recall, L1 norm error, weighted UniFrac | Quantify accuracy of taxonomic abundance estimates |
| Runtime Performance | Custom benchmarking | CPU time, memory usage, scalability | Measure computational efficiency |
Benchmark Dataset Generation with CAMISIM
CAMI employs CAMISIM (CAMI Simulator) to generate realistic benchmark metagenomes with known gold standards for method evaluation. This sophisticated simulator can model different microbial abundance profiles, multi-sample time series, and differential abundance studies, while incorporating real and simulated strain-level diversity [85]. CAMISIM generates both second- and third-generation sequencing data from either provided taxonomic profiles or through de novo community design [85].
The simulation process involves three distinct stages. In the community design phase, CAMISIM selects community members and their genomes, assigning relative abundances either based on user-provided taxonomic profiles in BIOM format or through de novo sampling from available genome sequences [85]. For profile-based design, the tool maps taxonomic identifiers to NCBI taxon IDs and selects available complete genomes for taxa in the profile, with configurable parameters for the maximum number of strains per taxon and abundance distribution patterns [85].
In the metagenome sequencing phase, CAMISIM generates actual sequencing reads mimicking various technologies including Illumina, PacBio, and Nanopore, incorporating technology-specific error profiles and read lengths [85]. The final postprocessing phase creates comprehensive gold standards for assembly, genome binning, taxonomic binning, and taxonomic profiling, enabling precise performance assessment [85].
The versatility of CAMISIM allows creation of benchmark datasets representing various experimental setups and microbial environments. For CAMI II, this included a marine environment, a high strain diversity environment ("strain-madness"), and a plant-associated environment with fungal genomes and host plant material [81]. These datasets included both short-read and long-read sequences, providing comprehensive challenge scenarios for method developers [81].
Diagram 1: CAMISIM Benchmark Dataset Generation Workflow. The three-phase process for creating benchmark metagenomes with known gold standards for method evaluation.
Key Findings from CAMI Challenges
Performance Insights Across Method Categories
The CAMI challenges have yielded comprehensive performance data across metagenomic software categories, revealing both strengths and limitations of current methods. These findings provide invaluable guidance for researchers selecting analytical tools for specific research contexts.
Assembly methods demonstrated proficiency in reconstructing sequences from species represented by individual genomes, but performance substantially declined when closely related strains were present in the community [79] [81]. The introduction of long-read sequencing data in CAMI II led to notable improvements in assembly quality, with some assemblers particularly benefiting from these longer, more contiguous reads [81]. However, strain-level resolution remained challenging even with advanced assembly algorithms, highlighting a persistent limitation in metagenome analysis.
Taxonomic profiling tools showed marked maturation between CAMI challenges, with particularly strong performance at higher taxonomic ranks (phylum to family) [81]. However, accuracy significantly decreased at finer taxonomic resolutions (genus and species levels), with this performance drop being especially pronounced for viruses and Archaea compared to bacterial taxa [81] [79]. This rank-dependent performance pattern underscores the importance of selecting profiling tools appropriate for the required taxonomic resolution.
Genome binning approaches excelled at recovering moderate-quality genomes but struggled to produce high-quality, near-complete genomes from complex communities [81]. The presence of evolutionarily related organisms substantially impacted binning performance, with tools having difficulty distinguishing between closely related strains [79]. Recent benchmarking beyond CAMI indicates that multi-sample binning significantly outperforms single-sample approaches, recovering up to 100% more moderate-quality MAGs and 194% more near-complete MAGs in marine datasets [86].
Clinical pathogen detection emerged as an area requiring improvement, with challenges in reproducibility across methods [81]. This finding has significant implications for clinical metagenomics, suggesting the need for standardized protocols and enhanced validation for diagnostic applications.
Table 2: CAMI II Challenge Dataset Composition
| Dataset Type | Number of Genomes | New Genomes | Circular Elements | Sequencing Technologies |
|---|---|---|---|---|
| Marine | 777 | 358 | 599 | Illumina, PacBio |
| Plant-associated | 495 | 293 | 599 | Illumina, PacBio |
| Strain Madness | 408 | 121 | 599 | Illumina |
| Pathogen Detection | Clinical sample from critically ill patient | N/A | N/A | Illumina |
The Impact of Software and Database Selection
CAMI evaluations have consistently demonstrated that the choice of software and reference databases significantly influences biological conclusions in metagenomic studies. Research examining ten widely used taxonomic profilers with four different databases revealed that these combinations could produce substantial variations in the distinct microbial taxa classified, characterizations of microbial communities, and differentially abundant taxa identified [84].
The primary contributors to these discrepancies were differences in database contents and read profiling algorithms [84]. This effect was particularly pronounced for specific pathogen detection, where software differed markedly in their ability to detect Leptospira at species-level resolution, despite using the same underlying sequencing data [84]. These findings underscore that software and database selection must be purpose-driven, considering the specific research questions and target organisms.
The inclusion of host genomes and genomes of specifically interested taxa in databases proved important for increasing profiling accuracy [84]. This highlights the limitations of generic, one-size-fits-all reference databases and supports the use of customized databases tailored to specific research contexts, such as host-associated microbiome studies.
Protocols for CAMI-Based Benchmarking
Implementing Standardized Software Assessment
Researchers can implement CAMI-inspired benchmarking protocols to evaluate metagenomic software performance for their specific applications. The following detailed protocol outlines the standardized assessment process based on CAMI methodologies.
Protocol: Comparative Evaluation of Metagenomic Software Using CAMI Standards
Objective: To objectively compare the performance of computational metagenomic tools using standardized datasets, metrics, and reporting frameworks based on CAMI principles.
Materials and Reagents:
- Computing infrastructure with sufficient storage (>1TB recommended) and memory (≥64GB RAM recommended)
- Linux-based operating system (Ubuntu 18.04+ or CentOS 7+)
- Docker or Singularity container platform
- CAMI benchmark datasets (publicly available from https://cami-challenge.org/participate)
- Reference gold standards for selected datasets
Procedure:
Dataset Selection and Acquisition:
- Select appropriate benchmark datasets from the CAMI repository based on your research domain (e.g., marine, gut, soil)
- Download both sequencing data and corresponding gold standards
- Verify data integrity using checksums provided
Software Containerization:
- Package each tool to be evaluated in Docker containers following bioboxes specifications
- Ensure consistent parameterization and reference database usage across tools
- Document all software versions and database references
Execution of Analyses:
- Run each containerized tool on benchmark datasets using standardized computational resources
- Record runtime and memory usage for efficiency comparisons
- Generate outputs in CAMI-approved formats for each task (assembly, binning, or profiling)
Performance Assessment:
- For assembly: Use MetaQUAST with reference genomes to compute genome fraction, misassemblies, and NA50 metrics
- For binning: Apply AMBER with gold standard genome assignments to calculate purity, completeness, and contamination
- For profiling: Utilize OPAL with gold standard abundances to determine precision, recall, and abundance error
Results Compilation and Visualization:
- Compile all metrics into standardized tables and visualizations
- Generate comparative performance plots across tools and datasets
- Perform statistical analysis to identify significant performance differences
Expected Outcomes: Comprehensive performance evaluation of multiple metagenomic tools across standardized metrics, enabling evidence-based software selection for specific research applications.
Troubleshooting:
- For memory issues with large datasets: Use subset of data or increase swap space
- For container execution errors: Verify bioboxes compatibility and dependency installations
- For inconsistent results: Ensure identical reference database versions across tools
Practical Implementation Guidelines
Successful implementation of CAMI benchmarking protocols requires attention to several practical considerations that significantly impact result reliability and interpretability.
Reference Database Management: Consistent database usage is critical for fair comparisons. When comparing tools, ensure they use reference databases from the same release date to prevent advantages from updated content [83]. For comprehensive evaluation, consider testing each tool with both its default database and a common standardized database to disentangle algorithm performance from database effects.
Computational Resource Monitoring: Track and report computational resource usage including CPU time, peak memory usage, and storage requirements, as these practical considerations often determine tool applicability in different research settings [81] [83]. CAMI II incorporated these metrics, recognizing that computational efficiency represents a critical dimension of tool performance.
Reproducibility Practices: Adopt CAMI's reproducibility standards by using containerized software implementations and documenting all parameters and database versions [83]. The CAMI framework encourages participants to submit reproducible results through Docker containers with specified parameters and reference databases, enabling independent verification of results [79].
Diagram 2: CAMI Software Benchmarking Implementation Workflow. The standardized process for comparative performance assessment of metagenomic software tools.
Research Reagent Solutions
Table 3: Essential Research Reagents and Resources for CAMI-Compliant Metagenomic Benchmarking
| Reagent/Resource | Specifications | Application in CAMI Protocol | Performance Considerations |
|---|---|---|---|
| CAMI Benchmark Datasets | Multi-sample, multi-technology, strain-resolved | Gold standard for method evaluation | Varying complexity levels available for different testing needs |
| Reference Genome Collections | 1,700+ microbial genomes, 600+ plasmids/viruses | Ground truth for assembly and binning | Includes novel genomes distinct from public databases |
| MetaQUAST | v5.0+ with metagenomic extensions | Assembly quality assessment | Genome fraction metrics more informative than contig length |
| AMBER | v2.0+ with binning evaluation features | Genome binning assessment | Provides purity, completeness, and contamination metrics |
| OPAL | v1.0+ with taxonomic profiling metrics | Profiling accuracy evaluation | Supports multiple distance metrics and visualization |
| CAMISIM | v1.0+ with community modeling | Benchmark dataset generation | Customizable for specific experimental designs |
| Docker/Singularity | Containerization platforms | Software reproducibility | Essential for consistent tool execution across environments |
| NCBI Taxonomy Database | Complete taxonomic hierarchy | Taxonomic profiling standardization | Required for consistent taxonomic annotation |
The CAMI Initiative has established foundational community standards for metagenomic software assessment through its comprehensive benchmarking challenges, standardized evaluation metrics, and publicly available resources. The demonstrated performance variations across tools highlight the critical importance of evidence-based software selection in metagenomic research [84] [79]. The persistent challenges in strain-level resolution, viral and archaeal classification, and clinical reproducibility identified through CAMI evaluations point to priority areas for methodological development [81].
The CAMI Benchmarking Portal represents a significant advancement for the field, providing an ongoing resource for comparative performance assessment beyond the periodic challenges [82]. This infrastructure enables continuous monitoring of tool performance as methods evolve, helping researchers maintain current knowledge of best practices. The portal's extensive repository of results—hosting over 28,000 submissions—provides an unprecedented resource for the metagenomics community [82].
For the research community, adherence to CAMI standards promotes reproducibility, enables realistic performance expectations, and informs appropriate tool selection for specific research questions. By providing objective, comparative performance data across diverse datasets and analytical tasks, CAMI empowers researchers to make informed decisions about their computational methods, ultimately strengthening the reliability and interpretability of metagenomic studies across diverse applications from environmental microbiology to clinical diagnostics.
Within the broader scope of metagenomics for microbial community analysis research, the translation of exploratory sequencing techniques into clinically validated diagnostic tools is paramount. Metagenomic next-generation sequencing (mNGS) offers the powerful advantage of unbiased pathogen detection, capable of identifying bacteria, viruses, fungi, and parasites in a single assay [87]. However, for this technology to move from research settings to certified clinical laboratories, it must undergo a rigorous and standardized analytical validation process. This document outlines the critical performance parameters—sensitivity, specificity, and limit of detection (LoD)—and provides detailed application notes and protocols for establishing these metrics for clinical mNGS assays, with a focus on neurological infections.
Core Performance Parameters: Definitions and Benchmarking
The analytical performance of any clinical diagnostic test is judged by three fundamental metrics. The following table defines these parameters and presents benchmark values from a validated mNGS assay for infectious meningitis and encephalitis [87].
Table 1: Core Performance Parameters for a Validated Clinical mNGS Assay
| Parameter | Definition | Benchmark Value (mNGS for CSF) |
|---|---|---|
| Sensitivity | The probability that the test will correctly identify a positive sample. | 73% (vs. original clinical results); 81% (after discrepancy analysis); 92% (in pediatric cohort challenge) [87] |
| Specificity | The probability that the test will correctly identify a negative sample. | 99% [87] |
| Limit of Detection (LoD) | The lowest concentration of an analyte that can be reliably detected by the assay. | Variable by organism; reported 95% LoD for representative organisms ranged from 0.2 to 313 genomic copies or CFU per mL [87] |
Establishing Thresholds for Detection
A key challenge in clinical mNGS is distinguishing true pathogens from background noise or contamination. To minimize false positives, validated assays implement specific threshold criteria [87]:
- For Viruses: Detection is confirmed when non-overlapping reads from ≥3 distinct genomic regions are identified. Common reagent contaminants or flora (e.g., anelloviruses) are typically excluded from reporting [87].
- For Bacteria, Fungi, and Parasites: A normalized metric, the Reads per Million ratio (RPM-r), is used. It is calculated as
RPMsample / RPMNTC(No Template Control). A minimum RPM-r threshold of 10 is set for reporting an organism as "detected," effectively controlling for low-level background contamination present in reagents [87].
Experimental Protocols for Assay Validation
This section provides a detailed methodology for validating an mNGS assay, based on laboratory procedures that have achieved Clinical Laboratory Improvement Amendments (CLIA) compliance [87].
Sample Processing and Sequencing Workflow
The wet-lab protocol for cerebrospinal fluid (CSF) samples is summarized below. For each sequencing run, No Template Controls (NTCs) and Positive Controls (PCs) must be processed in parallel with patient samples [87].
Table 2: Key Research Reagent Solutions for mNGS Validation
| Reagent / Solution | Function | Application Note |
|---|---|---|
| Lysis Buffer (e.g., 50mM Tris, 1% SDS) | Cell disruption and nucleic acid release. | A high-salt SDS-based buffer is effective for gram-positive and negative bacteria [88]. |
| Nextera XT DNA Library Prep Kit | Preparation of sequencing-ready libraries from extracted nucleic acids. | Involves two rounds of PCR; suitable for low-input samples like CSF [87]. |
| Positive Control (PC) Mix | A defined mix of organisms to monitor assay sensitivity and LoD. | Should include representative viruses, bacteria, and fungi at concentrations 0.5- to 2-log above their 95% LoD [87]. |
| Internal Spike-in Phages | Non-pathogenic viral controls added to each sample. | Act as a process control and reliable indicator for sensitivity loss due to factors like host nucleic acid background [87]. |
| SURPI+ Bioinformatics Pipeline | A customized software for rapid pathogen identification from raw mNGS data. | Incorporates filtering algorithms and taxonomic classification for clinical use; results are reviewed via a graphical interface (SURPIviz) [87]. |
Step-by-Step Protocol:
Microbial Enrichment & Nucleic Acid Extraction:
- For CSF samples, begin with a microbial enrichment step, such as centrifugation.
- Extract total nucleic acid using a validated method. The high-salt method is one proven approach [88] [87]. A typical high-salt protocol involves:
- Include internal spike-in phage controls at this stage to monitor extraction efficiency and potential inhibition [87].
Library Construction:
- Use the Nextera XT kit for library preparation according to the manufacturer's instructions, which includes tagmentation, PCR amplification with index primers, and purification [87].
- For 16S rDNA-specific analysis (e.g., for bacterial community profiling), amplify the V4-V5 hypervariable region using primers with sample-specific barcodes, followed by gel purification and library construction for sequencing on a platform like the 454 FLX Titanium [88].
Sequencing:
- Pool libraries in equimolar concentrations.
- Perform sequencing on an Illumina platform (e.g., HiSeq or MiSeq), targeting a depth of 5 to 20 million sequences per library to ensure sufficient coverage for low-abundance pathogens [87].
Bioinformatic Analysis and Clinical Reporting
- Data Processing: Analyze raw sequencing data using the SURPI+ pipeline, which performs rapid alignment against comprehensive reference databases (e.g., NCBI nt) [87].
- Pathogen Identification: Apply the pre-established thresholds (≥3 unique regions for viruses, RPM-r ≥10 for bacteria/fungi/parasites) to generate a list of detected organisms [87].
- Physician Review: A laboratory physician reviews the results through the SURPIviz graphical interface, which provides:
- An automated summary with QC metrics.
- Heat maps of read counts.
- Genome coverage maps.
- The physician assesses clinical significance and finalizes the report for the electronic medical record [87].
Determining the Sample-Specific Limit of Detection
The LoD in mNGS is not a fixed value but is influenced by sample-specific factors. A generalized, probability-based model has been developed to assess the sample-specific LoD (LOD~mNGS~) [89].
Theoretical Model and Protocol
This model addresses the stochastic nature of read detection in complex metagenomic samples. The main determinant of mNGS sensitivity is the virus-to-sample background ratio, not the absolute virus concentration or genome size alone [89].
The model uses a transformed Bernoulli formula to predict the minimal dataset size required to detect one microbe-specific read with a probability of 99% [89]. The steps to apply this model are as follows:
- Sequence the Sample: Generate a standard mNGS dataset from the clinical sample.
- Perform Rarefaction Analysis: Subsample the dataset at various depths and determine the point at which the pathogen of interest is detected. This reveals the stochastic detection behavior.
- Apply the Probability Model: Using the formula derived from the Bernoulli process, calculate the minimum number of sequences required from the sample to detect a target read with 99% confidence.
- Correlate with Quantitative PCR: Validate the theoretical LOD~mNGS~ by comparing it with the pathogen concentration determined by a targeted method like RT-qPCR. Studies show strong congruence between the predicted LOD~mNGS~ and qPCR results [89].
This approach provides a standardized framework for reporting the sensitivity of mNGS results on a per-sample basis, which is critical for clinical interpretation.
Workflow and Conceptual Diagrams
The following diagrams illustrate the key experimental and analytical processes described in this protocol.
Clinical mNGS Validation Workflow
Sample-Specific LoD Determination
The clinical validation of mNGS assays requires a meticulous, multi-faceted approach that spans wet-lab procedures, bioinformatic analysis, and statistical modeling. By implementing the protocols outlined here—including the use of internal controls, standardized thresholds for detection, and a probability-based model for determining sample-specific LoD—researchers and clinical laboratory scientists can robustly characterize assay performance. This rigorous foundation is essential for integrating mNGS into the clinical diagnostic arsenal, ultimately fulfilling its potential to revolutionize the diagnosis of complex infectious diseases and microbial community analysis.
Metagenomics has revolutionized microbial community analysis, enabling researchers to explore genetic material recovered directly from environmental or clinical samples without the need for cultivation. The selection of an appropriate sequencing platform is a critical first step in experimental design, as it directly impacts the resolution, depth, and accuracy of microbial community characterization. Illumina and Oxford Nanopore Technologies (ONT) represent two dominant but fundamentally different sequencing technologies, each with distinct strengths and limitations for metagenomic applications [90]. While Illumina is renowned for its high accuracy and cost-effectiveness for large-scale projects, ONT offers the advantage of long reads that can span repetitive regions and facilitate genome assembly [91].
The emergence of targeted enrichment approaches has further expanded the methodological toolbox, allowing researchers to focus sequencing efforts on specific genomic regions or microbial taxa of interest. These techniques are particularly valuable for analyzing complex samples where pathogenic or low-abundance microorganisms would otherwise be obscured by host DNA or dominant community members [92]. By combining selective enrichment with advanced sequencing technologies, scientists can achieve unprecedented sensitivity in pathogen detection and functional characterization of microbial communities.
This application note provides a comprehensive comparison of Illumina and Oxford Nanopore platforms, along with targeted enrichment methods, specifically framed within the context of metagenomics for microbial community analysis research. We present structured experimental protocols, performance metrics, and practical guidance to assist researchers, scientists, and drug development professionals in selecting and implementing optimal sequencing strategies for their specific research objectives.
Technology Comparison: Illumina vs. Oxford Nanopore
Fundamental Technological Differences
Illumina and Oxford Nanopore Technologies employ fundamentally distinct approaches to DNA sequencing. Illumina utilizes sequencing-by-synthesis technology with reversible dye-terminators, generating massive amounts of short reads with high accuracy [93] [94]. This platform requires library preparation that involves DNA fragmentation, adapter ligation, and cluster generation through bridge amplification on a flow cell surface. In contrast, Oxford Nanopore technology is based on measuring changes in electrical current as DNA molecules pass through protein nanopores, producing long reads in real-time without the need for amplification [95] [91]. This fundamental difference in detection methodology creates a complementary relationship between the two platforms, with each offering unique advantages for metagenomic applications.
The workflow and output characteristics differ significantly between these platforms. Illumina sequencing occurs through cyclic reversible termination, where fluorescently labeled nucleotides are incorporated and imaged in each cycle, typically producing paired-end reads of 150-300 bp [94]. Oxford Nanopore sequencing, however, measures the disruption in ionic current as single-stranded DNA passes through a nanopore, with read lengths limited only by the integrity of the DNA molecule – often exceeding 10,000 bp and reaching up to 1 Mbp with optimized protocols [90]. This capacity for ultra-long reads makes ONT particularly valuable for resolving complex genomic regions, assembling complete genomes, and detecting structural variations in metagenomic samples.
Performance Metrics and Applications
Table 1: Technical Specifications and Performance Metrics of Sequencing Platforms
| Parameter | Illumina MiSeq | Illumina iSeq 100 | Oxford Nanopore PromethION 2 |
|---|---|---|---|
| Max Output | 15 Gb | 1.2 Gb | Not specified (High-output device) |
| Run Time | ~4-24 hours | ~9-17 hours | Real-time data streaming |
| Max Read Length | 2 × 300 bp | 2 × 300 bp | >10,000 bp (up to 1 Mbp reported) |
| Key Metagenomics Applications | Small WGS (microbe, virus), 16S metagenomic sequencing, metagenomic profiling | Small WGS, targeted gene sequencing, 16S metagenomic sequencing | Enhanced genome assemblies, complete circular genomes, real-time pathogen identification |
| Accuracy (Q-score) | >70% bases at Q30 (1/1000 error rate) [90] | Not specified | R10.4: Improved over R9.4.1; ~7-49% bases at Q15 (1/50 error rate) [90] |
| Strengths | High base-level accuracy, established workflows, high throughput | Compact system, rapid turnaround, cost-effective for small projects | Long reads, real-time analysis, direct epigenetic detection, portability |
For metagenomic studies, Illumina platforms typically provide higher base-level accuracy, with >70% of bases reaching Q30 (1/1000 error probability) compared to Oxford Nanopore's earlier flow cells (R9.4.1) which had lower accuracy, though the newer R10.4 flow cells have shown significant improvement [90]. However, ONT's long reads enable more complete genome assemblies from complex metagenomic samples, with studies demonstrating the ability to assemble bacterial chromosomes to near closure and fully resolve virulence plasmids that are challenging with short-read technologies alone [90].
The applications best suited for each platform vary according to research goals. Illumina excels in 16S rRNA gene sequencing for taxonomic profiling, shotgun metagenomics requiring high single-nucleotide variant detection, and large-scale comparative studies where cost-effectiveness and high accuracy are priorities [93] [94]. Oxford Nanopore is particularly valuable for complete genome reconstruction from metagenomes, real-time pathogen identification, and hybrid assembly approaches that combine long reads with short-read polishing [90] [91]. Additionally, ONT can simultaneously detect base modifications and sequence variations in a single run, providing insights into epigenetic regulation within microbial communities without specialized sample preparation [95].
Targeted Enrichment Approaches in Metagenomics
Probe-Based Enrichment Strategies
Targeted enrichment methods have emerged as powerful tools to enhance the sensitivity of metagenomic sequencing, particularly for detecting low-abundance pathogens or specific functional genes in complex samples. Probe-based enrichment involves using labeled nucleic acid probes that hybridize to targeted sequences of interest, followed by capture and amplification of these regions before sequencing. This approach significantly increases the relative abundance of target sequences, improving detection limits and reducing sequencing costs by focusing resources on relevant genomic regions [92].
Two prominent probe-based strategies have demonstrated particular utility in microbial community analysis:
Molecular Inversion Probes (MIPs): These single-stranded DNA probes hybridize to target sequences, undergo a "gap-fill" reaction by DNA polymerase, and ligate to form circular molecules that can be amplified with universal primers. MIPs offer exceptional multiplexing capability, with studies demonstrating the ability to simultaneously target >10,000 different sequences, significantly outpacing conventional multiplex PCR panels [96]. This technology has been successfully applied to pathogen identification from clinical matrices, showing 96.7% genus-level concordance with reference methods on the Illumina platform and 90.3% on Oxford Nanopore [96].
Tiling RNA Probes: These typically consist of 120-nucleotide biotinylated RNA probes designed to tile across conserved regions of target pathogens. A recent study evaluating respiratory pathogen detection demonstrated that enrichment with such probe sets increased unique pathogen reads by 34.6-fold and 37.8-fold for Illumina DNA and cDNA sequencing, respectively, compared to standard metagenomic sequencing [92]. This substantial enrichment enabled detection of viruses like Influenza B and Human rhinovirus that were missed by non-enriched approaches.
Culturomics and Media-Based Enrichment
Beyond nucleic acid-based enrichment, culturomics represents a complementary approach that uses selective culture conditions to enrich for specific microbial taxa prior to sequencing. This method combines high-throughput cultivation with metagenomic analysis to selectively enrich taxa and functional capabilities of interest [97]. By modifying base media with specific compounds—including antibiotics, bioactive molecules, bile acids, or varying physicochemical conditions—researchers can create selective pressures that favor the growth of target microorganisms.
A recent landmark study demonstrated the power of this approach by evaluating 50 different growth modifications to enrich gut microbes [97] [98]. Key findings included:
- Media Additives: Compounds like caffeine enhanced taxa associated with healthier subjects (Lachnospiraceae, Oscillospiraceae, Ruminococcaceae), while specific bile acids like taurocholic acid increased culturability of spore-forming bacteria by up to 70,000-fold [97].
- Physicochemical Conditions: Variations in temperature, pH, oxygen availability, and media dilution significantly impacted microbial recovery, with certain conditions (e.g., histidine, vancomycin, caffeine) consistently associated with increased phylogenetic diversity across donors [97].
- Functional Enrichment: The approach successfully enriched strains harboring specific biochemical pathways, such as those involved in dopamine metabolism, demonstrating potential for targeting both taxonomic groups and functional capabilities [97].
This metagenome-guided culturomics approach provides a streamlined, scalable method for targeted enrichment that advances microbiome research by systematically evaluating how cultivation parameters influence gut microbial communities.
Experimental Protocols
Protocol 1: Probe-Based Enrichment for Respiratory Pathogen Detection
This protocol outlines the enriched metagenomic sequencing (eMS) workflow for respiratory pathogen detection, adapted from a recent clinical study [92]. The method utilizes biotinylated tiling RNA probes targeting 76 respiratory pathogens followed by sequencing on either Illumina or Oxford Nanopore platforms.
Table 2: Key Reagents and Resources for Probe-Based Enrichment
| Item | Specification | Purpose |
|---|---|---|
| Biotinylated Tiling Probes | 120nt RNA probes targeting conserved regions of respiratory pathogens | Selective enrichment of target sequences |
| Nucleic Acid Extraction Kit | Magnetic bead-based semi-automatic system (e.g., Chaotropic salt-based buffer with bead beating) | Comprehensive extraction of DNA and RNA from samples |
| Library Preparation Kit | Platform-specific (Illumina or ONT compatible) | Preparation of sequencing libraries |
| Capture Reagents | Streptavidin-coated magnetic beads | Binding and isolation of probe-target complexes |
| qPCR Assay | Panel targeting 31 respiratory pathogens | Validation and performance assessment |
Procedure:
Sample Lysis and Nucleic Acid Extraction:
- Perform sample lysis using chaotropic salt-based buffer in combination with bead beating.
- Extract total nucleic acids (TNA) using a magnetic bead-based semi-automatic system.
- Quantify extracted DNA/RNA and assess quality.
Library Preparation:
- For Illumina sequencing: Prepare libraries starting from DNA or RNA using manufacturer's protocols.
- For Oxford Nanopore sequencing: Prepare libraries using the Ligation Sequencing Kit according to manufacturer's instructions.
- Assess library quality and quantity using appropriate methods (e.g., fragment analyzer, Qubit).
Probe Hybridization and Capture:
- Combine libraries with biotinylated tiling RNA probes (1-2 μg total).
- Hybridize at 65°C for 16-24 hours in a thermal cycler.
- Add streptavidin-coated magnetic beads and incubate at room temperature for 30 minutes to capture probe-target complexes.
- Wash beads twice with wash buffer at 65°C for 15 minutes each.
- Elute captured libraries from beads using elution buffer.
Post-Capture Amplification:
- Amplify captured libraries using platform-specific universal primers (10-12 cycles of PCR).
- Purify amplified libraries using SPRI bead-based clean-up.
- Quantify final libraries and assess capture efficiency.
Sequencing:
- For Illumina: Sequence on NovaSeq or MiSeq platform using recommended cycles.
- For Oxford Nanopore: Load onto MinION or PromethION flow cell and sequence for 24-72 hours.
Data Analysis:
- Perform base calling and quality control (MinKNOW for ONT, bcl2fastq for Illumina).
- Classify reads taxonomically by alignment to reference databases (NT database, RVDB).
- Calculate reads per million (RPM) for each pathogen to assess enrichment efficiency.
Troubleshooting Notes:
- Low enrichment efficiency may indicate probe design issues or insufficient hybridization time.
- Library pooling may cause read misassignment; consider unique dual indexing and limit multiplexing level.
- For low biomass samples, increase input material and incorporate carrier DNA during hybridization.
Protocol 2: Metagenome-Guided Culturomics for Targeted Enrichment
This protocol describes a metagenome-guided culturomics approach for targeted enrichment of gut microbes, adapted from Armetta et al. (2025) [97] [98]. The method uses a modified commercial base medium with specific additives to selectively enrich taxa of interest.
Procedure:
Base Medium Preparation:
- Start with Gifu Anaerobic Medium (GAM) as base.
- Add supplements to enhance recovery of fastidious gut microbes:
- Hemin (final concentration: 5 μg/mL)
- Vitamin K1 (final concentration: 0.5 μg/mL)
- Antioxidant mixture (e.g., glutathione, ascorbic acid)
- Adjust pH to 6.8-7.0 if needed.
Media Modifications:
- Prepare 50 different growth modifications from six categories:
- Antibiotics: 12 antibiotics from different classes (e.g., vancomycin, clindamycin, ciprofloxacin)
- Compounds of Interest: Caffeine, capsaicin, urea, ethanol, sodium chloride, oxalate, aromatic amino acids
- Complex Carbohydrates: Pectin, inulin, xanthan gum, mucin
- Short-Chain Fatty Acids: Acetate, propionate, butyrate, valerate
- Bile Acids: Cholic acid, deoxycholic acid, taurocholic acid, glycocholic acid
- Physicochemical Conditions: Variations in temperature (30°C, 37°C), pH (4, 5, 7, 8.5), media dilution (10X), oxygen availability
- Add modifications to base medium at predetermined concentrations.
- Prepare 50 different growth modifications from six categories:
Inoculation and Cultivation:
- Inoculate plates with stool samples from donors (fresh or frozen).
- Spread 100-200 μL of diluted sample suspension onto each modified medium plate.
- Incubate anaerobically at appropriate temperatures for 48-72 hours.
Colony Harvesting and DNA Extraction:
- After incubation, scrape all colonies from each plate into PBS buffer.
- Extract genomic DNA using bead-beating and commercial DNA extraction kits.
- Quantify DNA and assess quality.
Whole-Metagenome Sequencing:
- Prepare sequencing libraries using Illumina-compatible kits.
- Sequence on Illumina platform (NovaSeq or MiSeq) to adequate depth (>5 million reads/sample).
- Include original stool samples for comparison.
Metagenomic Analysis:
- Process raw sequencing data (quality filtering, adapter removal).
- Perform taxonomic profiling using reference databases (e.g., mOTUs, GREENGENES).
- Compare taxonomic composition across modifications to identify enrichment patterns.
- Calculate phylogenetic diversity and richness for each modification.
Key Considerations:
- Include control samples (base medium without modifications) in each experiment.
- Optimize modification concentrations through pilot experiments.
- For functional enrichment, perform metagenomic assembly and gene annotation to identify metabolic pathways.
Comparative Performance Data
Platform Performance in Pathogen Detection
Recent studies have directly compared the performance of Illumina and Oxford Nanopore technologies for pathogen detection in complex samples. A comprehensive evaluation of both platforms for identifying bacterial, viral, and parasitic pathogens using Molecular Inversion Probes revealed distinct performance characteristics [96]. For bacterial pathogen identification directly from positive blood culture bottles, Illumina demonstrated 96.7% genus-level concordance with reference methods, compared to 90.3% for Oxford Nanopore. Both platforms successfully detected 18 viral and parasitic organisms from mock clinical samples at concentrations of 10^4 PFU/mL, with few exceptions. The study reported that Illumina sequencing generally exhibited greater read counts with lower percent mapped reads, though this did not affect the limits of detection compared with ONT sequencing.
In respiratory pathogen detection, a 2024 study evaluated standard metagenomic sequencing (sMS) versus enriched metagenomic sequencing (eMS) on both platforms [92]. The research demonstrated that enrichment significantly improved detection sensitivity, with the overall detection rate increasing from 73% to 85% after probe capture detected by Illumina. Enrichment with probe sets boosted the frequency of unique pathogen reads by 34.6-fold and 37.8-fold for Illumina DNA and cDNA sequencing, respectively. For RNA viruses specifically, standard metagenomic sequencing detected only 10 of 23 qPCR-positive hits, while enriched sequencing identified an additional 7 hits on Illumina and 6 hits on Nanopore, with 5 overlapping hits between platforms.
Genome Assembly and Typing Applications
The performance of sequencing platforms varies significantly for applications requiring complete genome assembly and high-resolution genotyping. A 2023 study systematically compared Illumina and Oxford Nanopore Technologies for genome analysis of highly pathogenic bacteria with stable genomes (Francisella tularensis, Bacillus anthracis, and Brucella suis) [90]. Key findings included:
- Assembly Quality: ONT produced ultra-long reads (peaking at ~16 kbp for F. tularensis) that allowed assembly of chromosomes to near closure and complete assembly of virulence plasmids, while Illumina produced short reads with higher sequencing accuracy.
- Flow Cell Improvements: ONT's flow cell version 10.4 improved sequencing accuracy over version 9.4.1, with the proportion of bases reaching Q15 (1 error in 50 bp) being up to six-fold higher for R10ONT compared to R9ONT.
- Genotyping Concordance: For F. tularensis, core-genome MLST (cgMLST) and core-genome SNP typing produced highly comparable results between Illumina and both ONT flow cell versions. For B. anthracis, only data from flow cell version 10.4 produced similar results to Illumina for high-resolution typing methods.
Table 3: Performance Comparison for High-Resolution Bacterial Genotyping
| Species | Illumina Performance | ONT R9.4.1 Performance | ONT R10.4 Performance |
|---|---|---|---|
| Francisella tularensis | High-resolution typing reference standard | Highly comparable to Illumina for cgMLST and cgSNP | Highly comparable to Illumina for cgMLST and cgSNP |
| Bacillus anthracis | High-resolution typing reference standard | Lower concordance with Illumina | Similar results to Illumina for both typing methods |
| Brucella suis | High-resolution typing reference standard | Larger differences compared to Illumina | Larger differences compared to Illumina |
The study concluded that combining data from ONT and Illumina for high-resolution genotyping is feasible for F. tularensis and B. anthracis, but not yet for B. suis, highlighting that performance is species-dependent even for bacteria with highly stable genomes [90].
Implementation Workflows
Comparative Analysis Workflow for Microbial Metagenomics
The following workflow diagram illustrates a recommended approach for comparing and integrating data from Illumina, Oxford Nanopore, and targeted enrichment methods in microbial metagenomics studies:
Diagram 1: Integrated Metagenomics Analysis Workflow
Targeted Enrichment Decision Pathway
For researchers considering targeted enrichment approaches, the following decision pathway helps select the appropriate strategy based on research goals and sample characteristics:
Diagram 2: Targeted Enrichment Strategy Selection
The comparative analysis of Illumina, Oxford Nanopore, and targeted enrichment approaches reveals a nuanced landscape for metagenomic studies of microbial communities. Illumina platforms offer established, high-accuracy sequencing that remains the gold standard for applications requiring precise variant detection and quantitative abundance measurements. Their high throughput and cost-effectiveness make them ideal for large-scale comparative studies and taxonomic profiling through 16S rRNA sequencing. Oxford Nanopore Technologies provides distinct advantages through long-read capabilities that enable more complete genome assemblies from complex metagenomes, real-time data analysis, and direct detection of epigenetic modifications. The technology's portability and flexibility further expand its utility for diverse research settings.
Targeted enrichment methods, including probe-based capture and culturomics approaches, significantly enhance the sensitivity of metagenomic sequencing for specific applications. Probe-based enrichment dramatically improves pathogen detection in high-background samples, while culturomics enables the targeted enrichment of specific taxonomic groups and functional capabilities through selective culture conditions. The integration of these enrichment strategies with appropriate sequencing platforms creates powerful workflows for addressing specific research questions in microbial community analysis.
For researchers designing metagenomic studies, the selection of sequencing and enrichment strategies should be guided by specific research objectives, sample characteristics, and analytical requirements. Hybrid approaches that leverage the complementary strengths of multiple platforms often provide the most comprehensive insights. As sequencing technologies continue to evolve, with improvements in accuracy, read length, and cost-effectiveness, the integration of these platforms will further advance our ability to decipher complex microbial communities in diverse environments.
Within the framework of metagenomics for microbial community analysis, the identification of biosynthetic gene clusters (BGCs) is merely the first step. The subsequent crucial phase is the functional validation of these BGCs to confirm their role in producing hypothesized natural products. Heterologous expression has emerged as a cornerstone technique for this validation, allowing researchers to express BGCs in genetically tractable host organisms that are easier to cultivate and manipulate than native producers [99] [100]. This approach is particularly vital for accessing the vast reservoir of cryptic or silent BGCs identified through metagenomic sequencing of complex microbial communities, which are either not expressed under laboratory conditions or are produced by uncultivable microorganisms [101] [102]. This Application Note provides detailed protocols and methodologies for the heterologous expression of BGCs, enabling researchers to bridge the gap between genetic potential and chemical reality in microbial community research.
Core Principles and Methodologies
BGC Capture and Prioritization Strategies
The initial stage of heterologous expression involves the efficient capture and prioritization of BGCs from metagenomic data or microbial genomes. Two complementary approaches have been developed to address the challenges of cloning numerous BGCs in parallel.
Multiplexed BGC Capture Using CONKAT-seq: This innovative method enables the parallel capture, detection, and evaluation of thousands of BGCs from a strain collection. The process begins with pooling microbial strains and constructing a large-insert clone library in a shuttle vector. The library is then compressed into plate-pools and well-pools for efficient screening. CONKAT-seq utilizes barcoded degenerate primers to specifically sequence biosynthetic genes (e.g., targeting adenylation and ketosynthase domains for NRPS and PKS systems, respectively). Through co-occurrence network analysis, it triangulates the positions of domains belonging to the same BGC within the library [101]. This approach has demonstrated a 72% success rate in recovering NRPS and PKS BGCs from source genomes and has enabled the interrogation of 70 large NRPS and PKS BGCs in heterologous hosts, with 24% of previously uncharacterized BGCs producing detectable natural products [101].
In Silico BGC Identification and Analysis: For sequenced genomes or metagenome-assembled genomes (MAGs), bioinformatic tools are indispensable for BGC prioritization. The antiSMASH (Antibiotics and Secondary Metabolite Analysis Shell) platform is the most widely employed tool for the genomic identification and analysis of BGCs [99] [102]. Following initial identification, sequence-based similarity networking using tools like BiG-SCAPE (Biosynthetic Gene Similarity Clustering and Prospecting Engine) allows for the comparison of BGCs against databases of characterized clusters, helping to prioritize those with novel features [102]. For a broader functional profiling of microbial communities, METABOLIC (METabolic And BiogeOchemistry anaLyses In miCrobes) can be employed to annotate metabolic pathways and biogeochemical transformations in genomes and communities, providing ecological context for the discovered BGCs [103] [104].
Table 1: Comparison of BGC Capture and Analysis Methods
| Method | Principle | Throughput | Key Advantage | Application Context |
|---|---|---|---|---|
| CONKAT-seq [101] | Random cloning followed by targeted sequencing & co-occurrence analysis | High (00s of BGCs) | Multiplexed capture of BGCs without prior genome sequence | Interrogating strain collections |
| antiSMASH [99] [102] | In silico prediction based on known biosynthetic motifs | Very High (genome-scale) | Comprehensive BGC annotation & preliminary classification | Analysis of sequenced genomes & MAGs |
| BiG-SCAPE [102] | Sequence similarity networking of predicted BGCs | High | Prioritizes novelty by comparing against known BGCs | BGC dereplication & novelty assessment |
| METABOLIC [103] [104] | Functional annotation of metabolic pathways & biogeochemical cycles | High (community-scale) | Places BGCs in context of community metabolism & ecology | Integrating BGCs into community functional models |
BGC Refactoring and Assembly Techniques
Many native BGCs are not readily expressed in heterologous hosts due to differences in regulatory elements. Refactoring—the process of replacing native regulatory sequences with well-characterized, orthogonal parts—is often essential for successful heterologous expression [100]. Several advanced DNA assembly techniques facilitate this process.
Modular Cloning (MoClo) Systems: Based on Golden Gate cloning using type IIs restriction enzymes, these systems enable the seamless assembly of multiple DNA fragments in a defined linear order. The MoClo system has been used to assemble constructs as large as 50 kb from 68 individual DNA fragments, making it suitable for refactoring large BGCs [99].
DNA Assembler: This method leverages the highly efficient in vivo homologous recombination mechanism in Saccharomyces cerevisiae (yeast) to assemble multiple overlapping DNA fragments in a single step. Its efficiency and fidelity have been significantly improved, allowing for the assembly of entire BGCs directly in yeast [99].
CRISPR-Based TAR (Transformation-Associated Recombination) Methods: Techniques such as mCRISTAR (multiplexed CRISPR-based TAR) and miCRISTAR (multiplexed in vitro CRISPR-based TAR) combine CRISPR/Cas9 with yeast homologous recombination. This allows for the targeted extraction of BGCs from genomic DNA and simultaneous promoter engineering for refactoring, enabling the activation of silent BGCs [100].
Promoter Engineering Strategies: A critical aspect of refactoring involves replacing native promoters with synthetic or heterologous promoters that function reliably in the chosen expression host. Recent advances include the development of completely randomized synthetic promoter libraries, such as those created for Streptomyces albus J1074, which provide a wide range of transcriptional strengths and high orthogonality to prevent homologous recombination [100]. Furthermore, mining metagenomic datasets for natural 5' regulatory elements has yielded promoter libraries with broad host ranges, applicable across diverse bacterial taxa [100].
The following diagram illustrates the core decision-making workflow for selecting and implementing a BGC capture and refactoring strategy.
Detailed Experimental Protocol
Protocol: Heterologous Expression of an NRPS BGC for Pyrazinone Production
The following detailed protocol is adapted from a recent successful study that identified and expressed the biosynthetic gene cluster for ichizinones A, B, and C, trisubstituted pyrazinone compounds with structural similarity to JBIR-56 and JBIR-57 [105].
Identification and Cloning of the Target BGC
- Bioinformatic Identification: Perform a whole-genome sequence of the producer strain (e.g., Streptomyces sp. LV45-129). Analyze the genome sequence using antiSMASH to identify candidate NRPS/PKS BGCs.
- Cosmid Library Construction: Isolate high-molecular-weight genomic DNA from the producer strain. Partially digest the DNA with an appropriate restriction enzyme (e.g., Sau3AI) and size-fractionate fragments of 30-40 kb. Ligate the fragments into a cosmid shuttle vector (e.g., pACS-based vector) that replicates in both E. coli and Streptomyces. Package the ligation mix using a commercial phage packaging extract and transduce into E. coli to create the library.
- Library Screening: Screen the cosmid library using PCR with primers designed to target conserved regions of the identified BGC. Alternatively, for CONKAT-seq-based approaches, follow the pooling, amplification, and sequencing workflow to identify clones carrying the complete BGC of interest [101].
- Cosmid Isolation: Isinate the positive cosmid clone (e.g., E514 for the ichizinone BGC) from E. coli using a commercial BAC/DNA purification kit.
Heterologous Expression inStreptomyces albus
- Host Preparation: Cultivate the heterologous host Streptomyces albus Del14 (or J1074/RedStrep) in 25 mL of Tryptic Soy Broth (TSB) in a baffled flask for 24-48 hours at 28-30°C, 220 rpm, to generate a pre-culture.
- Intergeneric Conjugation:
- Optional for refactoring: If promoter replacement is required, utilize methods like mCRISTAR for multiplexed promoter engineering within the cosmid while in yeast, then shuttle the refactored cosmid to E. coli [100].
- Transform the cosmid into a non-methylating E. coli strain (e.g., ET12567) containing the pUZ8002 plasmid to enable conjugation.
- Harvest E. coli cells containing the cosmid and pUZ8002 during mid-log phase (OD600 ~0.4-0.6). Wash to remove antibiotics.
- Harvest S. albus spores or mycelia from the pre-culture.
- Mix E. coli and S. albus cells in a 1:1 to 10:1 ratio, pellet, and resuspend in a small volume. Plate the mixture on SFM (Soya Flour Mannitol) agar and incubate at 28°C for 16-20 hours.
- Overlay the plates with sterile water containing nalidixic acid (to counter-select against E. coli) and the appropriate antibiotic (e.g., apramycin) to select for S. albus exconjugants containing the cosmid.
- Incubate plates for 3-7 days until exconjugant colonies appear.
Metabolite Production and Analysis
- Fermentation: Inoculate 1 mL of a TSB seed culture of the positive exconjugant into 100 mL of DNPM production medium (40 g/L dextrin, 7.5 g/L soytone, 5 g/L baking yeast, 21 g/L MOPS, pH 6.8) in a baffled flask. Incubate at 28°C for 5-7 days at 220 rpm [105].
- Metabolite Extraction: Separate the culture broth by centrifugation. Extract the supernatant with an equal volume of 1-butanol. Concentrate the organic layer in vacuo using a rotary evaporator and redissolve the residue in methanol for analysis.
- LC-MS Analysis:
- Instrument: Use a UPLC system coupled to a high-resolution mass spectrometer (e.g., Bruker maXis QTOF).
- Column: ACQUITY UPLC BEH C18 column (1.7 μm, 100 mm × 2.1 mm).
- Gradient: Employ a linear gradient from 5% to 95% acetonitrile (with 0.1% formic acid) against water (with 0.1% formic acid) over 18 minutes at a flow rate of 0.6 mL/min.
- Detection: Acquire data in positive electrospray ionization (ESI+) mode. Compare the chromatograms of the exconjugant strain to the wild-type S. albus host to identify unique mass features corresponding to the heterologously produced compound (e.g., Ichizinone A, m/z 423.2597 [M+H]+) [105].
Table 2: Key Parameters for Heterologous Expression and Metabolite Analysis
| Protocol Step | Key Reagents/Components | Conditions | Success Metrics / Expected Outcome |
|---|---|---|---|
| BGC Cloning | Cosmid vector (e.g., pACS), Packaging extract, E. coli host | Sau3AI partial digest, Ligation at 16°C overnight | Library with >10,000 clones, average insert >30 kb |
| Host Preparation | Tryptic Soy Broth (TSB), S. albus Del14 or J1074 | 28-30°C, 220 rpm, 24-48 hrs | Healthy, dispersed mycelial growth |
| Conjugation | SFM Agar, Nalidixic acid, Apramycin | 28°C, 16-20 hrs before overlay | Appearance of exconjugant colonies in 3-7 days |
| Production Fermentation | DNPM Medium (Dextrin, Soytone, Yeast, MOPS) | 28°C, 220 rpm, 5-7 days | Visible change in culture pigmentation/viscosity |
| Metabolite Extraction | 1-Butanol, Methanol | Centrifugation, Liquid-liquid extraction | Concentrated, MS-compatible extract |
| LC-MS Analysis | C18 UPLC column, Water/Acetonitrile + 0.1% FA | 18 min gradient, ESI+ MS | Detection of unique ions ([M+H]+) not present in control |
Protocol: Multiplexed BGC Interrogation
For projects aiming to characterize multiple BGCs simultaneously, a scaled-up protocol is recommended [101].
- Strain Pooling and Library Construction: Pool biomass from up to 100 microbial strains. Extract high-molecular-weight DNA and clone it into a PAC or BAC shuttle vector to generate a single, complex large-insert library in E. coli. Array the library in a multi-well format.
- CONKAT-seq Screening: Compress the library into plate-pools and well-pools. Perform PCR amplification on these pools using barcoded degenerate primers targeting conserved biosynthetic domains (e.g., A and KS domains). Sequence the amplicons and use co-occurrence network analysis (e.g., Fisher's exact test) to identify wells containing all domains of a single BGC.
- Heterologous Expression in Multiple Hosts: Transfer each PAC/BAC clone containing a full BGC into a panel of optimized heterologous hosts, such as Streptomyces albus J1074 and Streptomyces lividans RedStrep, via intergeneric conjugation or protoplast transformation.
- Comparative Metabolomics: Ferment each exconjugant in appropriate production media. Extract metabolites and analyze by LC-MS. Use comparative metabolomics software to identify mass features unique to each BGC-containing strain when compared to a dataset of control strains harboring other BGCs.
Table 3: Key Research Reagent Solutions for Heterologous Expression
| Reagent / Resource | Function / Description | Example Products / Strains |
|---|---|---|
| Shuttle Vectors | Cloning and transfer of large DNA inserts between E. coli and actinomycetes; often contain integration elements for chromosomal insertion. | pACS-based cosmids, PAC vectors, BAC vectors [101] [105] |
| Heterologous Hosts | Genetically tractable, fast-growing microbial strains optimized for expression of secondary metabolites; often possess minimized native metabolomes. | Streptomyces albus J1074, S. albus Del14, Streptomyces lividans RedStrep [101] [100] [105] |
| Bioinformatics Tools | In silico identification, annotation, and comparative analysis of BGCs. | antiSMASH [99] [102], BiG-SCAPE [102], METABOLIC [103] [104] |
| Production Media | Nutritionally rich or defined media designed to support high cell density and stimulate secondary metabolite production. | DNPM Medium [105], R5 Medium, SFM Medium |
| DNA Assembly Systems | Molecular tools for refactoring and assembling large DNA constructs, often involving promoter replacements. | MoClo [99], DNA Assembler [99], mCRISTAR/miCRISTAR [100] |
Heterologous expression remains the most robust method for functionally validating the metabolic potential encoded within BGCs discovered through metagenomic studies of microbial communities. The integration of multiplexed capture technologies like CONKAT-seq with efficient refactoring strategies and a panel of well-engineered heterologous hosts creates a powerful pipeline for translating genetic blueprints into characterized natural products. This approach is instrumental in overcoming the challenges of silent BGC expression and uncultivable microorganisms, thereby unlocking the full potential of microbial communities as sources of novel bioactive compounds for therapeutic and industrial applications. The standardized protocols and resources detailed in this Application Note provide a clear roadmap for researchers to systematically access and characterize this hidden chemical diversity.
The holistic understanding of complex microbial communities requires more than a catalog of resident species; it demands insights into their functional activities and expressed proteins. The independent application of metagenomics, metatranscriptomics, and metaproteomics provides valuable but fragmented biological insights. The integration of these multi-omics data layers offers a powerful, unified framework to bridge the gap between microbial genetic potential (metagenome) and its functional expression (metatranscriptome and metaproteome) [106] [107]. This approach simultaneously reveals the structure of a microbiome and its dynamic biochemical functions, enabling a systems-level understanding of microbial communities in diverse environments from the human gut to engineered ecosystems [106] [108]. Such integration is particularly valuable for drug development professionals investigating host-microbe interactions, identifying therapeutic targets, and understanding microbiome-associated disease mechanisms. This protocol details comprehensive methodologies for correlating these omics layers, providing researchers with standardized workflows for generating and integrating multi-omics datasets to uncover previously inaccessible biological relationships within microbial systems.
Successful multi-omics integration begins with meticulous experimental design that ensures sample integrity and compatibility across different molecular analyses. The fundamental requirement involves collecting parallel samples from the same sampling event for concurrent metagenomic, metatranscriptomic, and metaproteomic analyses [106]. This synchronous sampling strategy minimizes temporal variation and enables genuine correlation between community genetic potential, gene expression patterns, and protein synthesis activities.
Table 1: Key Considerations for Multi-Omics Experimental Design
| Design Factor | Recommendation | Rationale |
|---|---|---|
| Sample Synchronization | Collect samples for all omics layers simultaneously from the same biological source | Ensures data reflects the same microbial community state |
| Replication | Minimum of 5 biological replicates per condition | Provides statistical power for robust correlation analysis |
| Sample Preservation | Immediate stabilization using RNAlater (RNA) and flash-freezing (DNA/proteins) | Preserves nucleic acid and protein integrity |
| Metadata Collection | Document extensive environmental, clinical, or processing parameters | Enables normalization for technical covariates in integrated analysis |
The complete workflow encompasses sample preparation, domain-specific laboratory processing, computational analysis, and data integration, as visualized below.
Detailed Experimental Protocols
Sample Collection and Nucleic Acid Extraction
Proper sample collection and processing are critical for preserving the integrity of different molecular fractions. Consistent handling across all samples ensures comparable results across omics layers.
Protocol 3.1.1: Simultaneous Biomass Collection for Multi-Omics Analysis
- Sample Collection: Process fresh samples immediately after collection. For microbial communities in environmental matrices (water, soil), concentrate cells via filtration (0.22 µm pore size) or centrifugation (8,000 × g, 10 min, 4°C).
- Biomass Division: Split concentrated biomass into three aliquots for DNA, RNA, and protein extraction.
- DNA Preservation: Preserve one aliquot at -80°C for DNA extraction or use commercial stabilization buffers.
- RNA Preservation: Preserve the second aliquot in RNAlater solution for RNA stabilization, incubating overnight at 4°C before transfer to -80°C.
- Protein Preservation: Flash-freeze the third aliquot in liquid nitrogen and store at -80°C for protein analysis.
Protocol 3.1.2: Optimized DNA Extraction for Metagenomic Sequencing Multiple DNA extraction methods exist, with significant variations in yield, quality, and microbial representation. Based on comparative studies:
Table 2: Performance Comparison of DNA Extraction Methods
| Extraction Kit | Average Yield (ng/µL) | DNA Quality (A260/280) | Host DNA Contamination | Suitability for LRS |
|---|---|---|---|---|
| Zymo Research Quick-DNA HMW MagBead | 45.2 ± 3.1 | 1.89 ± 0.04 | Low | Excellent |
| Macherey-Nagel NucleoSpin Soil | 68.5 ± 8.2 | 1.82 ± 0.07 | Low | Good |
| Invitrogen PureLink Microbiome | 52.3 ± 10.5 | 1.85 ± 0.09 | Moderate | Good |
| Qiagen DNeasy PowerSoil | 22.7 ± 5.3 | 1.75 ± 0.12 | High | Poor |
Based on this comparative data [109], the recommended procedure uses the Zymo Research Quick-DNA HMW MagBead Kit:
- Resuspend biomass in 500 µL of HMW MagBead Lysis Buffer with 50 µL of Proteinase K.
- Incubate at 55°C for 30 minutes with intermittent vortexing.
- Add 500 µL of HMW Binding Buffer and mix thoroughly.
- Bind DNA to magnetic beads for 5 minutes, then wash twice with HMW Wash Buffer.
- Elute DNA in 50 µL of nuclease-free water.
- Quantify using Qubit fluorometer and assess quality via Fragment Analyzer or Bioanalyzer.
Protocol 3.1.3: RNA Extraction for Metatranscriptomics
- Use ZymoBIOMICS RNA Miniprep Kit or similar with these modifications for complete lysis:
- Add lysozyme (10 mg/mL final concentration) to the lysis buffer for Gram-positive bacteria.
- Include bead-beating step (0.1 mm zirconia/silica beads) for 3 × 45 seconds with cooling on ice between cycles.
- Perform on-column DNase I digestion (15 minutes at room temperature).
- Elute in 30 µL nuclease-free water.
- Assess RNA integrity using RNA Integrity Number (RIN) >7.0 on Bioanalyzer.
Library Preparation and Sequencing
Protocol 3.2.1: Metagenomic Library Preparation For Illumina short-read sequencing:
- Use Illumina DNA Prep Kit following manufacturer's instructions.
- Fragment 100 ng DNA to ~350 bp using acoustic shearing (Covaris).
- Perform end repair, A-tailing, and adapter ligation with unique dual indices.
- Clean up with sample purification beads and PCR-amplify (8 cycles).
- Validate library quality using Fragment Analyzer.
For long-read sequencing (PacBio/Nanopore):
- Use Zymo Research HMW DNA with minimal fragmentation.
- For PacBio: Prepare SMRTbell library with Express Template Prep Kit 2.0.
- For Nanopore: Prepare library using Ligation Sequencing Kit with native barcoding.
Protocol 3.2.2: Metatranscriptomic Library Preparation
- Deplete ribosomal RNA using Illumina Ribo-Zero Plus or similar.
- Convert 100 ng rRNA-depleted RNA to cDNA using NEBNext Ultra II RNA First Strand.
- Synthesize second strand and convert to double-stranded cDNA.
- Proceed with library preparation as in Protocol 3.2.1.
Metaproteomic Sample Processing
Protocol 3.3.1: Protein Extraction and Digestion
- Resuspend frozen cell pellet in 500 µL lysis buffer (4% SDS, 100 mM Tris-HCl pH 8.0, protease inhibitors).
- Lyse cells by sonication (3 × 15 sec pulses, 30% amplitude) with cooling on ice.
- Centrifuge at 16,000 × g for 10 minutes to remove debris.
- Quantify protein using BCA assay.
- Digest 50 µg protein using filter-aided sample preparation (FASP):
- Reduce with 10 mM DTT (30 min, 60°C)
- Alkylate with 50 mM iodoacetamide (30 min, dark)
- Digest with trypsin (1:50 enzyme:protein) overnight at 37°C
- Desalt peptides using C18 StageTips and dry in vacuum concentrator.
Protocol 3.3.2: LC-MS/MS Analysis
- Reconstitute peptides in 2% acetonitrile/0.1% formic acid.
- Separate on nanoLC system (C18 column, 75 µm × 25 cm, 2 µm particles).
- Use 120-min gradient from 5% to 30% acetonitrile in 0.1% formic acid.
- Analyze on timsTOF Pro or Orbitrap mass spectrometer:
- MS1 resolution: 60,000
- Data-dependent MS2 (top 20) or data-independent acquisition (DIA)
Computational Analysis and Data Integration
Domain-Specific Bioinformatics
Protocol 4.1.1: Metagenomic Data Analysis
- Quality Control: Use FastQC and Trimmomatic to remove adapters and low-quality bases.
- Host DNA Depletion: Map reads to host genome (human, dog, etc.) using Minimap2 and retain unmapped reads.
- Assembly: Perform de novo co-assembly of all samples using MEGAHIT or metaSPAdes.
- Gene Prediction: Identify open reading frames on contigs using Prodigal.
- Taxonomic Profiling: Use Kraken2 or sourmash with standardized databases.
Table 3: Performance Comparison of Metagenomic Classification Tools
| Tool | Algorithm Type | Read-Level Accuracy | Relative Speed | RAM Usage |
|---|---|---|---|---|
| Minimap2 | General-purpose mapper | 94.2% | Medium | Medium |
| Ram | General-purpose mapper | 92.8% | Medium | Medium |
| MetaMaps | Mapping-based | 91.5% | Slow | High |
| Kraken2 | kmer-based | 87.3% | Fast | Medium |
| Kaiju | Protein-based | 76.1% | Fast | Low |
Protocol 4.1.2: Metatranscriptomic Data Analysis
- Follow steps 1-2 from Protocol 4.1.1 for quality control.
- Map quality-filtered reads to metagenomic assembly using Bowtie2 or STAR.
- Quantify transcript abundance using featureCounts or HTSeq.
- Normalize counts using TPM (Transcripts Per Million).
Protocol 4.1.3: Metaproteomic Data Analysis
- Database Construction: Create a sample-specific protein database from metagenomic gene calls.
- Peptide Identification: Search MS/MS spectra against database using MaxQuant or FragPipe.
- Protein Inference: Group peptides to proteins using FDR threshold of 1%.
- Quantification: Use LFQ intensity or spectral counting for relative quantification.
Multi-Omics Data Integration
Protocol 4.2.1: The MetaPUF Workflow for Data Integration The MetaPUF workflow enables systematic integration of multi-omics datasets [106] [107]:
Database Creation:
- Build sample-specific protein search databases from metagenomic assemblies
- Include gene calls from metatranscriptomic assemblies when available
- Create comprehensive database with all predicted proteins
Data Processing:
- Re-analyze metaproteomic data against sample-specific databases
- Perform taxonomic and functional annotation of all omics datasets
- Generate normalized abundance tables for genes, transcripts, and proteins
MGnify Integration:
- Upload processed datasets to MGnify database
- Use enhanced MGnify visualization features for cross-omics data exploration
- Correlate taxonomic profiles with functional expression data
The data integration workflow is implemented as follows:
Protocol 4.2.2: Correlation Analysis Across Omics Layers
- Data Normalization: Normalize abundance values across datasets using variance-stabilizing transformation.
- Taxonomic Binning: Aggregate features by taxonomic assignment at species level.
- Functional Profiling: Map genes to KEGG orthology groups or enzyme commission numbers.
- Correlation Calculation: Compute Spearman correlations between metagenomic abundance, transcript levels, and protein expression.
- Pathway Analysis: Identify metabolic pathways with significant correlations across omics layers.
The Scientist's Toolkit
Table 4: Essential Research Reagents and Computational Resources
| Category | Item | Specification/Example | Primary Function |
|---|---|---|---|
| DNA Extraction | Zymo Research Quick-DNA HMW MagBead Kit | Catalog No. D6064 | High-quality DNA extraction for long-read sequencing |
| RNA Stabilization | RNAlater Stabilization Solution | Thermo Fisher Scientific AM7020 | Preserves RNA integrity during sample storage |
| rRNA Depletion | Illumina Ribo-Zero Plus rRNA Depletion Kit | 20037135 | Removes ribosomal RNA for metatranscriptomics |
| Library Prep | Illumina DNA Prep Kit | 20018704 | Efficient library construction for shotgun sequencing |
| Protein Digestion | Trypsin, Sequencing Grade | Promega V5111 | Specific proteolytic cleavage for mass spectrometry |
| LC-MS/MS | C18 Reverse Phase Columns | 1.9 µm beads, 75 µm i.d. | Peptide separation prior to mass spectrometry |
| Metagenomic Classifier | Kraken2 | N/A | Fast taxonomic classification of sequencing reads |
| Multi-Omics Database | MGnify | https://www.ebi.ac.uk/metagenomics/ | Repository and analysis platform for microbiome data |
| Mass Spectrometry Repository | PRIDE Database | https://www.ebi.ac.uk/pride/ | Public repository for mass spectrometry-based proteomics data |
| Integration Workflow | MetaPUF | https://github.com/PRIDE-reanalysis/MetaPUF | Computational workflow for multi-omics data integration |
Application Notes and Technical Validation
Performance Assessment
The integrated multi-omics approach has been technically validated in studies of human gut and marine hatchery samples [106]. Key performance metrics include:
- Database Search Efficiency: Sample-specific protein databases derived from metagenomic assemblies yielded the highest number of peptide identifications (15-30% increase compared to generic databases) [106].
- Taxonomic Resolution: Integration of metagenomic and metatranscriptomic data improved taxonomic classification accuracy by 12-18% compared to single-omics approaches.
- Functional Insights: Correlation analysis revealed that 68% of highly expressed genes (metatranscriptomics) showed corresponding protein detection, while 32% showed discordance suggesting post-transcriptional regulation.
Troubleshooting Guide
Table 5: Common Technical Challenges and Solutions
| Problem | Potential Cause | Solution |
|---|---|---|
| Low DNA yield from Gram-positive bacteria | Inefficient cell lysis | Incorporate bead-beating with 0.1mm zirconia/silica beads |
| High host DNA contamination | Inefficient microbial enrichment | Implement differential centrifugation or filtration steps |
| Poor correlation between transcript and protein levels | Biological regulation or technical issues | Check protein extraction efficiency; consider post-transcriptional regulation |
| Limited protein identifications | Non-specific database | Use sample-specific database from metagenomic data [106] |
| Discordant taxonomic profiles between omics | Technical bias or rRNA removal | Validate with mock communities; check rRNA depletion efficiency |
Applications in Drug Development
For pharmaceutical researchers, this integrated multi-omics approach enables:
- Mechanistic Insights: Uncover how microbial communities respond to therapeutic interventions at multiple molecular levels.
- Biomarker Discovery: Identify correlated molecular signatures across omics layers as potential diagnostic or prognostic biomarkers.
- Target Identification: Reveal consistently expressed microbial functions across genetic, transcriptional, and protein levels as potential therapeutic targets.
- Toxicology Assessment: Understand off-target effects of drug candidates on human microbiomes through comprehensive molecular profiling.
The integration of metagenomics, metatranscriptomics, and metaproteomics provides an unprecedented multidimensional view of microbial communities, enabling researchers to distinguish between microbial functional potential and actual biochemical activities. The standardized protocols presented here offer a robust framework for generating and integrating multi-omics datasets, with particular relevance for pharmaceutical scientists investigating host-microbiome interactions in health and disease.
Conclusion
Metagenomics has fundamentally transformed our approach to microbial community analysis, providing unprecedented insights into microbial diversity, function, and their implications for human health and disease. The integration of robust sequencing methodologies, advanced bioinformatics tools, and standardized validation frameworks positions metagenomics as an indispensable technology for pharmaceutical development and clinical diagnostics. Future directions will likely focus on overcoming current computational limitations through artificial intelligence, expanding the discovery of novel therapeutics from uncultured microbes, and establishing metagenomics as a routine clinical tool for personalized medicine and pandemic preparedness. As standardization improves and costs decrease, metagenomics will increasingly bridge the gap between environmental microbiology and clinical practice, enabling a more comprehensive understanding of microbial ecosystems in health and disease.
References
- 1. Metagenomics: An Effective Approach for Exploring ... [https://pmc.ncbi.nlm.nih.gov/articles/PMC10252221/]
- 2. Development of a quantitative metagenomic approach to ... [https://pmc.ncbi.nlm.nih.gov/articles/PMC11878531/]
- 3. Metagenomic Sequencing Data: Step-by-Step Guide From ... [https://www.cd-genomics.com/resource-how-analyze-metagenomic-sequencing-data.html]
- 4. Decoding the Biosphere: Advances in Environmental DNA ... [https://www.neb.com/en-us/events/decoding-the-biosphere-symposium-2025?srsltid=AfmBOoouBIKJe5z1b8zlB9oXJyhUHAhb2TBqbDyRdbXzjBeZ1cJxyfP5]
- 5. Enhanced metagenomic strategies for elucidating the ... [https://www.frontiersin.org/journals/microbiology/articles/10.3389/fmicb.2025.1626002/full]
- 6. Guidelines for preventing and reporting contamination in ... [https://www.nature.com/articles/s41564-025-02035-2]
- 7. Predicting microbial community structure and temporal ... [https://www.nature.com/articles/s41467-025-64175-7]
- 8. Metagenomics - a guide from sampling to data analysis - PMC [https://pmc.ncbi.nlm.nih.gov/articles/PMC3351745/]
- 9. Metagenomics as a Transformative Tool for Antibiotic ... [https://pmc.ncbi.nlm.nih.gov/articles/PMC11939754/]
- 10. Metagenomic analysis of human, animal, and ... [https://www.nature.com/articles/s41598-025-90777-8]
- 11. Deciphering the antimicrobial resistomes and microbiome ... [https://www.sciencedirect.com/science/article/abs/pii/S001393512502540X]
- 12. Resistome profiling and bacterial community structure of ... [https://www.nature.com/articles/s41598-025-20043-4]
- 13. Overcoming challenges in metagenomic AMR surveillance ... [https://www.frontiersin.org/journals/microbiology/articles/10.3389/fmicb.2025.1614301/full]
- 14. ResistoXplorer: a web-based tool for visual, statistical and ... [https://pmc.ncbi.nlm.nih.gov/articles/PMC7991225/]
- 15. AMRViz enables seamless genomics analysis and ... [https://bmcbioinformatics.biomedcentral.com/articles/10.1186/s12859-024-05792-9]
- 16. cost-effective antibiotic resistome profiling of metagenomic ... [https://pubmed.ncbi.nlm.nih.gov/40019273/?utm_source=FeedFetcher&utm_medium=rss&utm_campaign=None&utm_content=1F9sM2NQANFmLi9huljY4jEJuDZBPy7jc4pX-dgaFI9ivVeQ9&fc=None&ff=20251124175458&v=2.18.0.post22+67771e2]
- 17. Growing Unculturable Bacteria - PMC [https://pmc.ncbi.nlm.nih.gov/articles/PMC3416243/]
- 18. Hunting for Antibiotics in Unusual and Unculturable Microbes [https://asm.org/articles/2023/june/hunting-for-antibiotics-in-unusual-and-unculturabl]
- 19. Metagenomics: Application of Genomics to Uncultured ... [https://pmc.ncbi.nlm.nih.gov/articles/PMC539003/]
- 20. Culturing of “Unculturable†Subsurface Microbes: Natural ... [https://www.frontiersin.org/journals/microbiology/articles/10.3389/fmicb.2020.610001/full]
- 21. The Uncultured Microorganisms: Novel Technologies and ... [https://www.frontiersin.org/journals/microbiology/articles/10.3389/fmicb.2021.756287/full]
- 22. Genome-resolved long-read sequencing expands known ... [https://www.nature.com/articles/s41564-025-02062-z]
- 23. Obtaining high-quality draft genomes from uncultured ... [https://www.nature.com/articles/s41598-018-20384-3]
- 24. Opportunities and challenges of using metagenomic data to ... [https://microbiomejournal.biomedcentral.com/articles/10.1186/s40168-022-01272-5]
- 25. Whole-genome sequencing of unculturable bacterium ... [https://pubmed.ncbi.nlm.nih.gov/21431760/]
- 26. Inferring microbial interactions with their environment from ... [https://pmc.ncbi.nlm.nih.gov/articles/PMC10681327/]
- 27. Metabolic modeling of host-microbe interactions [https://www.sciencedirect.com/science/article/pii/S2001037025004076]
- 28. Breaking the reproducibility barrier with standardized ... [https://journals.plos.org/plosbiology/article?id=10.1371/journal.pbio.3003358]
- 29. Mapping total microbial communities and waterborne ... [https://www.frontiersin.org/journals/microbiology/articles/10.3389/fmicb.2025.1609070/full]
- 30. Targeted Sequencing vs. Shotgun Metagenomics [https://pathogenomix.com/pathogenomix_targeted_sequencing.aspx]
- 31. Unravel Your Metagenomic Sample - Shotgun Sequencing ... [https://cegat.com/unravel-your-metagenomic-sample-shotgun-sequencing-vs-16s-sequencing/]
- 32. 16S rRNA Gene Sequencing vs. Shotgun Metagenomic ... [https://blog.microbiomeinsights.com/16s-rrna-sequencing-vs-shotgun-metagenomic-sequencing]
- 33. Consistent microbial insights across sequencing methods ... [https://pmc.ncbi.nlm.nih.gov/articles/PMC12282176/]
- 34. Four therapeutic frontiers opened up by strain-level ... [https://www.ddw-online.com/four-therapeutic-frontiers-opened-up-by-strain-level-microbiome-sequencing-37596-202510/]
- 35. Shotgun metagenomics sequencing [https://eu.idtdna.com/pages/applications/infectious-disease/shotgun-metagenomics-for-infectious-diseases]
- 36. Comparison of metagenomic and targeted methods for ... [https://pmc.ncbi.nlm.nih.gov/articles/PMC10746264/]
- 37. Application of shotgun metagenomics sequencing and ... [https://pmc.ncbi.nlm.nih.gov/articles/PMC9540031/]
- 38. Sequencing-based methods and resources to study ... [https://pmc.ncbi.nlm.nih.gov/articles/PMC6525649/]
- 39. Functional and sequence-based metagenomics to uncover ... [https://pmc.ncbi.nlm.nih.gov/articles/PMC10390414/]
- 40. Functional and sequence-based metagenomics to uncover ... [https://pubmed.ncbi.nlm.nih.gov/37417976/]
- 41. Metagenomic insights into microbial community structure ... [https://www.nature.com/articles/s41467-024-50276-2]
- 42. Genomic insights into biosynthesis and adaptation in the ... [https://bmcmicrobiol.biomedcentral.com/articles/10.1186/s12866-025-04109-x]
- 43. Analytical techniques for discovery of bioactive compounds ... [https://www.sciencedirect.com/science/article/abs/pii/S0165993612000179]
- 44. Metagenomics-based analysis of microbial ... [https://www.frontiersin.org/journals/bioengineering-and-biotechnology/articles/10.3389/fbioe.2025.1638716/full]
- 45. MATRIX: a platform for cultivation profiling and bioactive ... [https://www.frontiersin.org/journals/natural-products/articles/10.3389/fntpr.2024.1532543/full]
- 46. A genomic catalogue of soil microbiomes boosts mining ... [https://www.nature.com/articles/s41467-023-43000-z]
- 47. Teixobactin, the first of a new class of antibiotics ... [https://pubmed.ncbi.nlm.nih.gov/26089440/]
- 48. Teixobactin - an overview [https://www.sciencedirect.com/topics/pharmacology-toxicology-and-pharmaceutical-science/teixobactin]
- 49. Teixobactin kills bacteria by a two-pronged attack on the ... [https://www.nature.com/articles/s41586-022-05019-y]
- 50. Gram-scale total synthesis of teixobactin promoting binding ... [https://pmc.ncbi.nlm.nih.gov/articles/PMC6646333/]
- 51. Comprehensive whole metagenomics analysis uncovers ... [https://pubmed.ncbi.nlm.nih.gov/41199948/]
- 52. One Vaccine Could Tackle Millions of Childhood Infections [https://www.technologynetworks.com/genomics/news/one-vaccine-could-tackle-millions-of-childhood-infections-406418]
- 53. Drug–Fc conjugate CD388 targets influenza virus ... [https://www.nature.com/articles/s41564-025-01955-3]
- 54. Microbiome–Immune Interaction and Harnessing for Next- ... [https://pmc.ncbi.nlm.nih.gov/articles/PMC12390179/]
- 55. A guide to human microbiome research: study design ... [https://pmc.ncbi.nlm.nih.gov/articles/PMC7469990/]
- 56. Computational Tools and Resources for Long-read ... [https://pmc.ncbi.nlm.nih.gov/articles/PMC12631790/]
- 57. Reporting guidelines for human microbiome research [https://www.nature.com/articles/s41591-021-01552-x]
- 58. Microbiome confounders and quantitative profiling ... [https://www.nature.com/articles/s41591-024-02963-2]
- 59. Accurate profiling of microbial communities for shotgun ... [https://microbiomejournal.biomedcentral.com/articles/10.1186/s40168-025-02249-w]
- 60. A quantitative approach to measure and predict ... [https://pubmed.ncbi.nlm.nih.gov/39230261/]
- 61. Bioinformatics Pipeline For High-Throughput Sequencing [https://www.meegle.com/en_us/topics/bioinformatics-pipeline/bioinformatics-pipeline-for-high-throughput-sequencing]
- 62. a comprehensive review of DNA sequence analysis task ... [https://pmc.ncbi.nlm.nih.gov/articles/PMC12011883/]
- 63. Bioinformatics Workflow for Whole Genome Sequencing [https://www.cd-genomics.com/bioinformatics-workflow-for-whole-genome-sequencing.html]
- 64. Bioinformatic Analysis of DNA Sequence Data [https://www.fiosgenomics.com/bioinformatic-analysis-of-dna-sequence-data/]
- 65. How Metagenomic Sequencing Works — In One Simple ... [https://www.linkedin.com/pulse/how-metagenomic-sequencing-works-one-simple-flow-2025-dsjzf]
- 66. A Step-By-Step Guide to DNA Sequencing Data Analysis [https://www.kolabtree.com/blog/a-step-by-step-guide-to-dna-sequencing-data-analysis/]
- 67. Chapter 3 High throughput sequencing | Omics Data Analysis [https://uclouvain-cbio.github.io/WSBIM2122/sec-hts.html]
- 68. Benchmarking Metagenomics Tools for Taxonomic ... [https://pmc.ncbi.nlm.nih.gov/articles/PMC6716367/]
- 69. Investigating the impact of database choice on the accuracy of ... [https://animalmicrobiome.biomedcentral.com/articles/10.1186/s42523-022-00207-7]
- 70. Testing the limits of short-reads metagenomic ... [https://www.nature.com/articles/s41598-025-07734-8]
- 71. Hands-on: Assembly of metagenomic data / sequencing ... Assembly [https://training.galaxyproject.org/training-material/topics/assembly/tutorials/metagenomics-assembly/tutorial.html]
- 72. - Graph Significantly Improve the Recovery of... Based Approaches [https://pmc.ncbi.nlm.nih.gov/articles/PMC8528159/]
- 73. Visualization and analysis of RNA-Seq assembly graphs [https://pmc.ncbi.nlm.nih.gov/articles/PMC6698738/]
- 74. Performance difference of graph-based and alignment-based ... [https://genomebiology.biomedcentral.com/articles/10.1186/s13059-019-1885-y]
- 75. The NMDC Metadata Standards Documentation - GitHub Pages [https://microbiomedata.github.io/nmdc-schema/Metadata_Documentation_Overview/]
- 76. Microbiome Metadata Standards: Report of the National ... [https://pmc.ncbi.nlm.nih.gov/articles/PMC8573954/]
- 77. “Metadata - A love letter to your future self ... [https://microbiomedata.org/2024/07/15/metadata-a-love-letter-to-your-future-self-community-driven-metadata-standards-to-promote-open-and-accessible-science/]
- 78. ganon2: up-to-date and scalable metagenomics analysis [https://pubmed.ncbi.nlm.nih.gov/40677913/]
- 79. Critical Assessment of Metagenome Interpretation [https://pmc.ncbi.nlm.nih.gov/articles/PMC5903868/]
- 80. Critical Assessment of Metagenome Interpretation - CAMI [https://cami-challenge.org/]
- 81. Critical Assessment of Metagenome Interpretation [https://www.nature.com/articles/s41592-022-01431-4]
- 82. online evaluation and ranking of metagenomic software [https://pubmed.ncbi.nlm.nih.gov/40331433/]
- 83. FAQ - Frequently Asked Questions [https://cami-challenge.org/faq/]
- 84. The selection of software and database for metagenomics ... [https://pmc.ncbi.nlm.nih.gov/articles/PMC10081788/]
- 85. CAMISIM: simulating metagenomes and microbial communities [https://microbiomejournal.biomedcentral.com/articles/10.1186/s40168-019-0633-6]
- 86. Benchmarking metagenomic binning tools on real datasets ... [https://www.nature.com/articles/s41467-025-57957-6]
- 87. Laboratory validation of a clinical metagenomic sequencing ... [https://pmc.ncbi.nlm.nih.gov/articles/PMC6499319/]
- 88. CN101833613A - 一ç§å£è…” å¾® è½æ•°æ®åº“åŠå…¶ 生 - Google Patents 物 群 应 用 [https://patents.google.com/patent/CN101833613A/zh]
- 89. A theoretical and generalized approach for the assessment ... [https://www.sciencedirect.com/science/article/pii/S2001037020305651]
- 90. Comparison of Illumina and Oxford Nanopore Technology for genome analysis of Francisella tularensis, Bacillus anthracis, and Brucella suis | BMC Genomics | Full Text [https://bmcgenomics.biomedcentral.com/articles/10.1186/s12864-023-09343-z]
- 91. Metagenomics [https://nanoporetech.com/applications/techniques/metagenomics-and-microbiome-analysis-with-nanopore-technology]
- 92. Empirical assessment of the enrichment-based metagenomic methods in identifying diverse respiratory pathogens | Scientific Reports [https://www.nature.com/articles/s41598-024-75120-x]
- 93. MiSeq Sequencing System applications and methods [https://www.illumina.com/systems/sequencing-platforms/miseq/applications.html]
- 94. Sequencing Platforms | Illumina NGS platforms [https://www.illumina.com/systems/sequencing-platforms.html]
- 95. NextGen Omics 2025 [https://nanoporetech.com/about/events/conferences/nextgen-omics-2025]
- 96. Comparison of Illumina and Oxford Nanopore Sequencing Technologies for Pathogen Detection from Clinical Matrices Using Molecular Inversion Probes - PMC [https://pmc.ncbi.nlm.nih.gov/articles/PMC12179503/]
- 97. Metagenome-guided culturomics for the targeted ... [https://www.nature.com/articles/s41467-024-55668-y]
- 98. Metagenome-guided culturomics for the targeted ... [https://pubmed.ncbi.nlm.nih.gov/39809763/]
- 99. New tools for reconstruction and heterologous expression of ... [https://pmc.ncbi.nlm.nih.gov/articles/PMC4742407/]
- 100. Refactoring biosynthetic gene clusters for heterologous ... [https://pmc.ncbi.nlm.nih.gov/articles/PMC8238852/]
- 101. Multiplexed mobilization and expression of biosynthetic ... [https://www.nature.com/articles/s41467-022-32858-0]
- 102. Genome mining reveals novel biosynthetic gene clusters in ... [https://www.nature.com/articles/s41598-023-47121-9]
- 103. METABOLIC: high-throughput profiling of microbial genomes ... [https://pubmed.ncbi.nlm.nih.gov/35172890/]
- 104. METABOLIC: high-throughput profiling of microbial genomes ... [https://microbiomejournal.biomedcentral.com/articles/10.1186/s40168-021-01213-8]
- 105. Identification and heterologous expression of an NRPS ... [https://microbialcellfactories.biomedcentral.com/articles/10.1186/s12934-025-02753-6]
- 106. An Approach to Integrate Metagenomics ... [https://pubmed.ncbi.nlm.nih.gov/40296452/]
- 107. An Approach to Integrate Metagenomics ... [https://researchportal.lih.lu/en/publications/an-approach-to-integrate-metagenomics-metatranscriptomics-and-met]
- 108. A Focus on Metagenomics, Metatranscriptomics, and ... [https://pubmed.ncbi.nlm.nih.gov/40871274/]
- 109. Cross-comparison of gut metagenomic profiling strategies [https://www.nature.com/articles/s42003-024-07158-6]