Evaluating Transcription Factor Binding Site Conservation: From Genomic Principles to Clinical Applications
This comprehensive review examines the principles, methods, and applications of transcription factor binding site (TFBS) conservation analysis across species.
Evaluating Transcription Factor Binding Site Conservation: From Genomic Principles to Clinical Applications
Abstract
This comprehensive review examines the principles, methods, and applications of transcription factor binding site (TFBS) conservation analysis across species. We explore how evolutionary conservation serves as a powerful filter for identifying functional regulatory elements amidst widespread non-functional binding. The article covers comparative genomics approaches, multi-species ChIP-seq strategies, and computational tools that leverage conservation to improve prediction accuracy. We critically evaluate different TF binding models, address common challenges like high false-positive rates, and demonstrate how conserved cis-regulatory modules control essential biological pathways. With specific examples from foundational research to recent breakthroughs in understanding the human gene regulatory code, this resource provides scientists and drug development professionals with practical frameworks for interpreting non-coding variation and prioritizing regulatory elements for experimental validation.
The Evolutionary Principles of TFBS Conservation: Why Conserved Binding Matters
The identification of conserved gene regulatory elements is fundamental to understanding the genetic basis of development, evolution, and disease. For decades, sequence conservation has been the primary tool for pinpointing functional non-coding DNA. However, emerging research reveals a more complex picture: many functional regulatory elements maintain their role across species despite significant sequence divergence. This comparison guide objectively examines the paradigms of sequence conservation and binding-site cluster conservation as strategies for identifying functional transcription factor binding sites (TFBSs). We present experimental data demonstrating that while sequence-based methods effectively identify deeply conserved elements, approaches focusing on the conservation of transcription factor binding-site clustering significantly enhance the discovery of functional cis-regulatory modules (CRMs), especially across larger evolutionary distances. This synthesis provides researchers and drug development professionals with a framework for selecting appropriate methodologies based on their specific evolutionary and functional questions.
The precise spatiotemporal regulation of gene expression is orchestrated by transcription factors (TFs) binding to specific DNA sequences known as transcription factor binding sites (TFBSs). These binding sites are often organized into functional clusters called cis-regulatory modules (CRMs) or enhancers [1] [2]. Identifying these functional elements across species is crucial for understanding evolutionary biology, developmental processes, and the regulatory basis of disease.
The concept of sequence conservation relies on the principle that functional DNA sequences, including regulatory elements, evolve more slowly than non-functional sequences due to purifying selection. This approach uses direct nucleotide sequence alignment to identify conserved regions, under the assumption that functional elements will exhibit higher sequence similarity than surrounding non-functional DNA [3] [4].
In contrast, the concept of binding-site cluster conservation posits that the functional unit of regulation is not the specific nucleotide sequence, but the spatial arrangement and combinatorial clustering of multiple TFBSs. This model suggests that the overall architecture of binding sites can be conserved even when individual binding sites undergo substantial sequence turnover [1] [4].
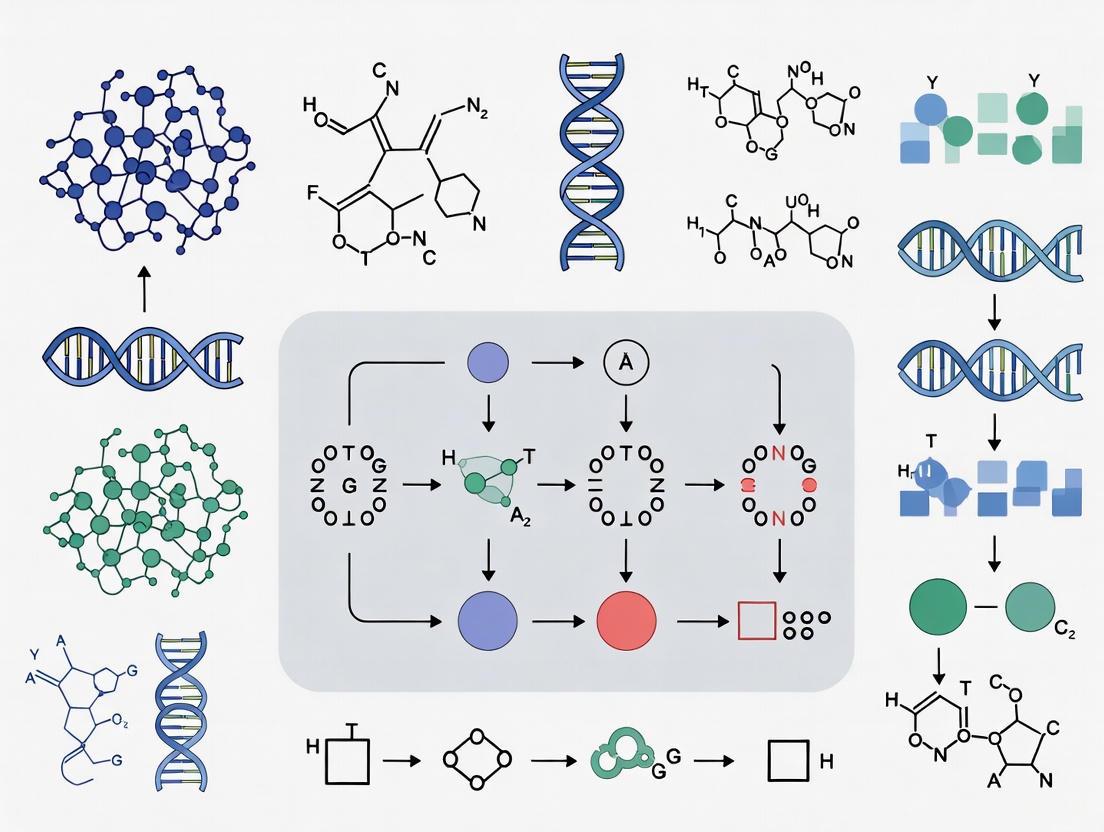
The following diagram illustrates the conceptual relationship between these two conservation paradigms and their functional outcomes:
Figure 1: Conceptual Framework for Identifying Conservation in Gene Regulation. Two primary paradigms—sequence conservation and binding-site cluster conservation—utilize different methodologies to identify functional cis-regulatory modules (CRMs), with varying effectiveness across evolutionary distances.
Comparative Analysis of Conservation Paradigms
Performance Across Evolutionary Distances
The utility of sequence-based versus cluster-based conservation methods varies significantly with evolutionary distance. The following table summarizes key comparative findings from empirical studies:
Table 1: Performance Comparison Across Evolutionary Distances
| Study System | Sequence Conservation Findings | Binding-Site Cluster Conservation Findings | Reference |
|---|---|---|---|
| Drosophila species (D. melanogaster & D. pseudoobscura) | Limited ability to distinguish functional from non-functional binding-site clusters | Conservation of binding-site clustering accurately discriminated functional CRM | [1] |
| Mammalian liver (Human, macaque, mouse, rat, dog) | Only ~10% of enhancers showed sequence conservation | Two-thirds of TF-bound regions fell into CRMs; combinatorial analysis revealed conserved function | [3] |
| Mouse-Chicken heart development | Only 22% of promoters and 10% of enhancers were sequence-conserved | Synteny-based mapping identified 5x more conserved enhancers (42% total) | [4] |
| Insect A-P patterning (Drosophila & Tribolium) | Bicoid TFBS clusters found only in D. melanogaster | Hunchback, Knirps, Caudal, Kruppel TFBS clusters conserved despite sequence divergence | [2] |
Functional Validation and Predictive Power
The ultimate test of any conservation metric is its ability to predict functional regulatory elements. Both approaches have been rigorously validated through experimental approaches:
Table 2: Functional Validation Studies
| Conservation Approach | Experimental Validation Method | Key Findings | Reference |
|---|---|---|---|
| Binding-site cluster conservation | Transgenic reporter assays in Drosophila embryos | 6 of 27 predicted clusters functioned as enhancers for adjacent genes; 3 drove expression unrelated to neighbors | [1] |
| Multi-species combinatorial binding | ChIP-seq for 4 liver TFs across 5 mammalian species | Shared CRMs associated with liver pathways and disease loci from GWAS | [3] |
| Synteny-based conservation | In vivo reporter assays in mouse for chicken enhancers | Functionally conserved enhancer activity despite sequence divergence | [4] |
| In silico TFBS cluster prediction | MCAST analysis of A-P patterning genes | TFBS cluster size <1kb in both species; more transversional than transitional sites | [2] |
Experimental Protocols and Methodologies
Identifying Binding-Site Cluster Conservation
The computational identification of conserved binding-site clusters involves multiple bioinformatics steps:
MCAST Analysis for TFBS Clusters: The Motif Cluster Alignment Search Tool (MCAST) scans genomic sequences for statistically significant clusters of non-overlapping transcription factor binding sites [2]. The protocol involves:
- Sequence Preparation: Extract genomic sequences including gene regions with 20kb upstream and downstream flanking regions
- Motif Collection: Obtain Position Weight Matrices (PWMs) for relevant transcription factors from databases like JASPAR
- Cluster Scanning: Run MCAST with stringent parameters (p-value < 0.005, gap between TFBS < 30bp)
- Orthologous Comparison: Identify and compare clusters across species
- Functional Annotation: Map clusters to promoter, exon, and intron regions using resources like Ensemble and NCBI
Synteny-Based Ortholog Identification: The Interspecies Point Projection (IPP) algorithm identifies orthologous regulatory elements independent of sequence similarity [4]:
- Anchor Point Identification: Define alignable genomic regions between species
- Bridged Alignment: Use multiple bridging species to increase anchor points
- Position Projection: Interpolate positions of non-alignable elements relative to anchors
- Confidence Classification: Categorize projections as Directly Conserved (DC), Indirectly Conserved (IC), or Nonconserved (NC) based on distance to anchors
Experimental Validation Workflows
Functional validation of predicted conserved elements requires rigorous experimental approaches:
In Vivo Reporter Assays: This gold-standard approach tests the enhancer activity of predicted regions:
- Element Cloning: Amplify candidate regulatory regions from genomic DNA
- Reporter Constructs: Clone elements upstream of minimal promoter and reporter gene (e.g., lacZ, GFP)
- Transgenesis: Generate transgenic organisms (flies, mice) carrying reporter constructs
- Expression Analysis: Assay embryos or tissues for reporter gene expression patterns
- Comparative Analysis: Compare expression patterns to native gene expression and across species
Multi-Species ChIP-Seq: This approach directly maps transcription factor binding events across species:
- Tissue Collection: Obtain homologous tissues from multiple species at equivalent developmental stages
- Chromatin Immunoprecipitation: Use validated antibodies against conserved TF epitopes
- Library Preparation & Sequencing: Process samples consistently across species
- Peak Calling: Identify significantly enriched binding regions in each species
- Orthology Mapping: Determine shared and species-specific binding events using alignment and synteny-based methods
The following workflow diagram illustrates the key experimental and computational steps for identifying and validating conserved regulatory elements:
Figure 2: Integrated Workflow for Identifying and Validating Conserved Regulatory Elements. This pipeline combines computational prediction using both sequence and binding-site cluster conservation approaches with experimental validation to identify functional cis-regulatory modules across species.
Successful investigation of regulatory conservation requires specialized reagents and computational resources:
Table 3: Essential Research Reagents and Resources
| Resource Type | Specific Examples | Function/Application | Key Features |
|---|---|---|---|
| TFBS Databases | CollecTF, JASPAR | Provide curated transcription factor binding motifs | Experimentally validated PWMs; taxonomy-wide coverage; transparent curation [5] |
| Genome Browsers | NCBI Genome Data Viewer, Ensemble | Visualize genomic contexts of predicted elements | Annotation of promoters, exons, introns; regulatory element mapping [2] |
| Motif Analysis Tools | MEME Suite (MCAST) | Identify statistically significant TFBS clusters | Scans for clusters of matches to multiple motifs; customizable parameters [2] |
| Synteny Mapping Tools | Interspecies Point Projection (IPP) | Identify orthologous regions independent of sequence | Uses bridged alignments with multiple species; overcomes alignment limitations [4] |
| Experimental Validation | Transgenic reporter constructs, ChIP-seq antibodies | Functional testing of predicted regulatory elements | Conserved epitope antibodies for multi-species ChIP; minimal promoter reporters [1] [3] |
The comparative analysis of sequence conservation versus binding-site cluster conservation reveals complementary rather than competing approaches for identifying functional regulatory elements. Sequence conservation remains highly effective for identifying deeply conserved regulatory elements, particularly in closely related species and for elements under strong purifying selection. In contrast, binding-site cluster conservation demonstrates superior performance for detecting functional elements across larger evolutionary distances, where sequence similarity may be minimal but architectural and functional conservation persists.
For researchers and drug development professionals, the choice of approach should be guided by specific research questions. Sequence-based methods are optimal for studying conservation among closely related species or identifying elements with strong functional constraints. Binding-site cluster approaches are essential for comparative studies across distantly related organisms, investigating regulatory innovation, and understanding how regulatory architecture evolves. The most powerful contemporary strategies integrate both approaches, leveraging their complementary strengths to comprehensively map the evolving regulatory landscape across species, tissues, and developmental contexts.
Transcription factor binding sites (TFBS) demonstrate a striking paradox in their evolutionary dynamics: while many sites undergo rapid turnover, a core set remains evolutionarily stable over deep phylogenetic timescales. This analysis compares the functional significance of these stable TFBS against their lineage-specific counterparts, synthesizing experimental data from multi-species studies to demonstrate that evolutionarily conserved TFBS are disproportionately associated with essential biological pathways, core developmental genes, and human disease mechanisms. Through systematic evaluation of quantitative data from liver, heart, stem cell, and bacterial systems, we establish that conserved cis-regulatory modules (CRMs) serve as critical hubs in the regulatory architecture of complex organisms, providing a framework for prioritizing functional non-coding genetic variation in disease research.
Gene regulatory evolution occurs primarily through changes in cis-regulatory elements, particularly transcription factor binding sites, which exhibit a complex pattern of conservation and divergence across species. While early studies suggested widespread conservation of regulatory elements, high-throughput comparative analyses have revealed that TFBS evolution is characterized by substantial turnover, with only a minority of sites conserved across large evolutionary distances [6] [4]. This rapid evolution creates a challenging landscape for distinguishing functionally significant regulatory elements from neutral binding events.
The development of multi-species ChIP-seq, DAP-seq, and other high-throughput mapping technologies has enabled researchers to identify a core set of evolutionarily stable TFBS that persist across deep phylogenetic divides. These conserved elements appear to represent a foundational layer of gene regulatory architecture that underlies essential cellular processes and developmental programs. This analysis systematically evaluates the functional significance of these evolutionarily stable TFBS through comparative analysis of experimental data across multiple species and biological contexts.
Quantitative Analysis of TFBS Conservation Patterns
Conservation Rates Across Evolutionary Distances
Table 1: Evolutionary Conservation of Regulatory Elements Across Taxonomic Groups
| Element Type | Human-Mouse Conservation | Human-Chicken Conservation | Human-Great Ape Conservation | Key Associated Functions |
|---|---|---|---|---|
| Liver TFBS | 21-37% [3] | N/A | N/A | Liver metabolism, blood coagulation, lipid metabolism [3] |
| Enhancers (Heart) | ~10% (sequence conservation) [4] | 42% (with synteny) [4] | N/A | Heart development, patterning [4] |
| hESC Enhancers | <5% [7] | N/A | >80% [7] | Pluripotency, embryogenesis, lineage specification [7] |
| Plant TFBS | N/A | N/A | 150 million years conservation [8] | Drought tolerance, stress response [8] |
Functional Associations of Conserved TFBS
Table 2: Functional Categories Enriched in Evolutionarily Stable TFBS
| Biological System | Conserved TFBS Association | Experimental Validation | Disease Relevance |
|---|---|---|---|
| Liver Metabolism | Co-regulated liver genes; essential pathways [3] | Shared CRMs in human, macaque, mouse, rat, dog [3] | Blood coagulation disorders, lipid metabolism diseases [3] |
| Stem Cell Biology | Core pluripotency network [7] | Functional enhancer assays in hESC [7] | Cancer lethality, developmental disorders [7] |
| Heart Development | Cardiac patterning genes [4] | In vivo reporter assays in mouse [4] | Congenital heart disease |
| Bacterial Stress Response | Antibiotic resistance regulation [9] | Sort-seq repression strength mapping [9] | Antibiotic treatment failure |
Experimental Methodologies for TFBS Conservation Analysis
Multi-Species ChIP-Seq Protocol
The chromatin immunoprecipitation followed by sequencing (ChIP-seq) protocol has been adapted for comparative studies across multiple species. Key modifications include:
Cross-species Antibody Validation: Antibodies raised against conserved epitopes must be validated for cross-reactivity in all study species [3]. For liver TF studies, antibodies against HNF4A, CEBPA, ONECUT1, and FOXA1 demonstrated conserved recognition across human, macaque, mouse, rat, and dog [3].
Tissue Matching: Physiological and developmental stages must be carefully matched. Liver studies utilized primary tissue from adults with comparable physiological states [3], while heart development studies used equivalent embryonic stages (E10.5 in mouse, HH22 in chicken) [4].
Peak Calling Consistency: Uniform bioinformatic processing across species using tools such as MACS2 with consistent statistical thresholds enables comparable binding site identification [10].
Orthology Determination: For closely related species, sequence-based alignment (LiftOver) suffices, but for distantly related species (e.g., mouse-chicken), synteny-based approaches like Interspecies Point Projection (IPP) dramatically improve ortholog detection [4].
Birth-Death Evolutionary Modeling
This computational framework estimates TFBS evolutionary rates without relying solely on base-by-base alignments:
Rate Estimation: Birth (λ) and death (μ) rates are estimated from TF motif counts within orthologous sequences across a known phylogeny [6] [11].
Ancestral State Reconstruction: The most likely number of TFBS at each phylogenetic node is calculated using maximum likelihood approaches [11].
Lineage Assignment: Individual TFBS are assigned to evolutionary branches based on the reconstructed ancestral states [11].
Application to six transcription factors (GATA1, SOX2, CTCF, MYC, MAX, ETS1) revealed that 58-79% of human binding sites originated since human-mouse divergence, with over 15% unique to hominids [6] [11].
DAP-Seq for Cross-Species TFBS Mapping
DNA Affinity Purification Sequencing (DAP-seq) enables high-throughput TFBS mapping across multiple species:
In Vitro TF Production: Transcription factors are expressed in vitro without requiring species-specific antibodies [8].
Genomic DNA Fragmentation: Native genomic DNA from each species is fragmented to create representative libraries [8].
Multiplexed Barcoding: Species-specific barcodes enable simultaneous processing of multiple genomes in a single experiment, reducing technical variability [8].
Integration with Single-Cell Data: Combining DAP-seq binding maps with single-nuclei RNA sequencing links TFs to specific cell types and regulatory networks [8].
This approach has successfully mapped ~3,000 genome-wide binding maps for 360 transcription factors across 10 plant species spanning 150 million years of evolution [8].
Visualizing Regulatory Evolution: Pathways and Workflows
Evolutionary Fates of Functional Enhancers
Multi-Species TFBS Identification Workflow
The Scientist's Toolkit: Essential Research Reagents
Table 3: Key Research Reagents for TFBS Conservation Studies
| Reagent/Resource | Function | Application Example | Considerations |
|---|---|---|---|
| Anti-TF Antibodies | Chromatin immunoprecipitation of specific TFs | Cross-species ChIP-seq for liver TFs [3] | Must target conserved epitopes; require validation in each species |
| Universal Protein-Binding Microarray | High-throughput TF binding affinity measurement | UniProbe database with 32,896 8-mer sequences [12] | In vitro system; may not capture chromatin context |
| DAP-seq Platform | In vitro TFBS mapping without antibodies | 360 transcription factors across 10 plant species [8] | Enables multiplexed cross-species comparisons |
| Whole-Genome Bisulfite Sequencing | DNA methylation profiling at single-base resolution | Methylation patterns in TF binding regions [10] | Critical for epigenetic dimension of TFBS evolution |
| Sort-Seq Reporter System | High-throughput measurement of regulatory activity | TetR TFBS landscape mapping (17,851 variants) [9] | Links sequence to regulatory function quantitatively |
| Birth-Death Model Algorithms | Computational inference of TFBS evolutionary history | Lineage-specific binding site identification [6] [11] | Alignment-free method for ancient reconstruction |
| Dehydrocrebanine | Dehydrocrebanine | High-Purity Reference Standard | High-purity Dehydrocrebanine for research. Explore its applications in neuroscience and oncology. For Research Use Only. Not for human consumption. | Bench Chemicals |
| Octadecanal | Octadecanal | High-Purity Fatty Aldehyde | RUO | Octadecanal (Stearaldehyde), a C18 fatty aldehyde. For research into lipid metabolism, fragrance, and material science. For Research Use Only. Not for human or veterinary use. | Bench Chemicals |
Evolutionarily stable TFBS represent a functionally privileged class of regulatory elements that disproportionately contribute to essential biological processes and disease mechanisms. The consistent association of conserved cis-regulatory modules with core developmental genes and pathways across diverse biological systems underscores their critical importance in maintaining organismal function. For researchers and drug development professionals, these findings suggest strategic approaches for prioritizing non-coding genomic regions in disease studies: elements conserved across deep evolutionary timescales represent high-value targets for understanding fundamental regulatory mechanisms and developing therapeutic interventions. The experimental frameworks and computational tools summarized here provide a roadmap for systematic identification and functional characterization of these critical regulatory elements across diverse biological contexts and disease states.
A fundamental goal in genomics is to understand how gene regulatory information is encoded in DNA sequence and how this code evolves across species. Transcription factor binding sites (TFBSs)—short DNA sequences recognized by transcription factors—serve as the fundamental units of gene regulatory networks. While protein-coding sequences have relatively straightforward conservation patterns, the evolutionary dynamics of TFBSs present a more complex picture. Evidence from both Drosophila and mammalian systems reveals a surprising paradox: despite deep conservation of transcriptional regulatory networks and transcription factor specificities, the binding sites themselves often exhibit remarkable sequence divergence. This guide systematically compares the experimental approaches, findings, and emerging principles from these two foundational model systems, providing researchers with a framework for evaluating conservation in their own systems of interest.
Core Concepts and Terminology
Table 1: Key Terminology in Comparative Regulatory Genomics
| Term | Definition | Relevance |
|---|---|---|
| Transcription Factor Binding Site (TFBS) | Short, specific DNA sequence recognized and bound by a transcription factor | Basic functional unit of transcriptional regulation |
| cis-Regulatory Module (CRM) | Compact genomic region containing clusters of TFBSs that control specific aspects of gene expression | Functional unit of gene regulation; often ~1 kb in size |
| Direct Conservation (DC) | Regulatory elements identifiable through standard sequence alignment methods | Represents classically conserved non-coding elements |
| Indirect Conservation (IC) | Functionally conserved regulatory elements with highly diverged sequences, identifiable through synteny | Explains "conservation without sequence alignment" phenomenon |
| Binding Site Turnover | Evolutionary process where TFBSs are gained and lost while maintaining regulatory function | Contributes to sequence divergence despite functional conservation |
| Synteny | Preservation of genomic context and gene order between species | Powerful tool for identifying orthologous regulatory regions |
Conservation of Transcription Factor Binding Specificities
Deep Evolutionary Conservation of DNA Recognition
A foundational finding from comparative studies is the remarkable conservation of transcription factor binding specificities across vast evolutionary distances. Systematic analysis using HT-SELEX to characterize DNA binding specificities for approximately 900 Drosophila transcription factors revealed that orthologous pairs of TF DNA-binding domains (DBDs) between Drosophila and humans almost invariably recognize highly similar DNA sequences, despite approximately 600 million years of divergence [13].
This conservation of binding specificity is particularly striking when compared to other protein interaction domains. While many TF DBD families show extremely high conservation, several families exhibit conservation levels similar to other interaction domains like kinase domains, SH3, and SH2 domains [13]. The finding that DNA binding preferences are more conserved than overall protein sequence would predict suggests strong negative selection pressure on TF DNA recognition motifs.
Structural Determinants of Specificity Conservation
The conservation of binding specificity is primarily determined by the structural family of the transcription factor [13]. For example:
- bHLH proteins maintain recognizably similar E-box preferences
- Homeodomain proteins conserve their distinct DNA recognition patterns
- Nuclear receptor family members maintain characteristic binding signatures
This structural constraint explains how orthologous TFs can recognize similar sequences despite significant sequence divergence in both the TFs themselves and their target binding sites.
Drosophila Models: Precision Tools for Dissecting Regulatory Logic
Experimental Paradigms in Drosophila Research
Table 2: Key Experimental Approaches in Drosophila Regulatory Genomics
| Method | Application | Key Findings |
|---|---|---|
| In vivo enhancer testing | Testing predicted CRMs attached to reporter genes in transgenic embryos | 6 of 27 predicted clusters functioned as enhancers for adjacent genes [14] |
| Binding site clustering analysis | Identifying dense clusters of predicted TFBSs as candidate CRMs | Conservation of binding-site clusters accurately discriminates functional from non-functional regions [14] |
| Population genomics | Analyzing TFBS variation across 162 isogenic Drosophila lines | 24-28% of bound sites contained SNPs; variation anti-correlates with positional information content [15] |
| HT-SELEX | High-throughput characterization of TF binding specificities | Generated DNA binding motifs for ~230 Drosophila TFs; enabled cross-species comparison [13] |
Quantitative Insights from Drosophila Studies
Drosophila research has yielded several key quantitative insights into TFBS conservation:
- Cluster conservation predicts function: Comparison between D. melanogaster and D. pseudoobscura revealed that conservation of binding-site clusters accurately discriminates functional regions from non-functional ones, while conservation of primary sequence alone cannot [14].
- Variation patterns reflect constraints: For TFs Twist, Biniou, and Tinman, weaker PWM-scoring motifs showed higher levels of individual variation (2.9% SNP frequency in Drosophila), consistent with purifying selection acting on functional sites [15].
- Functional buffering of variation: Evidence suggests TFBS mutations, particularly at evolutionarily conserved sites, can be efficiently buffered to ensure coherent levels of transcription factor binding [15].
Figure 1: Experimental workflow for identifying and validating conserved regulatory elements in Drosophila. The approach integrates computational prediction with experimental validation in transgenic models, followed by comparative analysis to distinguish different types of conservation.
Mammalian Systems: Complexity and Long-Range Conservation
Experimental Frameworks in Mammalian Research
Table 3: Key Experimental Approaches in Mammalian Regulatory Genomics
| Method | Application | Key Findings |
|---|---|---|
| Interspecies Point Projection (IPP) | Synteny-based algorithm to identify orthologous regulatory regions independent of sequence alignment | Identified 5× more conserved enhancers between mouse and chicken than alignment-based methods [4] |
| Multi-species ChIP-seq | Comparing TF binding across multiple mammalian species | Rapid TF binding turnover observed; cooperative binding changes among cobound TFs [16] |
| Bag-of-Motifs (BOM) modeling | Representing regulatory elements as unordered motif counts for classification | Accurately predicts cell-type-specific enhancers across species (93% accuracy in mouse E8.25 embryos) [17] |
| MORALE framework | Domain adaptation for cross-species prediction of TF binding | Enables deep learning models to learn species-invariant regulatory features [18] |
Quantitative Insights from Mammalian Studies
Mammalian comparative genomics has revealed distinct patterns of regulatory evolution:
- Extensive hidden conservation: In mouse-chicken comparisons (approximately 300 million years divergence), only ~10% of enhancers show sequence conservation, but synteny-based methods (IPP) reveal >42% positional conservation—a fivefold increase [4].
- Cooperative binding evolution: In closely related mammals, cobound TFs change their genomic binding cooperatively, with most binding differences occurring without nearby sequence variations in core motifs [16].
- Cross-species prediction advances: The MORALE framework enables effective cross-species prediction of TF binding by aligning statistical moments of sequence embeddings across species [18].
Direct Comparative Analysis: Drosophila vs. Mammalian Systems
Quantitative Comparison of Evolutionary Dynamics
Table 4: System-Level Comparison of TFBS Conservation Patterns
| Feature | Drosophila | Mammals |
|---|---|---|
| Evolutionary rate of TF binding | Slower, more constrained | Faster turnover, particularly in rodents [16] |
| Sequence conservation of enhancers | Moderate (~50% conserve between closely related species) | Low (~10% between mouse-chicken) [4] |
| Positional conservation | Not systematically quantified | Extensive (42% between mouse-chicken using IPP) [4] |
| Nature of binding changes | More quantitative, graded differences | More qualitative, cooperative shifts [16] |
| Population variation | Higher (2.9% SNP frequency at TFBS) | Lower (0.25% in human CEU population) [15] |
| Effective population size | Larger | Smaller |
| Key identification method | Binding site cluster conservation | Synteny-based positional conservation |
Shared Principles Despite Different Dynamics
Despite the differing evolutionary dynamics, both systems share important principles:
- Functional conservation without sequence alignment: Both systems show evidence of conserved regulatory function despite sequence divergence. The even-skipped stripe 2 enhancer maintains function among insects despite high sequence divergence [4], paralleling the "indirectly conserved" elements in mammals.
- Importance of clustering: In both Drosophila and mammals, clustering of TFBSs appears crucial for function, whether analyzed through conservation of site clusters [14] or through Bag-of-Motifs representations that discard spacing information [17].
- Buffering of variation: Both systems show evidence that TFBS mutations can be buffered at the level of binding or function, particularly at evolutionarily conserved sites [15].
Figure 2: Comparative analysis of TFBS conservation mechanisms in Drosophila versus mammalian systems. While evolutionary dynamics differ substantially, both systems share fundamental principles of regulatory conservation.
The Scientist's Toolkit: Essential Research Reagents and Methods
Table 5: Essential Research Reagents and Computational Tools
| Resource Type | Specific Examples | Application and Function |
|---|---|---|
| Experimental Assays | HT-SELEX, ChIP-seq, ATAC-seq, transgenic reporter assays (Drosophila), in vivo enhancer assays (mouse) | Mapping TF binding and validating enhancer function across species |
| Genome Resources | D. melanogaster and D. pseudoobscura genomes; multiple mammalian reference genomes; DGRP flies; 1000 Genomes data | Providing sequence and variation data for comparative analyses |
| Computational Tools | Interspecies Point Projection (IPP), Bag-of-Motifs (BOM), MORALE, EEL, GimmeMotifs, FIMO | Identifying conserved elements and predicting regulatory function across species |
| Key Datasets | modENCODE TF binding maps, ENCODE human TF maps, multi-species embryonic chromatin profiles | Pre-computed binding information for comparative analyses |
| Epifriedelanol acetate | Epifriedelanol Acetate | High-Purity Reference Standard | High-purity Epifriedelanol acetate for cancer & metabolic research. For Research Use Only. Not for human or veterinary diagnostic or therapeutic use. |
| Dihexyl phthalate | Dihexyl Phthalate | High-Purity Plasticizer | RUO | Dihexyl Phthalate is a high-purity plasticizer for materials science research. For Research Use Only. Not for diagnostic or personal use. |
Emerging Principles and Future Directions
The integration of evidence from Drosophila and mammalian systems reveals a more nuanced understanding of regulatory evolution than previously appreciated. The emerging principles include:
- Deep conservation of TF binding specificities despite widespread binding site turnover
- Functional conservation through different mechanisms—cluster conservation in Drosophila versus positional conservation in mammals
- Importance of comparative frameworks that go beyond simple sequence alignment
- Power of machine learning approaches like BOM and MORALE that capture higher-order features of regulatory sequences
These principles provide a foundation for future research aimed at understanding human regulatory variation and its relationship to disease. The experimental and computational approaches summarized here offer researchers multiple entry points for investigating gene regulation in their own systems of interest, with appropriate choice of model system depending on the specific biological questions being addressed.
The regulation of gene expression is a fundamental process in biology, and transcription factor binding sites (TFBSs) serve as the key genomic sequences that control this process. Comparative genomics has revealed that a significant portion of non-coding sequences, including TFBSs, is under functional constraint through evolution [19]. The core thesis underpinning this field posits that conserved TFBSs are not merely sequence artifacts but represent functional elements with critical roles in essential biological processes. Studies across diverse organisms—from yeast to humans—consistently demonstrate that TFBSs with significant evolutionary conservation are disproportionately associated with genes involved in crucial cellular functions, developmental programs, and tissue-specific pathways [20] [21] [22].
The investigation of conserved regulatory makeup represents a powerful approach for distinguishing functional TFBSs from the vast landscape of non-functional genomic sequences. This guide provides a comprehensive comparison of the experimental methods, analytical frameworks, and emerging insights in the field of TFBS conservation analysis, with particular emphasis on the demonstrated linkage between conservation and biological function.
Methodological Comparison: Approaches for Conserved TFBS Analysis
Experimental and Computational Workflows
Researchers employ diverse methodological frameworks to identify and validate conserved TFBSs. The table below summarizes the core approaches, their applications, and key findings regarding functional conservation.
Table 1: Comparative Analysis of Methods for Studying Conserved TFBS
| Method | Key Principle | Application Scope | Functional Linkage Evidence |
|---|---|---|---|
| Positional Regulomics [23] | Identifies TFBS with positional preferences relative to genomic landmarks (e.g., TSS) | Genome-scale analysis of putative promoter regions | Gene groups with common TFBS show similar expression profiles and biological functions |
| Multi-Species ChIP-seq [20] [21] | Compares experimentally determined TF binding events across species | Identification of conserved binding events in specific tissues/cell types | Conserved TFBS show stronger correlation with conserved gene expression patterns |
| DAP-seq [8] | In vitro mapping of TF binding using purified TFs and genomic DNA | High-throughput mapping across multiple species, especially plants | Conservation scores identify functionally critical regulatory elements |
| Binding Site Clustering Analysis [24] | Identifies clustered TFBS as candidate cis-regulatory modules | Genomic screening for developmental enhancers | Conservation of binding-site clustering accurately discriminates functional CRM |
| MONKEY Algorithm [25] | Binding site-specific evolutionary model applied to multiple alignments | Phylogenetic identification of constrained TFBS | Statistical evaluation of conservation significance based on evolutionary distance |
Quantitative Relationships Between Conservation and Function
Rigorous quantitative analyses have established compelling relationships between TFBS conservation and functional impact:
Gene Expression Correlation: Analysis of TF binding events in hepatocytes and embryonic stem cells revealed that genes with conserved TFBSs in their promoters show significantly higher conservation of expression patterns between human and mouse compared to genes with non-conserved binding events [20]. The conditional probability of binding conservation increases markedly when the target gene is expressed in both species.
Combinatorial Binding Effects: The functional impact of conservation is magnified for groups of TFBSs. Studies demonstrate that when multiple TFs bind a promoter, their joint conservation shows stronger association with conserved gene expression than individual TFBS conservation [20].
Evolutionary Distance Effects: Research in yeast species revealed that the probability of a non-functional TFBS being conserved by chance alone is remarkably low (approximately 0.002 for a 10-bp sequence across three Saccharomyces species), enabling reliable functional annotation based on conservation [19].
The diagram below illustrates the conceptual relationship between TFBS conservation and its functional implications across evolutionary timescales.
Experimental Protocols for Conserved TFBS Identification
Multi-Species Chromatin Immunoprecipitation (ChIP-seq)
The simultaneous analysis of transcription factor binding across multiple species represents a powerful approach for identifying conserved regulatory elements with functional significance [21].
Protocol Overview:
- Sample Preparation: Isolate primary tissue from multiple species under physiologically comparable conditions. Liver tissue has proven particularly suitable due to its cellular homogeneity (~75% hepatocyte nuclei) [21].
- Cross-linking and Immunoprecipitation: Treat tissue with formaldehyde for DNA-protein cross-linking; perform chromatin shearing; incubate with validated antibodies raised against conserved TF epitopes.
- Library Preparation and Sequencing: Construct sequencing libraries from immunoprecipitated DNA; sequence on high-throughput platforms.
- Peak Calling and Alignment: Identify significant binding peaks in each species; map to respective genomes.
- Orthologous Region Identification: Define orthologous genomic regions using whole-genome alignments.
- Conservation Analysis: Classify binding events as conserved when occurring in orthologous regions across species.
Functional Validation: Conserved binding events identified through this approach show strong association with tissue-specific biological pathways. For example, shared cis-regulatory modules in liver tissue are enriched near genes involved in blood coagulation and lipid metabolism pathways [21].
DAP-seq for High-Throughput Cross-Species Profiling
DNA Affinity Purification Sequencing (DAP-seq) has emerged as a scalable alternative for mapping TF binding sites across multiple species, particularly in plant genomics [8].
Protocol Overview:
- TF Expression and Barcoding: Express transcription factors in vitro; multiplex using species-specific barcoding.
- Genomic DNA Preparation: Fragment genomic DNA from target species; prepare libraries.
- Affinity Purification: Incubate TFs with genomic DNA; perform consecutive affinity purification.
- Sequencing and Data Integration: Sequence bound DNA fragments; integrate with single-cell RNA expression maps.
- Conservation Scoring: Identify TFBS with high conservation scores across species.
Recent Innovations: Updated DAP-seq protocols incorporate stricter filtering criteria and integrate TF binding data with single-cell transcriptomes, enabling researchers to infer which TFs shape specific cell identities [8].
Table 2: Essential Research Reagents and Computational Tools for Conserved TFBS Analysis
| Resource Type | Specific Examples | Function/Application | Key Features |
|---|---|---|---|
| Experimental Databases | TRANSFAC [23], DBTSS [23], Plant TFDB [22] | Reference databases for known TFBS and motifs | Curated collections of experimentally validated binding sites |
| Genomic Resources | Ensembl Plants [22], DAP-seq data portals [8] | Access to orthologous genes and promoter sequences | Pre-computed orthology relationships and alignment tools |
| Computational Tools | MONKEY [25], FIMO [22], Minimap2 [22] | Identification of conserved TFBS in alignments | Binding site-specific evolutionary models, motif enrichment analysis |
| Antibody Resources | Validated ChIP-grade antibodies against conserved epitopes [21] | Multi-species ChIP experiments targeting specific TFs | Antibodies raised against conserved protein domains for cross-species compatibility |
Biological Pathways and Processes Enriched for Conserved TFBS
Tissue-Specific Functional Enrichment
Cross-species analyses consistently identify specific biological pathways that demonstrate remarkable conservation of regulatory control:
Liver-Specific Pathways: Multi-species ChIP-seq of liver-enriched transcription factors (HNF4A, CEBPA, ONECUT1, FOXA1) revealed that conserved cis-regulatory modules are preferentially associated with genes involved in critical hepatic functions, including blood coagulation cascades and lipid metabolism [21]. Disease-associated mutations from genome-wide association studies are significantly enriched in these conserved regulatory regions.
Developmental Programs: In Drosophila, conserved clusters of transcription factor binding sites accurately distinguish functional enhancers that control embryonic patterning genes [24]. These conserved regulatory modules drive expression of key developmental regulators including giant, fushi tarazu, and odd-skipped.
Starch Biosynthesis in Plants: Comparative analysis of common bean regulatory networks identified ERF, MYB, and bHLH transcription factor families as having conserved binding sites near starch biosynthesis genes, highlighting the conservation of metabolic pathway regulation [22].
Quantitative Functional Impact
The functional significance of conserved TFBS is demonstrated through rigorous quantitative measures:
Enhanced Expression Impact: Conserved TF binding events exert a greater influence on the expression of their target genes compared to non-conserved binding events [20]. This relationship holds across diverse cell types and developmental stages.
Evolutionary Stability: Transcription factor binding preferences show remarkable stability over evolutionary timescales—DAP-seq studies have identified nearly identical binding sites for proteins from grasses and trees that diverged 150 million years ago [8].
The diagram below illustrates the experimental workflow for multi-species conserved TFBS analysis and its connection to functional validation.
Emerging Frontiers: Expansion of Regulatory Code Through TF Interactions
Recent research has revealed that the complexity of conserved regulatory control extends beyond individual TFBS to encompass sophisticated interaction networks:
DNA-Guided TF Interactions: Large-scale interaction screening of over 58,000 TF-TF pairs has identified 2,198 interacting pairs, with 1,329 showing preferential binding to motifs arranged in distinct spacing/orientation and 1,131 forming novel composite motifs [26]. These interactions dramatically expand the regulatory lexicon.
Cooperativity and Specificity: TF-TF interactions commonly cross family boundaries, with different family members showing distinct spacing preferences with the same interaction partners [26]. This explains how TFs with similar binding specificities can achieve distinct biological functions—resolving paradoxes such as the "hox specificity paradox" where homeodomain proteins with identical TAATTA binding motifs execute distinct developmental functions.
Cell-Type-Specific Regulation: Novel composite motifs identified through interaction screens are enriched in cell-type-specific regulatory elements and are more likely to be formed between developmentally co-expressed TFs [26]. This represents a crucial mechanism for achieving specific transcriptional outcomes using a limited repertoire of TFs.
The comprehensive analysis of conserved transcription factor binding sites across multiple species and experimental platforms consistently demonstrates that sequence conservation serves as a powerful indicator of biological function. Conserved TFBS are disproportionately associated with essential biological processes, tissue-specific functions, and evolutionary constrained developmental programs. The emerging paradigm reveals a complex regulatory code where conserved binding sites serve as functional anchors within broader interaction networks, with conservation metrics providing critical filters for distinguishing functional elements from the background of genomic sequences. As methods for high-throughput binding site mapping and cross-species comparison continue to advance, the linkage between TFBS conservation and biological function will undoubtedly yield further insights into the fundamental principles of gene regulatory evolution.
Transcription factors (TFs) are fundamental regulators of gene expression that bind specific DNA sequences to control diverse biological processes, including development, metabolism, and stress responses. Among the numerous TF families in eukaryotic genomes, three families stand out for their remarkable conservation across evolutionary timescales: the AP2/ERF (Ethylene Response Factor), MYB (myeloblastosis), and bHLH (basic helix-loop-helix) families. These families have undergone significant expansion in plants while maintaining conserved structural and functional characteristics across distantly related species.
Understanding the conservation patterns of these TF families provides crucial insights into the evolution of gene regulatory networks and the molecular basis of morphological diversity. Despite hundreds of millions of years of independent evolution, core DNA-binding specificities and protein-protein interaction capabilities remain strikingly conserved, suggesting strong evolutionary constraints on these regulatory proteins. This guide systematically compares the conservation patterns of ERF, MYB, and bHLH transcription factor families, providing experimental data and methodologies relevant to researchers investigating gene regulatory evolution and transcriptional regulation in both plant and animal systems.
The ERF, MYB, and bHLH transcription factor families represent some of the largest and most functionally diverse groups of transcriptional regulators across eukaryotic organisms. Comparative genomic analyses reveal substantial variation in family sizes between species, reflecting both evolutionary expansions and specific adaptations.
Table 1: Genomic Distribution of ERF, MYB, and bHLH Transcription Factor Families Across Species
| Species | ERF Family Members | MYB Family Members | bHLH Family Members | Reference |
|---|---|---|---|---|
| Arabidopsis thaliana | 122 | 197 (R2R3: ~70%) | 162 | [27] [28] [29] |
| Oryza sativa (rice) | 139 | 155 (R2R3: ~57%) | 111 | [27] [28] [29] |
| Panax ginseng | Not reported | Not reported | 169 | [30] |
| Chlamydomonas reinhardtii | Not reported | 38 | 8 | [29] |
| Drosophila melanogaster | Not applicable | Not applicable | 242 | [31] |
| Homo sapiens | Not applicable | Not applicable | 108 | [32] |
The expansion of these transcription factor families in higher plants compared to basal lineages demonstrates their crucial role in plant-specific processes. For instance, the ERF family in Arabidopsis contains 122 members, while rice has 139 members, with both species maintaining similar subgroup organizations despite evolutionary divergence [27]. The MYB family shows similar expansion patterns, with R2R3-MYB proteins representing the predominant subclass in higher plants [28] [29]. The bHLH family exhibits remarkable conservation between animals and plants, with Drosophila having 242 bHLH genes compared to 108 in humans [32] [31].
Structural Conservation and DNA-Binding Specificities
Domain Architecture and Motif Conservation
Each transcription factor family possesses characteristic DNA-binding domains that show remarkable evolutionary conservation:
ERF Family: Characterized by a single AP2/ERF domain of approximately 60-70 amino acids that forms a three-dimensional structure resembling the minor groove-binding domain of the histone-fold protein HMFB [27]. The ERF family is divided into two major subfamilies (ERF and CBF/DREB) based on sequence similarities and binding specificities.
MYB Family: Defined by the MYB DNA-binding domain, typically consisting of 1-4 imperfect repeats of approximately 52 amino acids each [28]. Plant MYB proteins are classified into four major groups: 1R-MYB, R2R3-MYB, R1R2R3-MYB, and 4R-MYB, with R2R3-MYB representing the most abundant class in higher plants [28] [29].
bHLH Family: Possesses the characteristic basic helix-loop-helix domain, where the basic region mediates DNA binding while the HLH region facilitates dimerization [33] [32]. The bHLH domain recognizes the canonical E-box (CANNTG), with specificity determined by nucleotide variations at the central positions [33] [31].
DNA Recognition Specificities
Table 2: DNA-Binding Specificities of ERF, MYB, and bHLH Transcription Factor Families
| TF Family | Primary Recognition Sequence | Specificity Variations | Structural Basis |
|---|---|---|---|
| ERF | GCC box (AGCCGCC) | DREB/CBF subfamily recognizes dehydration-responsive element (DRE) with A/GCCGAC | Single AP2/ERF domain with three β-sheets [27] |
| MYB | Consensus: CNGTTR | Specific recognition determined by residues in the third helix of each repeat | MYB repeats form helix-turn-helix structures; R2R3-MYB predominates in plants [28] [29] |
| bHLH | E-box (CANNTG) | Specificity determined by central nucleotides; TWIST recognizes double E-box with 5-nt spacing | Basic region binds major groove; HLH domain mediates dimerization [33] [32] [31] |
The bHLH family demonstrates particularly striking conservation of DNA-binding specificities. Systematic comparisons between Drosophila and human bHLH proteins reveal that binding specificities are highly conserved, extending even to subtle dinucleotide preferences [31]. For example, the TWIST subfamily of bHLH proteins recognizes a unique double E-box motif with two E-boxes spaced preferentially by 5 nucleotides, a specificity conserved from Drosophila to humans [33].
Evolutionary Conservation Across Species
Sequence and Functional Conservation
Comparative analyses reveal different degrees of conservation across these TF families:
Deep Evolutionary Conservation: The bHLH family demonstrates extraordinary conservation, with DNA-binding specificities maintained across 600 million years of bilaterian evolution [31]. Orthologous TFs between Drosophila and mammals show nearly identical binding preferences, suggesting strong evolutionary constraints.
Plant-Specific Expansions: The ERF and MYB families have undergone significant expansion in plants compared to other lineages. The ERF family in Arabidopsis and rice diverged into 12 and 15 groups respectively, with 11 groups common to both species, indicating functional diversification before the monocot-dicot divergence [27].
Conservation of Regulatory Complexes: The MYB and bHLH families frequently interact in regulatory complexes, particularly the well-characterized MYB-bHLH-WD40 (MBW) complex that regulates flavonoid and anthocyanin biosynthesis in plants [29] [34]. This cooperative interaction represents a conserved functional module across plant species.
Mechanisms of Family Expansion and Diversification
Gene duplication events represent the primary mechanism for transcription factor family expansion:
Whole Genome Duplication: Segmental and chromosomal duplications have contributed significantly to the expansion of ERF, MYB, and bHLH families in plants [27] [28].
Tandem Duplications: Local gene duplications have generated clusters of related transcription factors, allowing for functional diversification while maintaining core DNA-binding capabilities [27] [29].
Subfunctionalization: Following duplication events, paralogous genes often undergo functional specialization, acquiring distinct expression patterns or regulatory specificities while conserving ancestral protein functions [27] [29].
Experimental Approaches for Studying TF Conservation
Genomic and Computational Methods
Several experimental approaches have been developed to study transcription factor conservation:
Figure 1: Workflow for Computational Analysis of TF Conservation
Comparative Genomics: Identification of transcription factor families across multiple sequenced genomes using conserved domain searches [27] [28]. For example, BLAST searches with conserved domains (AP2/ERF, MYB, or bHLH) against genomic databases followed by manual curation.
Phylogenetic Analysis: Reconstruction of evolutionary relationships within TF families using multiple sequence alignment and tree-building algorithms [27] [28] [30]. This approach reveals subgroup diversification and evolutionary relationships.
Synteny-Based Orthology Detection: Algorithms such as Interspecies Point Projection (IPP) identify orthologous regulatory regions beyond sequence similarity, particularly useful for distantly related species [4]. IPP uses syntenic relationships and bridging species to project regulatory elements between genomes.
Functional and Biochemical Assays
Chromatin Immunoprecipitation (ChIP-seq): Genome-wide mapping of transcription factor binding sites [33]. High-resolution ChIP-seq reveals in vivo binding specificities and conservation of binding sites between species.
HT-SELEX (High-Throughput Systematic Evolution of Ligands by Exponential Enrichment): Systematic determination of DNA binding specificities for hundreds of transcription factors [31]. This high-throughput method involves multiple cycles of binding, partitioning, and amplification using random oligonucleotide libraries.
Protein-Binding Microarrays: Alternative high-throughput method for characterizing DNA binding specificities [31].
Electrophoretic Mobility Shift Assay (EMSA): Validation of specific TF-DNA interactions using purified proteins and labeled DNA probes [32].
Yeast One-Hybrid and Two-Hybrid Systems: Investigation of DNA-binding and protein-protein interactions, respectively [34].
Research Reagent Solutions
Table 3: Essential Research Reagents for Transcription Factor Conservation Studies
| Reagent/Category | Specific Examples | Function/Application |
|---|---|---|
| Antibodies | Anti-TWIST1, Anti-H3K27ac | Chromatin immunoprecipitation; protein localization |
| Cloning Systems | Gateway-compatible vectors, Yeast two-hybrid systems (pGBKT7, pGADT7) | Protein expression; interaction studies [34] |
| Reporter Systems | Luciferase, GUS, YFP | Promoter activity; protein localization [34] |
| Sequencing Kits | ChIP-seq, ATAC-seq, RNA-seq | Binding site mapping; chromatin accessibility; expression profiling [33] [4] |
| Heterologous Expression | E. coli protein expression systems | Recombinant TF production for HT-SELEX [31] |
| Genomic Resources | Ensembl Plants, PlantTFDB, FlyTF.org | Orthology data; TF classification [35] [31] |
Key Experimental Findings and Case Studies
Conservation of bHLH Binding Specificities
A comprehensive comparison of 242 Drosophila TFs with human and mouse counterparts revealed that TF binding specificities are highly conserved between Drosophila and mammals, with conservation extending to subtle dinucleotide preferences [31]. This remarkable conservation persists despite approximately 600 million years of independent evolution, suggesting strong structural constraints on DNA-binding domains.
ERF Family Divergence in Plants
Comparative analysis of ERF families in Arabidopsis and rice demonstrated that major functional diversification within this family predated the monocot-dicot divergence [27]. The 122 ERF genes in Arabidopsis and 139 in rice are divided into 12 and 15 groups respectively, with 11 groups common to both species, indicating both conserved and lineage-specific expansions.
MYB-bHLH Interactions in Plant Pigmentation
The MYB and bHLH families functionally interact in the conserved MYB-bHLH-WD40 (MBW) complex that regulates anthocyanin biosynthesis [34]. Repressor MYB proteins like TgMYB4 contain a bHLH-binding motif that enables competitive interaction with bHLH partners, demonstrating how conserved interaction interfaces enable regulatory complexity [34].
Figure 2: MYB-bHLH Regulatory Complex in Anthocyanin Biosynthesis
Nucleosome Interactions and DNA Accessibility
Recent structural studies reveal that bHLH transcription factors like CLOCK-BMAL1 and MYC-MAX employ distinct strategies to access nucleosome-embedded E-boxes [32]. CLOCK-BMAL1 triggers DNA release from histones through PAS domain interactions with the histone octamer, while MYC-MAX shows preferential binding to nucleosomal entry-exit sites, demonstrating how conserved TFs adapt to chromatin environments.
Implications for Regulatory Evolution and Crop Improvement
The conservation patterns of ERF, MYB, and bHLH transcription families have significant implications for both basic biology and applied biotechnology:
Predictive Genomics: The high conservation of DNA-binding specificities enables accurate prediction of regulatory networks in non-model organisms based on data from reference species [35] [31].
Crop Engineering: Knowledge of conserved TF functions facilitates the transfer of regulatory modules between species for crop improvement. For example, understanding the conserved MYB-bHLH-WD40 complex enables targeted manipulation of anthocyanin pathways for enhanced nutritional value [34].
Synthetic Biology: Conserved TF DNA-binding specificities provide standardized parts for constructing synthetic gene circuits with predictable behaviors across diverse biological systems [31].
The exceptional conservation of these transcription factor families across evolutionary timescales underscores their fundamental importance in gene regulatory networks, while species-specific expansions and modifications illustrate how regulatory evolution contributes to biological diversity.
Comparative Genomics Approaches for TFBS Analysis: Practical Implementation
Understanding the evolution of gene regulation requires connecting gene ancestry with the conservation of its regulatory sequences. This guide examines computational pipelines that integrate ortholog identification with the subsequent discovery of conserved transcription factor binding sites (TFBS). The core premise is that genes with common ancestry (orthologs) often retain similar regulatory controls in their promoter regions, but the degree of TFBS conservation varies significantly across lineages and biological contexts [3] [36].
Accurately identifying orthologs is the critical first step, as errors at this stage propagate through the entire analysis. Following orthology assignment, computational models scan the regulatory regions of orthologous genes to find statistically overrepresented, conserved DNA motifs. These pipelines enable researchers to move from thousands of genomes to a shortlist of candidate regulatory elements crucial for tissue-specific function or disease [17] [35].
This guide objectively compares the performance, underlying algorithms, and optimal use cases for the leading tools in this field, providing a structured framework for selecting the right pipeline for cross-species regulatory genomics.
Orthology Inference: A Performance Comparison
The foundation of any cross-species comparison is the accurate identification of orthologous genes. The table below summarizes the benchmarked performance and characteristics of three modern orthology inference tools.
Table 1: Performance Comparison of Modern Orthology Inference Tools
| Tool | Core Algorithm | Scalability (Time Complexity) | Benchmark Accuracy (Precision/Recall) | Key Differentiator |
|---|---|---|---|---|
| FastOMA [37] [38] | K-mer-based placement + taxonomy-guided tree traversal | Linear | 0.955 Precision (SwissTree) | Linear scalability; uses reference HOGs from OMA database |
| OrthoGrafter [39] | Grafting queries onto precomputed PANTHER trees | N/A (Leverages precomputed trees) | High correlation with OMA orthologs | Rapid inference by leveraging Panther's curated gene trees |
| OrthoFinder [37] | All-against-all DIAMOND + gene tree inference | Quadratic | High Recall (General) | High sensitivity for inferring orthogroups |
Experimental Protocol for Orthology Benchmarking
The performance data in Table 1 is primarily derived from independent assessments coordinated by the Quest for Orthologs (QfO) consortium [37] [38]. The standard benchmarking protocol involves:
- Reference Dataset Curation: A set of model organisms with well-curated genomes and established "gold standard" orthologs is defined. This often includes the QfO reference proteome dataset.
- Tool Execution: Each orthology inference tool is run on the same set of input proteomes using default parameters.
- Performance Metric Calculation: Predictions are compared against the gold standard using several metrics:
- Precision: The fraction of predicted ortholog pairs that are correct (e.g.,
True Positives / (True Positives + False Positives)). This measures reliability. - Recall/Sensitivity: The fraction of true ortholog pairs that are successfully recovered (e.g.,
True Positives / (True Positives + False Negatives)). This measures completeness. - Species Tree Discordance: The normalized Robinson-Foulds distance between a species tree inferred from the orthologs and a trusted reference species tree [37].
- Precision: The fraction of predicted ortholog pairs that are correct (e.g.,
From Orthologs to Motif Discovery: Methods & Models
Once orthologs are identified, the promoter sequences of orthologous gene groups are analyzed for conserved TFBS. The table below compares the dominant computational approaches for this task.
Table 2: Comparison of Motif Discovery and TFBS Prediction Methods
| Method | Approach | Interpretability | Reported Performance (auPR) | Best Use Case |
|---|---|---|---|---|
| Bag-of-Motifs (BOM) [17] | Gradient-boosted trees on motif counts | High (Direct motif contribution) | 0.93 - 0.99 (Cell-type-specific CREs) | Predicting cell-type-specific enhancers |
| K-mer-based ML (k-mer grammar) [36] | Machine learning on k-mer frequencies | Medium (Requires motif matching) | 0.99 AUC (GLK binding prediction) | Accurate in vivo binding prediction from sequence |
| PSSM Enrichment (FIMO/HOMER) [35] [40] | Statistical overrepresentation of known motifs | High | Variable; depends on matrix quality [40] | Identifying known motifs in a set of sequences |
| Experimental Cistrome Comparison [3] [36] | Direct cross-species ChIP-seq peak overlap | High (Empirically determined) | N/A (Low conservation observed) | Ground-truth assessment of binding conservation |
Experimental Protocol for Motif Conservation Analysis
The workflow for identifying conserved TFBS in orthologous promoters is methodologically distinct from orthology inference.
- Promoter Sequence Extraction: Upstream regions (e.g., -2000 to +200 base pairs relative to the Transcription Start Site) of all genes in an orthologous group are extracted from each genome [35].
- Multiple Sequence Alignment: Promoter sequences are aligned using tools like Minimap2 or MUSCLE to identify conserved blocks [35].
- Motif Scanning & Enrichment: Conserved regions are scanned with Position-Specific Scoring Matrices (PSSMs) from databases like JASPAR using tools such as FIMO (Find Individual Motif Occurrences). Motif enrichment is calculated by comparing the frequency of motif hits in the target sequences versus a background model [35] [40].
- Validation: Predictions can be validated against experimental cistrome data (e.g., ChIP-seq) from multiple species, when available. Functional validation may involve testing the regulatory potential of predicted motifs in reporter assays [36].
Integrated Analysis: Connecting Orthology and Binding site predictions
The following diagram illustrates the logical workflow and data flow connecting the tools and analyses discussed in this guide, from raw genomic data to validated, conserved regulatory motifs.
Successful execution of a computational pipeline from orthology to motif enrichment relies on a suite of key resources.
Table 3: Essential Reagents and Resources for the Computational Pipeline
| Resource Name | Type | Function in the Pipeline | Key Feature |
|---|---|---|---|
| OMA Database [37] [38] | Reference Database | Provides Hierarchical Orthologous Groups (HOGs) for FastOMA and benchmark data. | Curated orthology relationships for over 2000 genomes. |
| PANTHER [39] | Precomputed Gene Trees | Source of curated gene trees for ortholog grafting with OrthoGrafter. | Manually curated gene families with reconciled trees. |
| JASPAR [40] | TF Motif Database | A source of non-redundant, curated PSSMs for motif scanning and enrichment. | High-quality, manually curated transcription factor binding profiles. |
| Ensembl Plants/Genomes [35] | Genomic Data Platform | Provides genome sequences, gene annotations, and precomputed orthologs for many species. | Centralized access to annotated genomes and comparative genomics data. |
| ChIP-seq Data [3] [36] | Experimental Data | Serves as ground truth for validating computationally predicted TFBS and assessing conservation. | Directly maps in vivo transcription factor binding locations. |
| GimmeMotifs [17] | Motif Analysis Toolkit | Used for motif discovery and scanning, often to create the input for the BOM framework. | Reduces motif redundancy and provides a unified motif analysis workflow. |
The field of computational genomics is rapidly advancing towards more integrated and scalable solutions. The tools compared here, such as FastOMA for its revolutionary linear scalability in orthology inference and BOM for its highly accurate and interpretable motif-based prediction of regulatory elements, represent the current state-of-the-art [37] [17].
A key finding reinforced by cross-species studies is that while the function of a transcription factor may be conserved, its binding sites often show remarkable divergence, with only a small fraction being conserved across deep evolutionary distances [3] [36]. This underscores the necessity of robust computational pipelines to distinguish functionally critical, conserved regulatory elements from the background of non-functional or species-specific binding events.
Future developments will likely involve the tighter integration of structural protein data to improve orthology resolution and the use of gene order conservation (synteny) as an additional layer of evidence [37] [38]. Furthermore, machine learning models that can directly integrate orthology information with sequence and chromatin data will provide even more powerful tools for deciphering the evolutionary dynamics of gene regulation.
Understanding the conservation of transcription factor (TF) binding sites is fundamental to deciphering the evolution of gene regulation. Multi-species Chromatin Immunoprecipitation followed by sequencing (ChIP-seq) has emerged as a powerful experimental strategy to directly map the genomic locations of TFs across different organisms, moving beyond predictions based solely on DNA sequence conservation. This approach reveals that while TF binding preferences (motifs) are often deeply conserved, the genomic locations of binding sites (the cistrome) can diverge significantly, a phenomenon known as cistrome turnover [41]. This guide objectively compares the performance of various multi-species ChIP-seq strategies, detailing their experimental protocols, key findings on conservation dynamics, and the computational tools that support this research.
Comparative Landscape of Multi-Species ChIP-seq Studies
The table below summarizes the design and primary conclusions of several pivotal multi-species ChIP-seq studies, highlighting the variability in conservation rates across different TFs, tissues, and evolutionary distances.
Table 1: Comparison of Key Multi-Species ChIP-seq Studies
| Study Organisms | Tissue/Cell Type | Transcription Factor(s) | Key Finding on Binding Conservation | Reference |
|---|---|---|---|---|
| Human, Macaque, Mouse, Rat, Dog | Liver | HNF4A, CEBPA, ONECUT1, FOXA1 | ~2/3 of TF-bound regions fell into CRMs; | Ballester et al., 2014 [3] |
| Human, Mouse, Dog, Opossum, Chicken | Liver | CEBPA, HNF4A | Binding is largely species-specific; only 2% of CEBPA binding was shared between human and chicken. [41] | Schmidt et al., 2010 [41] |
| Tomato, Tobacco, Arabidopsis, Maize, Rice | Leaf & Green Fruit | GLK1, GLK2 | Most GLK binding sites are species-specific; conserved sites are often associated with photosynthetic genes. [36] | Li et al., 2022 [36] |
| Mouse, Chicken | Embryonic Heart | Multiple cardiac TFs (profiled via chromatin accessibility) | Most cis-regulatory elements (CREs) lack sequence conservation; synteny-based algorithms can identify functionally conserved CREs with diverged sequences. [4] | Hahne et al., 2025 [4] |
A critical insight from these studies is the distinction between sequence conservation and functional conservation. While many functional binding sites show clear sequence alignment across species, a significant fraction do not, yet retain their regulatory function, a concept highlighted by the "indirectly conserved" elements identified through synteny [4]. Furthermore, the binding sites that are conserved across multiple species are often of high biological importance, being enriched near genes involved in essential tissue-specific pathways and disease-associated loci from genome-wide association studies (GWAS) [3].
Core Experimental Protocol for Multi-Species ChIP-seq
A standardized workflow is essential for generating comparable data across species. The following diagram and detailed protocol outline the key steps.
Diagram 1: Multi-species ChIP-seq workflow. The wet-lab steps (yellow) generate sequencing data, while the bioinformatics steps (green) analyze conservation.
Detailed Experimental Methodology
The standard protocol, as applied in studies of liver TFs across five mammals, involves several critical stages [3] [41]:
Tissue Collection and Homogenization: The process begins with the collection of homologous tissues (e.g., liver) from healthy adult individuals of each species. The liver is a preferred model for such studies due to its relative cellular homogeneity, with approximately 75% of nuclei originating from hepatocytes [3]. Tissues are processed immediately, often using perfusion to remove blood cells, and then homogenized.
Cross-linking and Chromatin Preparation: Tissues or isolated nuclei are cross-linked with 1% formaldehyde to fix protein-DNA interactions. Chromatin is then sheared into fragments of 200–500 base pairs using sonication. The efficiency of shearing is verified by agarose gel electrophoresis.
Chromatin Immunoprecipitation (ChIP): The sheared chromatin is incubated with a TF-specific antibody that has been raised against a conserved epitope and validated for cross-reactivity in the studied species [3] [41]. For example, the five-mammal study used antibodies against HNF4A, CEBPA, ONECUT1, and FOXA1. Antibody-bound complexes are pulled down using Protein A/G beads. After rigorous washing, the cross-linking is reversed, and the immunoprecipitated DNA is purified.
Library Preparation and Sequencing: The purified DNA is used to construct sequencing libraries, which are then subjected to high-throughput sequencing (ChIP-seq). The depth of sequencing must be sufficient for robust peak calling; studies often aim for tens of millions of reads per sample.
Cross-Species Bioinformatics Analysis
The computational analysis of multi-species ChIP-seq data involves several specialized steps [3] [42]:
- Peak Calling: TF binding events (peaks) are identified in each species individually using tools like MACS2 [42] or multiGPS [18]. A common practice is to use the top 500-1000 peaks for subsequent motif discovery.
- Motif Analysis: The sequences under the peak summits are analyzed with tools like MEME-ChIP to identify the enriched DNA binding motif for the TF in each species [42]. This confirms that the orthologous TFs recognize a similar motif across species [3].
- Orthology Mapping: To determine if a binding event is conserved, peaks from one species (e.g., mouse) are mapped to the genome of another (e.g., human) using tools like LiftOver [4] [41]. This relies on whole-genome alignments but has limitations for highly divergent sequences.
- Defining Conservation: A binding event is typically considered "shared" or "conserved" if a peak is called in the orthologous region of another species. Studies often use a threshold, such as requiring the peak summit to be within a few hundred base pairs of the aligned position [3].
Advanced Computational & Machine Learning Approaches
Given the limitations of alignment-based methods, new computational strategies are being developed to predict and analyze TF binding conservation. The diagram below illustrates the architecture of one such advanced approach.
Diagram 2: Domain adaptation for cross-species prediction. Frameworks like MORALE align sequence embeddings across species to create invariant features for robust binding prediction.
Key Methodologies and Performance
- Domain Adaptation (MORALE): This framework improves cross-species TF binding prediction by aligning the statistical moments (mean, variance) of sequence embeddings from different species. This encourages the model to learn species-invariant features without needing adversarial training. In benchmarks, MORALE outperformed both baseline and adversarial approaches across all tested TFs [18].
- Synteny-Based Algorithms (IPP): For distantly related species where sequence alignment fails, the Interspecies Point Projection (IPP) algorithm uses synteny (conserved gene order) and bridged alignments through multiple species to project genomic coordinates. This method identified up to five times more orthologous cis-regulatory elements between mouse and chicken than alignment-based methods [4].
- Virtual ChIP-seq: This method predicts TF binding in a new cell type or context by integrating learned associations with gene expression, existing TF binding data from other cell types, and chromatin accessibility data (e.g., ATAC-seq). This approach successfully predicted binding for 36 chromatin factors (including non-sequence-specific TFs) with high accuracy (Matthews Correlation Coefficient > 0.3) [43].
Successful execution of a multi-species ChIP-seq study relies on a suite of carefully selected reagents and tools.
Table 2: Key Research Reagent Solutions for Multi-Species ChIP-seq
| Reagent / Resource | Function | Key Considerations |
|---|---|---|
| Validated Cross-Reactive Antibodies | Immunoprecipitation of the target TF from different species. | Must target a conserved protein epitope. Performance requires validation via ChIP in each species [3] [41]. |
| multiGPS / MACS2 | Peak-calling software to identify TF binding sites from ChIP-seq data. | multiGPS is noted for its use in processing multi-species data and handling replicates [18]. |
| MEME-ChIP | Discovers de novo and refines DNA binding motifs from ChIP-seq peak sequences. | Used to confirm motif conservation across species [3] [42]. |
| LiftOver / Interspecies Point Projection (IPP) | Maps genomic coordinates from one species to another. | LiftOver uses sequence alignment; IPP uses synteny and is more powerful for distant species [4]. |
| DAP-seq | An in vitro method for high-throughput mapping of TF binding sites. | Useful for profiling many TFs across species without species-specific antibodies [8]. |
Multi-species ChIP-seq has fundamentally advanced our understanding of transcriptional regulation by revealing a dynamic landscape of cistrome evolution, characterized by both deeply conserved, functionally critical binding sites and widespread species-specific binding. The choice of strategy—ranging from standard ChIP-seq in homologous tissues to innovative in vitro methods like DAP-seq or computational predictions using domain adaptation—depends on the specific research question, evolutionary distance, and available resources.
Future directions in the field will likely involve the integration of multi-omics data (e.g., single-cell RNA-seq with ChIP-seq) to understand cell-type-specific conservation [8], the expansion of studies to a wider range of species and tissues, and the continued development of sophisticated machine learning models that can more accurately predict functional regulatory elements across the tree of life.
The conservation of gene regulatory elements across species provides a powerful framework for understanding and leveraging genetic networks in non-model organisms. Orthologous promoters, which are regulatory regions located upstream of genes shared through descent from a common ancestor, often retain critical transcription factor binding sites (TFBS) that control gene expression patterns. In the context of legume research, where common bean (Phaseolus vulgaris) serves as a vital crop but lacks extensive functional annotation, comparative genomics approaches that exploit these conserved regulatory elements have emerged as indispensable tools [35]. The evaluation of TFBS conservation enables researchers to extrapolate functional information from well-characterized model legumes to less-studied crop species, facilitating the identification of key regulatory sequences that govern agronomically important traits.
Studies of regulatory element conservation have revealed that while sequence similarity may diminish over evolutionary distances, functional conservation often persists through maintained relative genomic positions and syntenic relationships [4]. This understanding has transformed approaches to gene regulatory network analysis in species with limited experimental data, allowing researchers to bridge the annotation gap through strategic comparative genomics. The ensuing sections explore specific methodologies, case studies, and experimental validations that demonstrate how orthologous promoter analysis is advancing legume research, with particular emphasis on common bean improvement.
Methodological Approaches for Identifying Conserved Regulatory Elements
Comparative Genomics Workflow for TFBS Prediction
The identification of conserved transcription factor binding sites in common bean relies on a multi-step comparative genomics approach that integrates sequences from related legume species. This methodology begins with the extraction of promoter sequences from the common bean genome, typically defined as regions spanning 2000 base pairs upstream to 200 base pairs downstream of the transcription start site (TSS) [35]. These sequences are then aligned to the promoters of orthologous genes from strategically selected related species, such as Vigna angularis, V. radiata, and Glycine max, to identify regions of significant sequence conservation.
Following alignment, computational tools like FIMO (Find Individual Motif Occurrences) are employed to conduct motif enrichment analyses using known plant TF binding motifs from databases such as the Plant Transcription Factor Database [35]. Conservation is determined by identifying exact sequence matches for these motifs on the same strand and within a narrow window (typically 100 nucleotides) in the aligned promoter regions of common bean and its orthologs. This stringent approach significantly reduces false positive rates that typically plague TFBS prediction in non-model organisms, providing higher confidence in the identified conserved regulatory elements.
Advanced Algorithms for Detecting Sequence-Diverged Regulatory Elements
While sequence alignment-based methods effectively identify conserved regulatory elements between closely related species, they fail to detect functionally conserved elements with highly diverged sequences. To address this limitation, innovative algorithms like Interspecies Point Projection (IPP) have been developed to identify "indirectly conserved" cis-regulatory elements (CREs) based on synteny rather than sequence similarity [4]. This synteny-based approach identifies orthologous genomic regions by interpolating the position of regulatory elements relative to flanking blocks of alignable sequences, called anchor points.
The IPP algorithm enhances detection sensitivity by incorporating bridged alignments through multiple intermediate species, increasing the number of anchor points and improving projection accuracy for distantly related organisms [4]. This approach has demonstrated remarkable efficacy, identifying up to five times more orthologous regulatory elements than conventional alignment-based methods in comparisons between mouse and chicken. When applied to legume species, such methodologies could dramatically expand the catalog of known conserved regulatory elements, revealing previously undetectable functional conservation in promoter regions across large evolutionary distances.
Case Study: Profiling Conserved TFBS in Common Bean
Experimental Design and Computational Analysis
A comprehensive study profiling conserved transcription factor binding motifs in Phaseolus vulgaris employed a sophisticated comparative genomics approach to elucidate the regulatory landscape of this important crop [35]. Researchers analyzed promoter regions for 12,631 common bean genes, focusing on sequences from 2000 base pairs upstream to 200 base pairs downstream of transcription start sites. These promoters were compared with orthologous regions from three related legume species: Vigna angularis, Vigna radiata, and Glycine max, with orthology relationships established using Ensembl Plants database, which employs Gene Order Conservation (GOC) and Whole Genome Alignment (WGA) scores to identify high-confidence orthologs [35].
The alignment of promoter sequences was performed using Minimap2, with parameters optimized to capture multiple alignments and generate CIGAR strings for precise mapping. This approach proved significantly more sensitive than multiple aligners like MUSCLE, identifying approximately four times more similar regions between promoters [35]. Following alignment, conservation analysis revealed that promoter sequence similarity strongly correlated with protein sequence homology, with higher protein similarity associated with greater promoter conservation. This relationship underscores the coordinated evolution of coding sequences and their regulatory elements.
Key Findings on Conserved TF Motifs
The analysis revealed an average of six conserved motifs per gene in common bean, with significant variation across gene functional categories [35]. Statistical analysis demonstrated a strong relationship between the number of conserved motifs and the amount of available experimental evidence for gene regulation, suggesting that genes with more extensively documented regulatory patterns exhibit greater conservation of their regulatory architecture. Among the transcription factor families, ERF, MYB, and bHLH dominated the conserved motifs, with particular implications for the regulation of starch biosynthesis genes—a finding with direct relevance to nutritional quality improvement in common bean.
Table 1: Conserved Transcription Factor Binding Motifs in Phaseolus vulgaris
| TF Family | Prevalence Among Conserved Motifs | Key Regulatory Roles | Implications for Crop Improvement |
|---|---|---|---|
| ERF | High | Stress response, development | Drought tolerance, yield enhancement |
| MYB | High | Phenylpropanoid pathway, specialized metabolism | Nutritional quality, stress adaptation |
| bHLH | High | Starch biosynthesis, cellular differentiation | Carbohydrate content, seed development |
| NAC | Moderate | Senescence, stress signaling | Extended shelf life, abiotic stress tolerance |
| WRKY | Moderate | Defense responses, hormonal signaling | Disease resistance, reduced pesticide use |
The enrichment of specific TF families in conserved regulatory elements provides valuable insights into the evolutionary constraints on gene regulatory networks in legumes. The prevalence of ERF, MYB, and bHLH binding sites suggests these regulators control core physiological processes maintained across legume species, making them prime targets for breeding programs aimed at enhancing multiple traits through modification of master regulatory circuits.
Quantitative Assessment of Conservation Patterns
Relationship Between Sequence Conservation and Regulatory Function
Comprehensive analysis of conserved regulatory elements across species has revealed complex relationships between sequence conservation, positional conservation, and regulatory function. Research on embryonic heart development in mouse and chicken demonstrated that while fewer than 50% of promoters and only approximately 10% of enhancers show sequence conservation between these distantly related species, functional conservation is considerably more widespread [4]. This discrepancy highlights the limitations of sequence-based alignment methods and underscores the importance of incorporating synteny-based approaches for detecting regulatory element orthologs.
In common bean, the relationship between protein sequence homology and promoter sequence conservation follows a quantifiable pattern, with a statistically significant positive correlation observed between these variables [35]. This relationship enables researchers to prioritize candidate genes for promoter analysis based on protein conservation metrics, providing a practical heuristic for experimental design. Additionally, genes with housekeeping functions or roles in core metabolic processes typically exhibit higher degrees of promoter conservation than genes involved in species-specific adaptation or stress responses, reflecting differential selective pressures on various functional gene categories.
Table 2: Quantitative Assessment of Conservation Metrics in Legume Promoters
| Conservation Metric | Range/Value | Method of Calculation | Biological Significance |
|---|---|---|---|
| Average Conserved Motifs per Gene | 6 | Count of TFBS with exact sequence matches in orthologs | Indicates regulatory complexity |
| Protein-Promoter Conservation Correlation | Statistically significant (p<0.05) | Weighted linear regression | Coordinated evolution of coding and regulatory sequences |
| Sequence-Conserved Enhancers | ~10% (mouse-chicken) | LiftOver with minMatch=0.1 | Baseline conservation detectable by alignment |
| Positionally Conserved Enhancers | ~42% (mouse-chicken) | Interspecies Point Projection | Functional conservation beyond sequence similarity |
| ERF Family Dominance | Highest among conserved TF | Enrichment analysis | Central role in conserved regulatory networks |
Impact of Evolutionary Distance on Conservation Patterns
The degree of regulatory element conservation between common bean and related legumes exhibits significant variation based on evolutionary distance. Comparisons with closely related species like Vigna angularis and V. radiata reveal substantially more conserved TFBS than comparisons with more distantly related species like Glycine max [35]. This pattern aligns with observations from vertebrate systems, where the proportion of directly conserved regulatory elements decreases dramatically with increasing evolutionary distance, while indirect conservation through syntenic relationships becomes increasingly important [4].
The conservation of specific TFBS also varies according to the biological processes they regulate. In common bean, promoter elements associated with starch biosynthesis show particularly high conservation across related legumes, reflecting strong selective pressure on metabolic pathways fundamental to seed development and nutritional composition [35]. This pattern of process-specific conservation provides valuable insights for crop improvement, highlighting regulatory pathways where knowledge transfer from well-studied legumes is most likely to prove successful.
Experimental Validation and Functional Characterization
Validation Methods for Predicted Conserved TFBS
The accurate identification of conserved transcription factor binding sites requires rigorous experimental validation to confirm functional significance. In common bean research, several approaches have been employed to validate computational predictions, including integration with epigenomic data, expression analysis, and direct experimental testing of regulatory function [35]. Validation using epigenomic markers involves examining the co-localization of predicted conserved TFBS with chromatin features associated with regulatory activity, such as open chromatin regions (identified by ATAC-seq) and active promoter marks like H3K4me3 and H3K27ac [44].
Gene expression analysis provides additional validation, with conserved promoters often exhibiting tissue-enriched or condition-specific expression patterns that align with their predicted regulatory roles. Research in canine systems has demonstrated that validated promoters show substantial overlap with epigenetic marks (45-55% with open chromatin, 25-35% with H3K4me3, and 47-55% with H3K27ac) [44], providing a benchmark for similar validation in legumes. For high-confidence candidates, direct experimental validation through techniques like STRT2-seq (Single-Cell Tagged Reverse Transcription RNA Sequencing) confirms both the position of transcription start sites and the activity of predicted promoter regions [44].
Applications in Trait Mapping and Gene Discovery
The integration of conserved TFBS analysis with trait mapping approaches has proven particularly powerful for identifying regulatory mechanisms underlying agronomically important characteristics in common bean. Genome-wide association studies (GWAS) of zinc accumulation in Turkish common bean landraces identified significant marker-trait associations on chromosomes Pv06 and Pv08, with candidate genes including Vacuolar Iron Transporter 1 (VIT1) and Wall-Associated Kinase-Like 4 (WAKL4) [45]. Conservation analysis of the promoter regions of these genes revealed maintained regulatory elements potentially controlling their expression in response to zinc availability.
Similarly, studies of symbiotic nitrogen fixation in common bean have leveraged conservation patterns to identify candidate genes and quantitative trait loci (QTLs) influencing this complex trait [46]. The discovery that climbing, indeterminate common bean varieties consistently exhibit higher nodulation and nitrogen fixation abilities than bush-type cultivars has been linked to conserved regulatory elements in genes controlling growth habit and nodulation processes [46]. These findings demonstrate how conserved TFBS analysis can complement genetic mapping approaches to provide mechanistic insights into trait variation.
Research Reagent Solutions for Orthologous Promoter Studies
Table 3: Essential Research Reagents and Resources for Orthologous Promoter Analysis
| Reagent/Resource | Function | Application Example | Key Features |
|---|---|---|---|
| STRT2-seq | 5'-targeted RNA sequencing for promoter identification | Canine promoter atlas development [44] | Low-input requirement, captures alternative TSS |
| GoldenGate Assay | High-throughput SNP genotyping | Lentil genetic map construction [47] | Efficient for genetic fingerprinting, 377 SNP markers |
| PlantTFDB | Database of plant transcription factors and binding motifs | TFBS prediction in common bean [35] | 338 P. vulgaris TFBS representing 40 families |
| FIMO | Motif enrichment analysis | Conserved TFBS identification [35] | Scans sequences with known TF binding motifs |
| Ensembl Plants | Orthology database across plant species | Ortholog identification for Vigna and Glycine [35] | Uses GOC and WGA scores for high-confidence orthologs |
| CISPs | Conserved Intron Scanning Primers | Comparative genomics in legumes [48] | 60% single-copy amplification success across legumes |
| Minimap2 | Sequence alignment program | Promoter sequence alignment [35] | Identifies 4× more similar regions than MUSCLE |
Integration with Multi-Omics Approaches and Breeding Applications
Multi-Omics Strategies for Sensory Trait Improvement
The analysis of conserved regulatory elements is increasingly integrated with multi-omics approaches to comprehensively dissect complex traits in common bean and related legumes. Research on sensory characteristics—including appearance, aroma, taste, flavor, texture, and aftertaste—has demonstrated how genomics, transcriptomics, proteomics, and metabolomics can be combined with regulatory element analysis to identify key biomarkers for desirable traits [49]. This integrated approach enables more efficient marker-assisted selection and genomic selection in breeding programs by connecting variation in regulatory sequences with downstream phenotypic effects.
Multi-omics analysis has revealed that undesirable sensory characteristics, such as "beany flavor," bitterness, and variable textures, represent significant barriers to consumer acceptance of legume-based products [49]. By identifying conserved regulatory elements controlling the biosynthesis of compounds associated with these sensory properties, researchers can develop strategies to modify specific genes using techniques like CRISPR-Cas9, potentially reducing off-flavor compounds or optimizing texture without compromising nutritional value. This application exemplifies how conserved TFBS analysis contributes to targeted crop improvement efforts addressing both production constraints and consumer preferences.
Concluding Perspectives on Regulatory Element Conservation
The study of orthologous promoters and transcription factor binding site conservation represents a powerful approach for bridging the knowledge gap between model and crop legumes. Case studies in common bean demonstrate how comparative genomics strategies can elucidate regulatory networks controlling agronomically important traits, from nutrient accumulation to symbiotic nitrogen fixation. As genomic resources continue to expand across legume species, and algorithms for detecting sequence-diverged regulatory elements improve, the potential for leveraging orthologous promoters in crop improvement will similarly grow.
Future directions in this field will likely include more sophisticated integration of pan-genome representations with regulatory element conservation, enabling researchers to capture variation in both coding and regulatory sequences across diverse germplasm. Additionally, the application of deep learning approaches like deepTFBS, which has shown remarkable success in cross-species prediction of transcription factor binding sites in plant systems [50], holds promise for further enhancing the accuracy of conserved TFBS identification in legumes. These advancing methodologies will continue to transform how researchers utilize orthologous promoter analysis to understand and manipulate the regulatory architecture of crop plants, ultimately accelerating the development of improved varieties with enhanced productivity, nutritional quality, and resilience.
Integrating DNase I Hypersensitivity with Cross-Species Conservation
The study of gene regulation requires precise mapping of functional genomic elements. DNase I hypersensitive sites (DHSs) serve as universal markers of regulatory activity, pinpointing regions where chromatin has undergone structural changes to make DNA accessible to regulatory proteins [51] [52]. These sites, typically 200-400 base pairs in length, collectively define the cis-regulatory compartment of the genome, encompassing promoters, enhancers, silencers, and insulators [53].
When comparing regulatory DNA across species, researchers face a fundamental challenge: while developmental gene expression patterns are often conserved, the underlying regulatory sequences frequently show dramatic divergence [4]. This article examines how the integration of DHS mapping with evolutionary analyses provides powerful insights into the conservation of transcriptional regulation, offering a comprehensive comparison of methodologies and their applications for researchers studying gene regulatory networks.
Fundamental Concepts
DNase I Hypersensitive Sites as Regulatory Markers
DHSs represent genomic regions where nucleosome displacement or remodeling has created accessible chromatin, facilitating the binding of transcription factors and other regulatory proteins [51] [52]. This accessibility increases susceptibility to cleavage by DNase I enzyme, allowing experimental identification. DHS mapping has revealed that only a small fraction (approximately 2%) of the genome exhibits this accessibility, yet these regions contain the majority of functional regulatory elements [52] [53].
The functional significance of DHSs is underscored by their enrichment for genetic variants associated with diseases and phenotypic traits. Large-scale mapping efforts across hundreds of human cell and tissue types have identified approximately 3.6 million DHSs, creating a comprehensive coordinate system for human regulatory DNA [53]. These elements display remarkable cell type selectivity, with only a small minority (3,692) detected universally across all cell types [51].
The Challenge of Regulatory Sequence Conservation
Cross-species comparisons reveal a paradoxical discrepancy: although developmental gene expression patterns and transcriptional networks are often conserved, the underlying cis-regulatory sequences frequently show low sequence similarity, especially at larger evolutionary distances [4]. For example, fewer than 50% of promoters and only approximately 10% of enhancers show sequence conservation between mouse and chicken [4].
This observation has led to the concept of "conservation without sequence similarity" - where regulatory elements maintain their function and genomic position despite significant sequence divergence. The challenge for researchers is to distinguish functionally conserved elements from neutrally evolving non-coding DNA when traditional alignment-based methods fail.
Experimental Approaches and Comparative Analysis
DHS Mapping Methodologies
DNase-seq and Related Techniques
DNase I hypersensitive sites sequencing (DNase-seq) combines traditional DNase I footprinting with next-generation sequencing to genome-widely identify regulatory elements [52]. The methodology involves several critical steps that must be optimized for high-quality data:
- Nuclei Isolation: Cells are lysed under conditions that keep nuclei intact, preserving chromatin structure.
- Limited DNase I Digestion: Isolated nuclei are treated with optimized concentrations of DNase I enzyme for brief periods, creating cleavages preferentially in accessible regions.
- DNA Extraction and Size Selection: Digested DNA is purified, and fragments of appropriate size (typically 100-500 bp) are selected.
- Library Preparation and Sequencing: Cleaved DNA fragments are processed into sequencing libraries.
The resulting data reveal not only DHS locations but, through analysis of cleavage patterns within these sites, can pinpoint where transcription factors are bound through "genomic footprinting" [54]. This dual capability makes DNase-seq particularly valuable for comprehensive regulatory annotation.
Alternative methods for profiling chromatin accessibility include ATAC-seq (Assay for Transposase-Accessible Chromatin using sequencing) and MNase-seq, each with distinct advantages and limitations. However, DNase-seq remains valued for its well-established protocols and ability to provide both broad DHS mapping and transcription factor footprinting.
Key Experimental Considerations
Successful DHS mapping requires careful optimization of several parameters:
- Digestion Conditions: DNase I concentration and digestion time must be titrated to achieve limited digestion, avoiding complete chromatin fragmentation.
- Cell Viability: Starting with high-quality, viable cells is essential, as apoptotic cells exhibit nonspecific chromatin cleavage.
- Control Experiments: Appropriate controls account for sequence-specific cleavage biases.
- Cell Type Selection: DHS profiles are highly cell-type-specific, requiring relevant biological contexts for meaningful results [51] [52].
Cross-Species Conservation Analysis Methods
Sequence-Based Alignment Approaches
Traditional methods for identifying conserved regulatory elements rely on sequence alignment algorithms such as BLAST, BLAT, and LiftOver [4]. These methods identify genomic regions with significant sequence similarity between species, under the assumption that functional elements evolve more slowly than non-functional DNA.
While effective for coding sequences and highly conserved non-coding elements, these approaches become increasingly limited with greater evolutionary distance. For example, only about 10% of heart enhancers show sequence conservation between mouse and chicken using LiftOver, despite evidence of greater functional conservation [4].
Synteny-Based Mapping Methods
To overcome limitations of sequence-based methods, researchers have developed synteny-based algorithms that identify orthologous regions based on their relative position within conserved genomic blocks rather than sequence similarity. The Interspecies Point Projection (IPP) algorithm represents a significant advancement in this area [4].
IPP uses multiple "bridging species" to increase anchor points for projecting genomic coordinates between distantly related species. This approach identifies "indirectly conserved" (IC) elements - regulatory elements that maintain their positional relationship to flanking genes despite sequence divergence. In mouse-chicken comparisons, IPP increases the identification of putatively conserved enhancers more than fivefold compared to alignment-based methods alone [4].
Table 1: Comparison of Cross-Species Conservation Detection Methods
| Method Type | Representative Tools | Key Principle | Advantages | Limitations |
|---|---|---|---|---|
| Sequence Alignment | LiftOver, BLAST, BLAT | Identifies regions of significant sequence similarity | Simple implementation; effective for closely related species | Fails at larger evolutionary distances; misses functionally conserved but sequence-diverged elements |
| Synteny-Based Mapping | IPP (Interspecies Point Projection) | Identifies orthologous regions based on relative position in conserved genomic blocks | Identifies functionally conserved but sequence-diverged elements; works across larger evolutionary distances | Requires multiple genomes; computationally intensive |
| Integrated Functional Conservation | Machine learning classifiers | Combines chromatin features and sequence information to predict conserved function | Can identify functional conservation beyond sequence; incorporates multiple data types | Requires extensive training data; complex implementation |
Integrated Analysis Workflows
Combining DHS mapping with cross-species comparison involves a multi-step process:
- DHS Identification: Map DHSs in relevant cell types/tissues across multiple species.
- Orthology Determination: Use both alignment-based and synteny-based methods to identify orthologous regions.
- Functional Correlation: Correlate DHS patterns with gene expression and epigenetic marks.
- Validation: Test predicted conserved elements through reporter assays or CRISPR-based perturbation.
Comparative Analysis of Key Studies
Case Study 1: DHS Mapping in the Igf2r/Air Imprinted Cluster
A seminal study examining the mouse Igf2r/Air imprinted cluster demonstrated the power of unbiased DHS mapping to identify candidate regulatory elements [55]. Researchers mapped DHSs across a 192-kb region, identifying 21 distinct hypersensitive sites, nine of which mapped to evolutionarily conserved sequences.
Surprisingly, only two of these DHSs showed parental specificity (at the Igf2r and Air promoters), while the remaining 19 were present on both parental alleles. This finding suggested that imprinted silencing targets shared regulatory elements rather than creating allele-specific accessibility at distal sites. The study highlighted how DHS mapping could refine models of epigenetic regulation by providing an unbiased survey of accessible regulatory elements.
Table 2: Key Findings from Igf2r/Air Imprinted Cluster DHS Mapping Study [55]
| Aspect | Finding | Interpretation |
|---|---|---|
| Total DHSs Identified | 21 in 192-kb region | High density of potential regulatory elements |
| Evolutionarily Conserved DHSs | 9 of 21 DHSs | Less than half of DHSs show sequence conservation |
| Allele-Specific DHSs | Only 2 (Igf2r and Air promoters) | Most regulatory elements accessible on both alleles |
| Shared Elements | 19 DHSs present on both parental chromosomes | Igf2r and Air may share cis-acting regulatory elements |
Case Study 2: Cross-Species Transcription Factor Binding Conservation
Research in multiple model systems has revealed that transcription factor binding sites evolve rapidly, with limited conservation between even closely related species. A comprehensive analysis of GOLDEN2-LIKE (GLK) transcription factor binding in five plant species (tomato, tobacco, Arabidopsis, maize, and rice) found that most GLK-bound genes were species-specific, despite the conserved biological function of GLKs in chloroplast development [36].
Similarly, a study profiling 27 transcription factors in yeast hybrids found that while overall promoter binding patterns were conserved between Saccharomyces cerevisiae and Saccharomyces paradoxus, individual binding sites showed significant turnover [56]. These findings highlight the flexibility of transcription factors to bind imprecise motifs and the rapid evolution of regulatory interactions.
Case Study 3: Indirect Conservation of Heart Enhancers
A 2025 study profiling regulatory elements in mouse and chicken embryonic hearts provided compelling evidence for widespread functional conservation of sequence-divergent regulatory elements [4]. Using the IPP algorithm, researchers identified thousands of "indirectly conserved" enhancers that lacked sequence similarity but maintained conserved positional relationships and chromatin signatures.
Notably, these indirectly conserved elements showed similar enrichment for heart-specific epigenetic marks and could drive appropriate expression patterns in transgenic mouse assays, confirming their functional conservation. This study demonstrated that synteny-based mapping can reveal extensive "hidden conservation" of regulatory elements undetectable by sequence alignment alone.
The Scientist's Toolkit
Essential Research Reagents and Solutions
Table 3: Key Research Reagents for DHS Mapping and Cross-Species Analysis
| Reagent/Solution | Function | Key Considerations |
|---|---|---|
| DNase I Enzyme | Digests accessible chromatin | Must be quality-tested for optimal activity; concentration critical |
| Cell/Tissue Culture Media | Maintains cell viability during nuclei preparation | Cell type-specific formulations required |
| Nuclei Isolation Buffer | Releases intact nuclei while preserving chromatin structure | Must include protease inhibitors and appropriate ionic conditions |
| Size Selection Magnetic Beads | Enriches for appropriately digested fragments | Different size cutoffs may be optimal for different applications |
| Library Preparation Kits | Converts DNA fragments to sequencing libraries | Must be compatible with low-input DNA |
| Antibodies for Chromatin IP | Identifies transcription factor binding and histone modifications | Specificity and efficiency critical for quality data |
| Transfection/Transformation Reagents | Introduces reporter constructs for validation | Efficiency varies by cell type |
| (+)-Maackiain | (+)-Maackiain | High-Purity Phytochemical | RUO | High-purity (+)-Maackiain, a natural phytoalexin. For research into plant defense, cancer, & signaling pathways. For Research Use Only. Not for human or veterinary use. |
| N-Vanillyloctanamide | N-Vanillyloctanamide, CAS:58493-47-3, MF:C16H25NO3, MW:279.37 g/mol | Chemical Reagent |
Computational Tools and Databases
Table 4: Essential Computational Resources
| Tool/Database | Primary Function | Application Context |
|---|---|---|
| ENCODE DHS Database [51] [53] | Repository of DHS maps from diverse human cell types | Reference for human regulatory elements |
| PlantDHS Database [51] | DHS maps from Arabidopsis and other plants | Plant regulatory genomics |
| IPP Algorithm [4] | Synteny-based orthology detection | Identifying conserved regulatory elements across distant species |
| LiftOver [4] | Alignment-based coordinate conversion | Identifying conserved elements between closely related species |
| MEME Suite | Motif discovery and enrichment analysis | Identifying transcription factor binding motifs |
| ChIP-seq Analysis Pipelines | Mapping transcription factor binding sites | Identifying direct targets of transcription factors |
Integrated Workflow Visualization
DHS Mapping and Cross-Species Conservation Analysis
Indirect Conservation Identification Process
The integration of DNase I hypersensitivity mapping with cross-species conservation analysis provides a powerful framework for deciphering the evolution of gene regulatory networks. While sequence-based methods effectively identify conserved elements between closely related species, synteny-based approaches like IPP reveal extensive "hidden conservation" of functionally important regulatory elements despite sequence divergence.
Key insights from this integrated approach include:
- Regulatory DNA evolves through both sequence conservation and positional conservation mechanisms.
- Transcription factor binding sites show remarkable flexibility and rapid turnover, even when biological functions are conserved.
- Combining experimental DHS mapping with computational conservation analysis enables comprehensive annotation of functional regulatory elements.
For researchers in genomics and drug development, these approaches offer powerful tools for identifying functionally constrained regulatory elements that may play critical roles in development, disease, and evolutionary innovation. As single-cell technologies and machine learning approaches continue to advance, we can expect even deeper insights into the dynamic evolution of regulatory DNA across the tree of life.
The identification and analysis of transcription factor binding sites (TFBS) across species represents one of the most significant challenges in modern genomics and evolutionary biology. Transcription factors (TFs) are fundamental proteins that regulate transcriptional states, differentiation, and developmental patterns of cells by binding short, specific DNA sequences approximately 6–20 nucleotides long [57]. These binding sites, often referred to as motifs, can differ by a few nucleotides while maintaining biological function, creating a complex computational problem for cross-species comparison. The central challenge lies in distinguishing functionally conserved TFBS from sequences conserved by random chance, particularly given the degenerate nature of these short sequence patterns [19].
Traditional approaches to TFBS conservation analysis have largely relied on sequence alignment methods, which become increasingly limited at larger evolutionary distances. As species diverge, regulatory sequences evolve rapidly, with most cis-regulatory elements (CREs) lacking detectable sequence conservation despite functional conservation [4]. This discrepancy has driven the development of advanced computational approaches, including information content-conservation optimization and genetic algorithms, which can identify functional conservation beyond simple sequence alignment. These methods are revolutionizing our understanding of evolutionary biology, regulatory network evolution, and the molecular basis of phenotypic diversity.
Computational Framework for TFBS Conservation Analysis
Core Algorithm Classes and Methodologies
Table 1: Algorithm Classes for TFBS Conservation Analysis
| Algorithm Class | Core Methodology | Key Advantages | Representative Applications |
|---|---|---|---|
| Information Content-Conservation Optimization | Integrates information content of motifs with phylogenetic conservation signals | Reduces false positives by requiring functional and evolutionary support | Probabilistic identification of constrained sites under purifying selection [19] |
| Genetic Algorithms | Evolutionary-inspired search through motif space using selection, crossover, mutation | Effective exploration of complex, high-dimensional solution spaces | Discovery of novel composite motifs in TF-TF interactions [26] |
| Synteny-Based Projection | Maps regulatory elements based on genomic position relative to conserved anchor points | Identifies functional conservation independent of sequence similarity | Interspecies Point Projection (IPP) algorithm [4] |
| Function Conservation Analysis | Identifies conserved regulatory grammar through co-binding patterns | Reveals conserved regulatory logic despite sequence divergence | Identification of synergistic TFs through functional conservation [58] |
Information Content-Conservation Optimization Algorithms
Information content-conservation optimization algorithms represent a sophisticated approach that integrates two critical aspects of functional TFBS: the information content of sequence motifs and their evolutionary conservation patterns. These methods employ probabilistic frameworks to distinguish sequences under functional constraint from those evolving neutrally [19]. The fundamental principle involves calculating the probability of binding site conservation between species under a neutral model of evolution, with significantly conserved sites indicating functional importance.
These algorithms typically use position weight matrices (PWMs) to represent the binding preferences of transcription factors, encoding the probability of observing each nucleotide at every position within the binding site [57]. The conservation component is then evaluated by comparing observed substitution rates in putative binding sites to expected neutral rates, often derived from synonymous substitution rates in coding sequences. For example, in Saccharomyces cerevisiae, this approach revealed that the probability of a 10-bp sequence being identical across three yeast species by chance alone is approximately 0.002, enabling reliable identification of functional TFBS through conservation signatures [19].
The optimization process involves maximizing a target function that combines motif information content (representing binding specificity) with conservation metrics across species. This dual requirement significantly reduces false positive predictions that plague methods relying solely on motif matching or sequence conservation. For orthologous TFs, the similarity often extends to the level of very subtle dinucleotide binding preferences, demonstrating the remarkable conservation of TF binding specificities across hundreds of millions of years of evolution [31].
Genetic Algorithms in Motif Discovery and Analysis
Genetic algorithms (GAs) provide a powerful bio-inspired approach for exploring the complex solution spaces inherent in TFBS analysis. These algorithms operate through iterative cycles of selection, crossover, and mutation, mimicking natural evolutionary processes to optimize motif discovery and characterization. In the context of TFBS conservation, GAs are particularly valuable for identifying novel composite motifs and cooperative binding arrangements that may be conserved across species despite sequence divergence.
The CAP-SELEX method, which screened more than 58,000 TF-TF pairs, utilized algorithms capable of detecting novel composite motifs by comparing k-mer enrichment in cooperative binding experiments with enrichment observed in individual TF binding data [26]. This approach identified 2,198 interacting TF pairs, with 1,131 showing composite motifs markedly different from the motifs of individual TFs. These novel composite motifs were enriched in cell-type-specific elements and active in vivo, demonstrating the power of evolutionary-inspired algorithms to reveal complex regulatory codes.
Genetic algorithms excel in scenarios where the relationship between sequence and function is complex and multidimensional. They can simultaneously optimize multiple objectives, such as motif conservation, information content, phylogenetic distribution, and structural constraints, making them particularly suitable for identifying TFBS conservation across large evolutionary distances where simple sequence alignment fails [58].
Experimental Protocols and Validation Frameworks
High-Throughput Experimental Methods for Data Generation
Table 2: Experimental Methods for TFBS Data Generation
| Method | Principle | Output | Throughput | Application in Conservation Studies |
|---|---|---|---|---|
| ChIP-seq | Chromatin immunoprecipitation with sequencing | Genomic binding locations in vivo | Medium | Primary source for in vivo binding data; limited by inability to distinguish direct/indirect binding [57] |
| HT-SELEX | High-throughput systematic evolution of ligands by exponential enrichment | DNA sequences bound in vitro | High | Identifies intrinsic binding specificity without chromatin influences [57] [31] |
| CAP-SELEX | Consecutive-affinity-purification systematic evolution of ligands by exponential enrichment | TF-TF interaction motifs and composite elements | High | Maps cooperative binding and composite motifs; screened >58,000 TF pairs [26] |
| DAP-Seq | DNA affinity purification sequencing | In vitro binding sites without chromatin influence | Medium | Identifies pure DNA-binding sites without chromatin and methylation influence [59] |
| Protein Binding Microarrays | Fluorescence-based detection on immobilized DNA arrays | Continuous binding affinity values | High | Measures TF binding preferences in vitro; limited to shorter motifs [57] |
The experimental validation of computationally predicted TFBS conservation requires sophisticated methodologies capable of generating high-quality binding data across multiple species. Chromatin immunoprecipitation followed by sequencing (ChIP-seq) has revolutionized the genome-wide identification of regions bound by TFs in vivo [57]. In this method, TF-DNA complexes are cross-linked using formaldehyde, DNA is fragmented, and target complexes are immunoprecipitated with factor-specific antibodies. The bound sequences are then identified through sequencing, with peak-calling algorithms predicting genomic binding locations. While powerful, ChIP-seq cannot distinguish between direct and indirect binding and is limited to conditions with available antibodies.
In vitro methods like HT-SELEX and CAP-SELEX provide complementary approaches by characterizing intrinsic binding specificities without the confounding effects of chromatin structure. HT-SELEX exposes TFs to pools of randomized DNA sequences, with bound sequences selected through multiple rounds of affinity capture and amplification [57]. This method produces thousands of high-resolution bound sequences and does not require prior knowledge of target sites. CAP-SELEX extends this approach to TF-TF interactions, enabling the identification of cooperative binding and composite motifs through consecutive affinity purification [26].
Recent advances have adapted these methods to high-throughput formats, with CAP-SELEX now performed in 384-well microplate formats, dramatically increasing throughput [26]. These experimental datasets provide the essential foundation for training and validating computational algorithms for TFBS conservation analysis.
Computational Validation Methodologies
The performance evaluation of TFBS conservation algorithms requires rigorous benchmarking against experimentally validated datasets. Receiver operating characteristics (ROC) analysis provides a standardized framework for assessing prediction accuracy, measuring the ability of algorithms to distinguish true binding sites from negative control sequences [40].
Comparative studies have revealed significant differences in the performance of various TF binding models. In one large-scale comparison, only 47% of tested models reached an area-under-curve (AUC) score of 0.7 or higher, with strong variations between different model sources [40]. JASPAR models achieved an average AUC score of 0.83 on high-confidence datasets, compared to 0.76 for HT-SELEX models and 0.57 for PBM-derived models, highlighting the importance of model quality in conservation studies.
Orthology validation provides another critical validation approach, testing whether algorithms can identify functionally equivalent regulatory elements across species despite sequence divergence. The IPP (interspecies point projection) algorithm demonstrated this capability by identifying up to fivefold more orthologous cis-regulatory elements than alignment-based approaches between mouse and chicken [4]. Functional validation through in vivo reporter assays further confirmed that these sequence-divergent orthologs maintained enhancer activity, demonstrating the power of advanced algorithms to reveal hidden conservation.
Key Findings and Comparative Performance Analysis
Performance Across Evolutionary Distances
Table 3: Algorithm Performance Across Evolutionary Distances
| Evolutionary Distance | Sequence Conservation Rate | Positional Conservation Rate | Recommended Algorithm Class | Key Findings |
|---|---|---|---|---|
| Close species (e.g., human-mouse) | ~50% promoters, ~10% enhancers [4] | Up to 65% promoters, 42% enhancers with IPP [4] | Information content-conservation optimization | TF binding specificities highly conserved; subtle dinucleotide preferences maintained [31] |
| Intermediate distance (e.g., human-chicken) | ~22% promoters, ~10% enhancers [4] | 65% promoters, 42% enhancers with IPP [4] | Synteny-based projection + conservation optimization | Extensive conservation of regulatory grammar despite sequence turnover [60] |
| Distant species (e.g., Drosophila-human) | Limited detection | Co-binding patterns and regulatory sentences conserved | Function conservation analysis | TF binding specificities conserved across 600 million years; novel specificities associated with novel cell types [31] |
Advanced algorithms have revealed remarkable conservation of TFBS properties across vast evolutionary distances that is largely invisible to traditional alignment-based methods. Between human and Drosophila, separated by over 600 million years of evolution, studies have found that almost all known motifs found in humans are recognized by fruit fly transcription factors, with conservation extending to secondary modes of binding and subtle dinucleotide preferences [31]. This conservation persists despite extensive rewiring of transcriptional regulatory networks that often confounds translation of findings between species [60].
The expansion of TF families in different lineages represents a key factor in regulatory evolution. While core binding specificities remain largely conserved, species-specific expansions of particular TF families create novel regulatory possibilities. For example, studies in plants have identified a constrained vocabulary of 74 conserved motifs spanning 50 TF families, with some families showing high conservation across 450 million years while others, like the C2H2 zinc finger family, display substantial diversity [59]. These family-specific patterns of conservation and divergence highlight the complex interplay between constraint and innovation in regulatory evolution.
Performance Metrics and Benchmarking
Comparative analyses have quantified the performance advantages of advanced algorithms over traditional approaches. The IPP algorithm demonstrated a fivefold increase in ortholog detection for enhancers between mouse and chicken compared to alignment-based methods, expanding the identifiable conserved regulatory elements from 7.4% to 42% [4]. This dramatic improvement highlights the limitations of sequence-based methods and the power of synteny-informed approaches.
In the assessment of TF binding models, which form the foundation of conservation analyses, manually curated models from JASPAR achieved superior performance with an average AUC of 0.83 on high-confidence datasets, compared to 0.76 for HT-SELEX models and 0.57 for PBM-derived models [40]. These differences underscore the importance of model quality in conservation studies, as inaccurate binding models propagate errors through subsequent evolutionary analyses.
The functional relevance of predictions represents the ultimate validation metric. Algorithms that integrate co-binding patterns and regulatory grammar show enhanced enrichment for disease-associated genetic variants, suggesting better identification of biologically meaningful elements [60]. For example, conserved TF-TF composite motifs identified through advanced algorithms show significant enrichment in cell-type-specific regulatory elements and are more likely to be formed between developmentally co-expressed TFs [26].
Visualization of Computational Workflows
Information Content-Conservation Optimization Workflow
Information Content-Conservation Optimization Algorithm Workflow
Genetic Algorithm for Composite Motif Discovery
Genetic Algorithm for Composite Motif Discovery
Table 4: Essential Research Reagents and Resources
| Resource Category | Specific Tools | Function | Application Notes |
|---|---|---|---|
| TF Binding Models | JASPAR, TRANSFAC, HT-SELEX models | Represent TF binding specificities as PWMs | JASPAR models show superior performance (AUC: 0.83) [40] |
| Experimental Data | ENCODE ChIP-seq, CAP-SELEX interaction data | Ground truth for validation and training | CAP-SELEX covers >58,000 TF pairs with composite motifs [26] |
| Genome Browsers | UCSC Genome Browser, ENSEMBL | Visualization of conservation and regulatory elements | Essential for interpreting cross-species conservation patterns |
| Multiple Alignment Tools | EPO, LiftOver, Cactus | Sequence alignment across species | Limited for distant species; synteny approaches superior [4] |
| Synteny Mapping | IPP Algorithm | Orthology detection independent of sequence similarity | Identifies 5x more orthologous enhancers than alignment [4] |
| Motif Discovery Tools | MEME, HOMER, DREME | De novo motif finding from sequences | Foundation for building species-specific binding models |
| Functional Annotation | GREAT, DAVID, GO | Biological interpretation of conserved elements | Links conserved sites to regulatory functions and diseases |
Advanced computational algorithms have fundamentally transformed our understanding of transcription factor binding site conservation, revealing extensive functional conservation that persists despite rapid sequence evolution. Information content-conservation optimization approaches provide a robust framework for distinguishing functionally constrained sites from neutral evolution, while genetic algorithms enable the discovery of complex composite motifs that expand the regulatory vocabulary. Synteny-based methods like IPP overcome the limitations of traditional alignment approaches, dramatically increasing the detection of orthologous regulatory elements across distant species.
The integration of these computational approaches with high-throughput experimental methods has revealed remarkable conservation of TF binding specificities across hundreds of millions of years of evolution, with changes primarily associated with the emergence of novel cell types and functions. Future developments will likely focus on the integration of three-dimensional genomic architecture, single-cell resolution data, and more sophisticated models of cooperative binding to further enhance our understanding of regulatory evolution. As these methods continue to mature, they will increasingly enable the translation of regulatory insights across species, accelerating biomedical research and therapeutic development.
Overcoming Computational Challenges: Reducing False Positives and Improving Specificity
The identification of transcription factor binding sites (TFBS) through computational motif scanning is a foundational technique in molecular biology, essential for deciphering the regulatory code that controls gene expression. This process typically involves searching DNA sequences with models of TF binding specificity, most commonly represented by position weight matrices (PWMs) [57] [61]. Despite its widespread use, this approach is fundamentally limited by a high false-positive rate that severely constrains its predictive accuracy and reliability. Detection of false-positive motifs remains one of the main causes of low performance in de novo DNA motif-finding methods, with comprehensive benchmarks revealing that the performance of DNA motif-finders leaves substantial room for improvement in realistic scenarios [62] [63]. This false-positive problem is particularly acute in comparative genomics and cross-species conservation studies, where distinguishing truly conserved functional elements from randomly occurring sequence similarities becomes statistically challenging.
The core of the problem lies in the biological nature of TF binding specificity combined with the statistical properties of large genomic sequences. Transcription factors typically recognize short (6-20 bp), degenerate DNA sequences, and this low information content means that similar patterns frequently occur by chance alone in large eukaryotic genomes [62] [61]. When the dataset is large enough, motifs with strength similar to real transcription factor binding motifs begin to occur by chance, creating what has been termed the "twilight zone search" where the probability of observing random motifs with higher scores than real motifs becomes non-negligible [62]. This fundamental limitation affects virtually all applications of motif scanning, from the analysis of individual regulatory regions to genome-wide surveys of putative binding sites, and presents particular challenges for evolutionary studies seeking to identify conserved regulatory elements across species.
Theoretical and Statistical Foundations of the False-Positive Problem
The Statistical Nature of False Positives
The false-positive problem in motif scanning is not merely a technical artifact but rather stems from fundamental statistical principles governing pattern occurrence in biological sequences. Using large-deviations theory, researchers have derived a remarkably simple relationship that describes the dependence of false positives on dataset size for the motif-finding problem. This theoretical framework predicts that false positives can be reduced by decreasing the sequence length or by adding more sequences to the dataset, but reveals a crucial nonlinear relationship: the false-positive strength depends more strongly on the number of sequences in the dataset than it does on the sequence length, but this dependence diminishes after a certain point, meaning that adding more sequences beyond this does not significantly reduce the false-positive rate [62] [63].
The theoretical basis for understanding false positives employs Sanov's theorem from large-deviations theory to measure an upper bound on the probability of rare events where a PWM appears significantly different from the background distribution by chance alone [62]. According to the Law of Large Numbers, the distribution of any motif generated by sampling from a background distribution should be arbitrarily close to the background; therefore, observing a motif with a position weight matrix that is significantly different from the background is extremely unlikely under the null hypothesis of randomly generated sequences [62]. This statistical framework explains why seemingly strong candidate motifs are frequently identified even when randomly chosen sequences are provided as input to motif-finding algorithms.
Information-Theoretic Limitations
The information-theoretic principles underlying TF binding specificity further compound the false-positive challenge. The degeneracy of transcription factor binding motifs means they have relatively low information content, making them difficult to distinguish from random sequences that match by chance. This limitation was presciently described in the "Futility Theorem," which stated that given a known binding motif, identification of bona fide examples is always plagued by false positives [62]. This theorem has since been extended to the de novo motif-finding problem, suggesting fundamental limits on our ability to identify regulatory elements based on sequence information alone.
The Kullback-Leibler (KL) divergence, which measures the difference between the distribution of the motif represented by the position weight matrix and the background distribution, serves as a key metric for motif strength and specificity [62]. Also referred to as information content, this quantity is central to understanding the false-positive problem because motifs with higher information content are less likely to occur by chance, while those with lower information content (characteristic of many real biological motifs) are more likely to generate false positives. The relationship between motif strength and false-positive occurrence follows a predictable mathematical pattern that can be quantified using large-deviations theory [62].
Empirical Evidence: Benchmarking Studies and Performance Metrics
Comprehensive Benchmarking Reveals Widespread Limitations
Recent comprehensive benchmarking studies have provided empirical validation for the theoretical concerns about false positives in motif scanning. An all-against-all benchmarking study of PWM models for DNA binding sites of human TFs on a large compilation of in vitro (HT-SELEX, PBM) and in vivo (ChIP-seq) binding data revealed critical limitations in current approaches [64]. This large-scale analysis computed more than 18 million performance measure values for different PWM-experiment combinations and observed that the best performing PWM for a given TF often belongs to another TF, usually from the same family, indicating significant cross-reactivity in motif predictions [64].
The benchmarking protocols employed various performance measures to assess motif scanning accuracy, including:
- Central motif enrichment in ChIP-seq peak regions, computed with tools like CentriMo
- Area under the curve of the receiver operating characteristic (AUC ROC)
- Precision-recall curves
- Sum occupancy scores for computing inclusive binding scores for longer DNA sequences
These analyses revealed that thousands of PWMs for human TFs are available from public databases, but eliminating suboptimal PWMs reduces this number to a few hundred while substantially increasing the average performance of the remaining matrices [64]. This highlights the critical importance of quality over quantity in motif databases and the need for rigorous benchmarking to identify reliable models for accurate motif scanning.
Table 1: Performance Comparison of Motif Scanning Approaches
| Method Category | Representative Tools | Strengths | False-Positive Challenges |
|---|---|---|---|
| PWM Scanning | FIMO, Patser, MotifScanner | Statistical rigor, interpretability, well-established | High false positives in genomic scans, biased by PWM length/complexity |
| K-mer-based Classifiers | gkmSVM, LS-GKM | Can discover novel patterns, no prior motif knowledge required | Require additional motif annotation, limited interpretability |
| Deep Learning Models | DeepSEA, DanQ, Enformer | Can learn long-range dependencies, high predictive accuracy | Computationally intensive, require large training datasets, difficult to interpret |
| Ensemble/Machine Learning | BOM, XGBoost | Captures combinatorial contributions, computationally efficient | Depends on quality of input motif annotations |
Quantitative Assessment of False-Positive Rates
The false-positive problem manifests differently across various motif scanning applications and experimental contexts. When scanning the human genome with a motif for CTCF, a highly conserved zinc finger DNA-binding protein, the FIMO tool identified 8,647 candidate binding sites with a q-value threshold of < 0.05, but precision-recall analysis revealed that the absolute precision was low [65]. This observation underscores two key aspects of the false-positive problem: first, a single motif lacks sufficient information to reliably scan an entire eukaryotic genome with high precision; and second, motif scanners identify many bona fide binding sites that are not active in the particular cell type being studied, which may be misinterpreted as false positives in cell-type-specific analyses [65].
The Bag-of-Motifs (BOM) framework, which represents distal cis-regulatory elements as unordered counts of transcription factor motifs combined with gradient-boosted trees, demonstrates an approach to mitigating false positives through integrated modeling. When this minimalist representation was tested for classifying cell-type-specific enhancers, the model showed a false-positive rate of 0.01–0.29 when tested with negative sequences that flank cis-regulatory elements (±2 kb) [17]. This range illustrates how false-positive rates can vary significantly depending on the specific biological context and the quality of the training data.
Cross-Species Applications: Exacerbating Factors in Evolutionary Studies
The Sequence Conservation Paradox
The false-positive problem becomes particularly pronounced in cross-species studies of transcription factor binding site conservation. A fundamental challenge in evolutionary genomics is that developmental gene expression is remarkably conserved across large evolutionary distances, yet most cis-regulatory elements lack obvious sequence conservation, especially at larger evolutionary distances [4]. For example, when comparing mouse and chicken embryonic hearts at equivalent developmental stages, researchers found that fewer than 50% of promoters and only approximately 10% of enhancers showed sequence conservation using standard alignment-based methods [4].
This "sequence conservation paradox" creates ideal conditions for false positives in motif scanning because the absence of sequence conservation does not necessarily indicate the absence of functional conservation. When regulatory elements undergo sequence divergence while maintaining function, standard motif scanning approaches generate both false positives (identifying conserved motifs that are nonfunctional) and false negatives (failing to identify functional but diverged motifs). This problem is exacerbated by rapid turnover of noncoding sequences that limits the effectiveness of pairwise alignments, particularly in distantly related species [4].
Synteny-Based Approaches for Improved Orthology Detection
Novel computational approaches that move beyond simple sequence alignment have demonstrated promising alternatives for identifying conserved regulatory elements while mitigating false positives. The Interspecies Point Projection (IPP) algorithm uses synteny rather than direct sequence alignment to identify orthologous genomic regions independent of sequence divergence [4]. This approach assumes that any non-alignable element in one genome located between flanking blocks of alignable regions would be located at the same relative position in another genome, allowing for interpolation of element position relative to adjacent alignable anchor points.
When applied to the mouse-chicken comparison, IPP increased the identification of putatively conserved CREs substantially—positionally conserved promoters increased more than threefold (from 18.9% to 65%) and enhancers more than fivefold (from 7.4% to 42%) compared to alignment-based methods alone [4]. These "indirectly conserved" elements exhibited chromatin signatures and sequence composition similar to sequence-conserved CREs but showed greater shuffling of transcription factor binding sites between orthologs, which prevents their detection through sequence alignment but not necessarily their functional conservation [4].
Table 2: Conservation of Regulatory Elements Between Mouse and Chicken Embryonic Hearts
| Element Type | Sequence-Conserved (LiftOver) | Positionally Conserved (IPP) | Fold Improvement with IPP |
|---|---|---|---|
| Promoters | 18.9% | 65% | 3.4x |
| Enhancers | 7.4% | 42% | 5.7x |
Methodological Approaches to Reduce False Positives
Experimental Protocols for Validation
To address the false-positive challenge, researchers have developed sophisticated experimental protocols that integrate multiple data types to validate computational predictions. The Integrated analysis of Motif Activity and Gene Expression changes of transcription factors (IMAGE) method provides precise prediction of causal transcription factors based on transcriptome profiling and genome-wide maps of enhancer activity [66]. This approach obtains high precision by combining a near-complete database of PWMs with a state-of-the-art method for PWM scoring and a novel machine learning strategy that uses both enhancers and promoters to predict the contribution of motifs to transcriptional activity [66].
The critical innovation in IMAGE and similar approaches is the integration of multiple data types to constrain predictions and reduce false positives. By requiring that predicted binding events correlate with changes in enhancer activity and gene expression, these methods can distinguish functional binding sites from random motif occurrences that lack biological activity. When applied to adipocyte differentiation, IMAGE demonstrated higher confidence prediction of causal transcriptional regulators compared to existing methods [66].
Advanced Motif Discovery and Scanning Techniques
Beyond simple PWM scanning, several advanced computational approaches have been developed to mitigate the false-positive problem:
Uniform P-value-based thresholds: Traditional log-likelihood scoring schemes for PWM matching are biased by the length and complexity of PWMs, meaning that a single log-likelihood threshold where all PWMs predict binding sites with maximum sensitivity and specificity does not exist [66]. Alternative methods for scoring of PWM matches using uniform P-value-based thresholds can reduce this bias and improve comparability across different motifs.
All-against-all benchmarking: This approach tests PWMs against experimental data for both matching and non-matching TFs, helping to identify the best performing PWMs for each factor irrespective of their original annotation and addressing the fact that TFs from the same family often have identical or very similar binding specificities [64].
Multi-task deep learning: Frameworks like deepTFBS use multi-task deep learning and transfer learning to build robust DNA language models of TF binding grammar, leveraging knowledge learned from large-scale TF binding profiles to enhance prediction of TFBS under small-sample training and cross-species prediction tasks [50]. When tested on 359 Arabidopsis TFs, deepTFBS outperformed PWM, deepSEA and DanQ with a 244.49%, 49.15%, and 23.32% improvement of the area under the precision-recall curve, respectively [50].
Diagram 1: An integrated workflow for reducing false positives in motif scanning combines statistical correction with experimental validation. This multi-step approach addresses the limitations of simple PWM scanning by incorporating multiple testing correction, integration with experimental data, and functional validation.
Research Reagent Solutions and Experimental Tools
Table 3: Essential Research Reagents and Computational Tools for TFBS Analysis
| Resource Type | Examples | Primary Function | Considerations for False Positives |
|---|---|---|---|
| Motif Scanning Software | FIMO, MEME Suite, Patser, MotifScanner | Scan DNA sequences for TFBS matches | Vary in statistical methods, background models, and multiple testing correction approaches |
| Motif Databases | JASPAR, CIS-BP, HOCOMOCO, HOMER | Provide curated PWMs for known TFs | Quality varies significantly; benchmarking-based selection recommended |
| High-Throughput Binding Assays | ChIP-seq, HT-SELEX, PBM | Generate experimental TF binding data | ChIP-seq cannot distinguish direct/indirect binding; HT-SELEX provides in vitro specificity |
| Chromatin Profiling | ATAC-seq, DNase-seq, Hi-C | Identify accessible chromatin regions | Provides genomic context to prioritize motif hits in accessible regions |
| Functional Validation | Reporter assays, CRISPRi/a, STARR-seq | Test enhancer activity of predicted elements | Essential for confirming functional impact of predicted binding sites |
The high false-positive rate in simple motif scanning represents a fundamental challenge in computational biology that transcends specific tools or algorithms and stems from the statistical properties of biological sequences combined with the degenerate nature of transcription factor binding specificity. While theoretical frameworks have quantified the relationship between sequence search space and motif-finding false positives, and benchmarking studies have empirically documented the scope of the problem, complete solutions remain elusive.
Promising future directions include the development of integrated models that combine sequence information with chromatin architecture, epigenetic modifications, and three-dimensional genomic organization to better distinguish functional binding sites from random occurrences. Methods that leverage synteny and comparative genomics beyond simple sequence alignment, such as the IPP algorithm, demonstrate how evolutionary information can be harnessed to identify conserved regulatory function in the absence of sequence conservation [4]. Similarly, multi-task deep learning approaches that transfer knowledge from well-characterized systems to species with limited experimental data show potential for improving cross-species prediction while controlling false discovery rates [50].
As the field progresses, the critical importance of rigorous benchmarking, statistical carefulness, and integration of complementary data types will continue to grow. No single approach is likely to fully resolve the false-positive problem, but through thoughtful combination of computational and experimental methods, researchers can increasingly distinguish true biological signal from statistical noise in the complex landscape of transcriptional regulation.
Within the broader context of evaluating transcription factor binding site (TFBS) conservation across species, the selection of an accurate binding model is a foundational step. The binding specificity of transcription factors (TFs) is commonly represented by position-specific scoring matrices (PSSMs), also known as position weight matrices (PWMs) [67] [68]. These models are critical for predicting in vivo binding sites and for assessing the functional impact of genetic variants in regulatory sequences. However, these models are derived using diverse experimental methods, and their performance in predicting biologically verified binding events varies significantly. This guide provides an objective, data-driven comparison of three primary sources of TF binding models—JASPAR, HT-SELEX, and Protein Binding Microarrays (PBMs)—to assist researchers in selecting the most appropriate resource for their studies on gene regulation and evolution.
A systematic, large-scale study conducted in 2016 provides direct performance comparison, evaluating 179 binding models from the three sources on their ability to detect experimentally verified "real" in vivo TFBSs from ENCODE ChIP-seq data [67]. The performance was assessed using Receiver Operating Characteristic (ROC) analysis, with the Area Under the Curve (AUC) serving as the key metric. A higher AUC indicates a better ability to distinguish true binding sites from negative control sequences.
Table 1: Overall Performance of Binding Models from Different Sources
| Model Source | Number of Models Tested | Average AUC (All Sites) | Average AUC (High-Confidence Sites) | Percentage of Models with AUC ≥0.7 |
|---|---|---|---|---|
| JASPAR | 58 | 0.72 | 0.83 | 60% |
| HT-SELEX | 102 | 0.70 | 0.76 | 46% |
| PBM (hPDI) | 19 | 0.53 | 0.57 | 16% |
Table 2: Direct Comparison for 26 Shared Transcription Factors
| Model Source | Average AUC (All Sites) | Average AUC (High-Confidence Sites) |
|---|---|---|
| JASPAR | 0.74 | 0.84 |
| HT-SELEX | 0.70 | 0.80 |
The data lead to two key conclusions. First, manually curated models from JASPAR and HT-SELEX-derived models are substantially more successful than PBM-derived models at recognizing in vivo TFBSs [67]. Second, when directly compared for the same TFs, JASPAR models consistently show a slight performance advantage over HT-SELEX models [67]. This performance hierarchy provides a critical guideline for researchers aiming to maximize prediction accuracy.
Experimental Protocols and Methodologies
The performance differences between JASPAR, HT-SELEX, and PBM models are rooted in their underlying experimental and data-processing methodologies.
JASPAR: Manually Curated Models
JASPAR is an open-access database of curated, non-redundant TF binding profiles [69]. Its performance advantage is attributed to two main factors. First, the JASPAR CORE database consists of profiles derived from published collections of experimentally defined TFBSs for eukaryotes [69]. Second, and crucially, it is a manually curated resource, which implies expert oversight in model construction. Notably, nearly all JASPAR matrices used in the comparative study were based on in vivo ChIP-seq data, which may enhance their ability to predict other in vivo binding sites [67]. JASPAR provides a web tool for extracting predicted TFBSs that intersect with user-defined genomic regions, facilitating practical application [70].
HT-SELEX: High-Throughput In Vitro Selection
High-Throughput Systematic Evolution of Ligands by EXponential Enrichment (HT-SELEX) is a powerful in vitro technique for determining TF binding specificities [71]. The protocol involves several rounds of selection and amplification. A TF is incubated with a vast, random library of double-stranded DNA oligonucleotides. The protein-DNA complexes are purified, and the bound DNA is sequenced and amplified for the next selection cycle [71] [72]. This process enriches sequences with high affinity for the TF.
The following diagram illustrates the HT-SELEX workflow:
A key strength of HT-SELEX is its unbiased nature, as it uses random oligonucleotides to explore a wide sequence space, potentially revealing novel or extended binding motifs [72]. A large-scale study in 2013 used HT-SELEX to determine the binding specificities of 239 human TFs, greatly expanding the coverage of the human TF repertoire and revealing dimeric binding sites and the influence of adjacent bases on binding [72].
Protein Binding Microarrays (PBM)
The Protein Binding Microarray (PBM) is another in vitro technology designed for high-throughput characterization of TF-DNA interactions [73]. In a PBM experiment, a purified, epitope-tagged TF is bound directly to a double-stranded DNA microarray spotted with thousands of potential DNA binding sites. After washing, the bound protein is detected with a fluorophore-conjugated antibody against the tag [73]. The resulting fluorescence intensities are used to determine the binding site motif for the TF.
While PBM is a high-throughput method that avoids the complexities of cellular context, the binding models derived from it have generally shown lower accuracy in predicting in vivo ChIP-seq binding sites compared to the other two methods [67]. A 2014 independent comparison noted that while PBM-based k-mer ranking was accurate, models derived from HT-SELEX predicted in vivo binding better [74].
The Scientist's Toolkit: Key Research Reagents
The following table details essential reagents and materials used in the featured experimental protocols for determining TF binding models.
Table 3: Essential Research Reagents and Materials
| Reagent / Material | Experimental Use | Function and Importance |
|---|---|---|
| Purified DNA-Binding Protein | HT-SELEX, PBM | The core reagent. Often expressed with an affinity tag (e.g., His, GST) for purification and detection [71] [73]. |
| Random DNA Oligo Library | HT-SELEX | A synthetic library of random double-stranded oligonucleotides that serves as the starting pool for selection [71]. |
| Double-Stranded DNA Microarray | PBM | The platform containing spotted DNA probes; the target for TF binding in PBM experiments [73]. |
| Phusion DNA Polymerase | HT-SELEX | A high-fidelity polymerase used for the amplification of bound DNA sequences between SELEX cycles [71]. |
| SYBR Green I / Anti-Tag Antibody | PBM | SYBR Green I stains dsDNA for normalization. A fluorophore-conjugated antibody detects the epitope-tagged bound TF [73]. |
| Ni Sepharose / Glutathione Beads | HT-SELEX, PBM | For immobilized metal affinity chromatography (IMAC) to purify recombinant His- or GST-tagged proteins [71]. |
| Laricitrin | Laricitrin | High Purity Flavonoid | For Research Use | Laricitrin, a bioactive flavonoid for plant & nutraceutical research. For Research Use Only. Not for human or veterinary diagnostic or therapeutic use. |
| Ciwujianoside D1 | Ciwujianoside D1 | Ciwujianoside D1 for research. Explore its potential neuroprotective & anti-inflammatory applications. For Research Use Only. Not for human consumption. |
Validation and Benchmarking Frameworks
The performance data presented in this guide are derived from rigorous benchmarking against experimentally verified in vivo binding sites. The primary validation method used in the seminal comparison study involved using TFBSs derived from ENCODE ChIP-seq data as positive controls, and random exonic sequences as negative controls [67]. This provides a biologically relevant test of model performance.
Independent, more recent evaluations confirm that the field continues to evolve. A 2024 study emphasized that while PWMs remain widely used, more complex models including hidden Markov models (HMMs) and deep learning approaches are being developed to improve accuracy [68]. Furthermore, a 2025 large-scale benchmarking initiative (GRECO-BIT) highlighted the importance of cross-platform validation, noting that a TF's binding specificity should ideally be studied using multiple experimental assays to overcome the technical biases inherent in any single method [75]. For researchers, this underscores the value of using models that have been validated against in vivo data, as is characteristic of the top-performing JASPAR resource.
Based on the consolidated experimental data:
- For the highest prediction accuracy of in vivo TF binding, JASPAR is the recommended resource due to its manual curation and strong performance metrics.
- HT-SELEX provides a powerful alternative, especially for discovering novel or extended binding motifs, given its unbiased, high-throughput nature.
- While valuable, PBM-derived models should be used with caution as the primary source for predicting *in vivo binding, given their systematically lower performance in benchmark studies.
For robust results in studies of TFBS conservation, researchers should prioritize models derived from JASPAR or high-quality HT-SELEX experiments. Furthermore, employing multiple TFBS prediction tools (e.g., FIMO, MCAST) that leverage these high-quality models can provide more reliable and comprehensive insights into the regulatory code across species [68].
Defining the optimal genomic window for promoter analysis is a fundamental challenge in gene regulation studies. Research demonstrates that an optimal promoter search space of ±5 kilobases (kb) from the transcription start site (TSS) provides the best balance for predicting transcription factor (TF) targets without significant loss of predictive power [76]. Beyond these boundaries, performance metrics show statistically significant degradation, guiding researchers in designing efficient and accurate genomic analyses [76]. This guide objectively compares regional sizing strategies and their performance implications for identifying functional regulatory elements.
Promoter regions contain crucial cis-regulatory elements that control transcriptional initiation, but their distribution across the genome varies significantly. While core promoters traditionally encompass regions immediately upstream of TSSs, modern genomics reveals that functional regulatory elements can be distributed across much broader regions. Defining the optimal search space is essential for balancing computational efficiency with predictive sensitivity in identifying bona fide TF binding sites. This evaluation examines empirical evidence supporting specific promoter boundaries that maximize discovery of regulatory elements while maintaining statistical rigor in predictions.
Experimental Evidence for ±5 kb Optimal Promoter Size
Key Findings from Systems Biology Research
Researchers at the Institute for Systems Biology conducted systematic empirical testing to define optimal promoter boundaries for TF-target gene predictions [76]. Their methodology fixed core promoter boundaries and progressively expanded upstream and downstream regions, measuring performance degradation using receiver operating characteristic area under curve (ROC AUC) metrics with ChIP-seq data as the gold standard [76].
Performance Metrics for Various Promoter Sizes:
| Promoter Boundary Variation | Direction | Boundary Tested | Performance Change | Statistical Significance (p-value) |
|---|---|---|---|---|
| Upstream Expansion | 5' | -1, -2.5, -5, -10, -20 kb | Significant decrease beyond -5 kb | 2.9 × 10⁻³ |
| Downstream Expansion | 3' | +1, +2.5, +5, +10, +20 kb | Significant decrease beyond +5 kb | 1.5 × 10⁻² |
The data demonstrates that the ±5 kb promoter window centered on the TSS represents the optimal compromise, as expanding further in either direction resulted in statistically significant reductions in both sensitivity and specificity for TF-binding site identification [76].
Experimental Protocol for Promoter Boundary Definition
The methodology for establishing these optimal boundaries involved:
Baseline Establishment: Using the core promoter region (±500 bp from TSS) as the reference point for performance metrics [76]
Incremental Expansion: Systematically testing expanded promoter regions by varying:
- Upstream (5') boundaries: -1, -2.5, -5, -10, and -20 kb from TSS
- Downstream (3') boundaries: +1, +2.5, +5, +10, and +20 kb from TSS
Performance Assessment: Comparing ROC AUC values for each expanded region against the core promoter baseline, with statistical testing to determine significant performance degradation [76]
Validation: Applying the optimized ±5 kb window to build a mechanistic TF regulatory network and demonstrating its utility in inferring causal TF networks in complex diseases like glioblastoma multiforme [76]
Cross-Species Conservation and Promoter Analysis
Sequence vs. Positional Conservation
While sequence conservation has traditionally guided identification of functional regulatory elements, recent research reveals that positional conservation often persists despite sequence divergence [4]. In comparative studies between mouse and chicken embryonic hearts, fewer than 50% of promoters and only ~10% of enhancers showed sequence conservation, yet functional conservation was much more widespread [4].
The IPP Algorithm for Enhanced Ortholog Detection
The Interspecies Point Projection (IPP) algorithm leverages synteny rather than sequence alignment to identify orthologous regulatory elements across distantly related species [4]. This approach identifies 3-5 times more conserved promoters and enhancers than alignment-based methods alone [4].
Experimental Workflow for Cross-Species Analysis:
- Data Collection: Generate chromatin and gene expression profiles from equivalent developmental stages across species (e.g., mouse E10.5 and chicken HH22 hearts) using ATAC-seq, ChIPmentation, RNA-seq, and Hi-C [4]
CRE Identification: Predict cis-regulatory elements using computational tools (e.g., CRUP) integrated with chromatin accessibility and gene expression data [4]
Anchor Point Establishment: Identify alignable genomic regions between species to serve as reference points [4]
Position Projection: Use IPP to interpolate positions of non-alignable elements relative to anchor points, classifying projections as:
- Directly conserved (DC): ≤300 bp from direct alignment
- Indirectly conserved (IC): >300 bp from direct alignment but <2.5 kb total distance to anchor points
- Non-conserved (NC): All other projections [4]
Advanced Computational Approaches for Promoter Analysis
Machine Learning and Deep Learning Applications
Modern promoter analysis increasingly leverages sophisticated computational approaches:
deepTFBS Framework: This deep learning system employs multi-task learning and transfer learning to improve TF binding site prediction within and across species [50]. When tested on 359 Arabidopsis TFs, it outperformed traditional position weight matrices by 244.49% in area under the precision-recall curve [50].
NLP-Inspired DNA Modeling: Some approaches treat DNA sequences as linguistic texts, using methods like FastText N-grams with deep neural networks to classify promoter sequences with up to 85.41% accuracy [77].
Benchmarking Promoter Prediction Tools
Systematic evaluation of bacterial promoter prediction tools reveals significant performance variations:
Performance Comparison of E. coli Promoter Prediction Tools:
| Tool | Methodology | Key Performance Characteristics |
|---|---|---|
| BPROM | Weight matrices + linear discriminant analysis | Lower performance compared to newer tools [78] |
| iPro70-FMWin | 22,595 feature extraction + logistic regression | Among best performance for most metrics [78] |
| CNNProm | Convolutional neural networks | High predictive power [78] |
| 70ProPred | SVM with trinucleotide tendencies | High predictive power [78] |
| iPromoter-2L | Not specified | High predictive power [78] |
Critical Computational Resources for Promoter Analysis:
| Resource | Type | Function | Relevance to Promoter Sizing |
|---|---|---|---|
| SEQSIM | Sequence comparison tool | Optimized Needleman-Wunsch algorithm for high-speed promoter comparisons [79] | Enables genome-wide promoter analysis in <1 hour [79] |
| deepTFBS | Deep learning framework | Predicts TF binding sites using multi-task and transfer learning [50] | Enhances cross-species prediction accuracy by 30.6% [50] |
| IPP Algorithm | Synteny-based ortholog detection | Identifies positionally conserved regulatory elements [4] | Reveals 3-5x more conserved promoters than alignment methods [4] |
| TRANSFAC Database | Position weight matrix database | Provides TF binding specificity models [80] | Essential for phylogenetic footprinting approaches [80] |
| Codebook Motif Explorer | Motif catalog & benchmarking | Curated motifs for 394 TFs with performance benchmarks [75] | Facilitates evaluation of motif discovery tools across platforms [75] |
Based on current evidence, the ±5 kb window around TSSs represents the optimal balance for comprehensive promoter analysis in human studies. This sizing captures the majority of functional regulatory elements while maintaining statistical power in predictions. For cross-species studies, combining sequence alignment with synteny-based approaches like IPP significantly enhances detection of functionally conserved promoters despite sequence divergence. Researchers should select promoter prediction tools based on recent benchmarking data, as performance varies considerably among available options. As deep learning approaches continue to advance, they offer promising avenues for further refining promoter analyses across diverse biological contexts and species.
Transcription factor binding site (TFBS) turnover describes the evolutionary process whereby functional TFBSs are gained and lost within cis-regulatory elements. This phenomenon represents a fundamental mechanism driving regulatory divergence and potentially contributing to the emergence of species-specific traits [81]. While traditional models often emphasized compensatory turnover (where the loss of one site is offset by the gain of another nearby, preserving regulatory function), growing evidence reveals that uncompensated gain and loss represents a substantial evolutionary pathway [56] [82]. Uncompensated changes alter the regulatory landscape without immediate counterbalance, potentially leading to shifts in gene expression that may underlie phenotypic innovation. Understanding the prevalence, mechanisms, and functional consequences of uncompensated binding-site turnover is thus crucial for a complete picture of regulatory evolution. This guide systematically compares key findings on TFBS turnover from pioneering yeast studies to recent mammalian work, providing a framework for evaluating evolutionary dynamics in gene regulation.
Quantitative Landscape of Binding-Site Turnover
Comparative Rates Across Evolutionary Models
Table 1: Quantitative Measures of TFBS Turnover Across Model Systems
| Organism/Species Comparison | Transcription Factor(s) | Rate of Uncompensated Loss | Rate of Gain | Key Experimental Method |
|---|---|---|---|---|
| Yeast (S. cerevisiae and related species) | 27 TFs of five families | ~50% of loss events are uncompensated [82] | >50% of S. cerevisiae binding sites are species-specific gains [82] | Allele-specific ChEC-seq in interspecific hybrid [56] |
| Fruit Fly (D. melanogaster and related species) | Zeste | >5% of functional sites gained or lost [81] | Significant net gain along the D. melanogaster lineage [81] | ChIP-chip & evolutionary modeling |
| Mice (Four closely related species) | FOXA1, CEBPA, HNF4A | Widespread divergence in TF binding intensity [83] | Independent evolution of binding and expression common [83] | Comparative ChIP-seq and RNA-seq |
| Human (Lineage-specific since human-mouse ancestor) | GATA1, SOX2, CTCF, MYC, MAX, ETS1 | ~58-79% of human binding sites are lineage-specific gains [11] | Over 15% of binding sites unique to hominids [11] | ChIP-seq & birth-death evolutionary model |
Key Concepts and Definitions
- Binding-Site Turnover: The evolutionary gain and loss of transcription factor binding sites within a regulatory sequence. This can occur with or without compensation [81].
- Uncompensated Gain/Loss: The addition or disappearance of a TFBS without a corresponding, counterbalancing change in a nearby site, potentially leading to a net change in regulatory function or output [56] [82].
- Compensatory Turnover: A process in which the loss of one binding site is offset by the gain of another site for the same transcription factor in the same regulatory region, thereby preserving the overall regulatory function [56].
The data in Table 1 reveals that uncompensated changes are not a minor anomaly but a major feature of regulatory evolution. In yeast, a foundational study found that nearly half of all binding site loss events were not explained by turnover [82]. In mammals, the scale of change is even more dramatic, with estimates suggesting that 58-79% of human binding sites for specific TFs were gained along the human lineage after divergence from mouse [11]. This indicates a highly dynamic regulatory genome where uncompensated changes are widespread.
Experimental Models and Methodologies for Detecting Turnover
Allele-Specific Binding in Interspecific Hybrids
Core Protocol: This approach involves creating an F1 hybrid by mating two closely related species (e.g., S. cerevisiae and S. paradoxus). The TF of one species is expressed in the hybrid nucleus, which contains both parental genomes. Chromatin Endonuclease Cleavage followed by sequencing (ChEC-seq) is then used to map the binding locations of the transcription factor across both alleles simultaneously [56].
Application to Turnover: This method directly compares TF binding to two different genomic sequences within an identical trans-cellular environment. This allows researchers to pinpoint differences in binding that are due solely to variations in the cis-regulatory sequences. It is particularly powerful for identifying cases of binding-site gain/loss and even subtle binding-site shifts (see Diagram 1) by controlling for trans-acting factors [56].
Diagram 1: Experimental workflow for allele-specific binding analysis in yeast hybrids.
Comparative ChIP-Seq in Multiple Species
Core Protocol: Chromatin Immunoprecipitation followed by sequencing (ChIP-seq) is performed for the same transcription factor in the homologous tissue or cell type across multiple related species (e.g., in livers of human, macaque, mouse, rat, and dog) [83] [10]. Orthologous genomic regions are identified, and binding intensities are compared.
Application to Turnover: This method reveals the evolutionary conservation and divergence of the TF binding landscape. By working across a defined phylogeny, researchers can infer the branch on which binding sites were gained or lost. A key finding from such studies is the frequent decoupling of TF binding and gene expression evolution, suggesting widespread uncompensated change that is tolerated or buffered by the regulatory network [83].
Synteny-Based Algorithms for Detecting Non-Conserved Elements
Core Protocol: Traditional methods rely on sequence alignment, which fails for highly diverged elements. The Interspecies Point Projection (IPP) algorithm uses synteny (conserved gene order) to identify orthologous genomic positions independent of sequence similarity. It interpolates the position of a cis-regulatory element (CRE) relative to flanking blocks of alignable regions, often using multiple "bridging" species to improve accuracy [84].
Application to Turnover: This approach has revealed a "hidden" layer of regulatory conservation, identifying up to five times more orthologous enhancers between mouse and chicken than alignment-based methods [84]. These "indirectly conserved" elements, despite having highly diverged sequences, show functional conservation and are characterized by greater shuffling of TFBSs between orthologs, providing a broader view of turnover dynamics across large evolutionary distances.
Mechanisms Driving Uncompensated Gain and Loss
Primary Role of cis-Sequence Variation
The most straightforward mechanism for TFBS turnover is mutation within the binding motif itself. In yeast hybrids, differential binding of TFs to orthologous alleles was well explained by variations that alter motif sequence, while differences in chromatin accessibility were of little apparent effect [56]. A single nucleotide change can abolish a binding site, leading to an uncompensated loss, or create a de novo site, resulting in an uncompensated gain.
Contribution of Repetitive Elements
Transposable elements (TEs) are a major source of lineage-specific TFBSs. Studies of human TFBS found that 7-10% of all mapped sites are derived from repetitive DNA, primarily TEs [85]. These TE-derived binding sites evolve extremely rapidly and are a hallmark of lineage-specific regulation. Because their insertion is often unique to a lineage, the binding sites they create are, by definition, uncompensated gains that can alter the regulatory network of that species [85] [11].
Epigenetic Influences: DNA Methylation
DNA methylation patterns co-evolve with TF binding. A comparative study in five mammals found that DNA methylation gain occurs upon the evolutionary loss of TF occupancy [10]. While many TFs bind in unmethylated regions, a significant number of binding events occur in regions with intermediate methylation. Specific DNA methylation patterns at TF binding regions characterize their function and evolutionary trajectory, suggesting DNA methylation is both a cause and consequence of binding site turnover [10].
Diagram 2: Mechanisms and functional consequences of uncompensated TFBS gain and loss.
The Scientist's Toolkit: Key Research Reagents and Solutions
Table 2: Essential Reagents and Resources for TFBS Turnover Research
| Reagent / Resource | Primary Function | Application Example |
|---|---|---|
| Interspecies Hybrid Cell Lines | Provides isogenic background for allele-specific binding studies | Yeast (S. cerevisiae x S. paradoxus) hybrid for profiling 27 TFs [56] |
| ChEC-seq Kit | Maps TF binding via MNase fusion protein and targeted cleavage | Mapping allele-specific binding in yeast hybrids with high spatial resolution [56] |
| Cross-Species ChIP-seq Antibodies | Immunoprecipitation of orthologous TFs across species | Profiling liver TFs (CEBPA, HNF4A, etc.) in human, macaque, mouse, rat, dog [10] |
| Whole-Genome Bisulfite Sequencing Kit | Profiles genome-wide DNA methylation at single-base resolution | Correlating DNA methylation patterns with TF binding evolution in mammalian liver [10] |
| Synteny-Based Algorithms (e.g., IPP) | Identifies orthologous genomic regions independent of sequence alignment | Discovering "indirectly conserved" enhancers between mouse and chicken [84] |
| Birth-Death Evolutionary Models | Traces lineage-specific gain/loss of TFBS without base-by-base alignment | Estimating 58-79% of human TFBS originated since human-mouse divergence [11] |
The evidence from diverse systems—from yeast and flies to mice and humans—converges on a model of regulatory evolution characterized by remarkable fluidity. Uncompensated gain and loss of TFBS is not an exception but a widespread feature of this dynamic landscape. While compensatory turnover occurs, a significant fraction, in some cases nearly half of all loss events, are uncompensated [82]. The high rate of lineage-specific binding site gains, particularly those derived from repetitive elements, further underscores the role of uncompensated changes in shaping species-specific regulatory networks [85] [11].
Future research will need to further elucidate the conditions under which uncompensated changes are tolerated, buffered, or harnessed for evolutionary innovation. The development of new computational tools, like synteny-based algorithms and birth-death models, combined with multi-omics profiling across broader phylogenetic ranges, will be essential to move beyond correlation and firmly establish the functional and phenotypic consequences of uncompensated binding-site turnover.
In comparative genomics, aligning non-coding genomic sequences to identify conserved transcription factor binding sites (TFBSs) presents a distinct challenge. These functional elements are typically short (5-20 base pairs) and degenerate, making them difficult to distinguish from background sequences using standard alignment algorithms [86]. The conservation of these regulatory elements across species indicates functional significance, but their correct alignment, especially between evolutionarily distant species, remains methodologically complex [87] [19]. This guide objectively compares four alignment tools—AVID, BLASTZ, LAGAN, and CONREAL—evaluating their performance, underlying algorithms, and applicability for TFBS conservation studies, supported by experimental data from the scientific literature.
Understanding the fundamental algorithmic strategies of each tool is crucial for selecting the appropriate method for a specific research context.
Table 1: Core Algorithmic Characteristics of Alignment Tools
| Tool | Alignment Type | Core Algorithmic Strategy | Key Technical Features |
|---|---|---|---|
| AVID | Global | Anchoring with maximum unique matches (MUMs) | Uses suffix trees to find MUMs; constructs a global map via recursive anchoring; can process draft sequences [88] [89]. |
| BLASTZ | Local | Gapped extension of high-scoring segment pairs (HSPs) | A specialized version of BLAST for aligning neutrally evolving sequences; ideal for finding local regions of similarity in non-coding DNA [90] [91]. |
| LAGAN | Global | Limited area global alignment | Uses CHAOS for sensitive local alignment with short, inexact words; builds a rough map and refines alignment with limited-area dynamic programming [92]. |
| CONREAL | Anchor-based | TFBS-guided alignment without prior sequence alignment | Uses Position Weight Matrices (PWMs) to predict TFBSs in sequences independently; anchors orthologous sequences based on conserved TFBSs to build the alignment [87] [93]. |
The following diagram illustrates the fundamental workflows for global alignment (AVID, LAGAN) and the unique TFBS-guided approach of CONREAL:
Performance Comparison and Experimental Data
Robustness to Transposable Element Insertions
A critical challenge in aligning genomic regions is handling transposable elements (TEs), which can be sources of regulatory innovation but often introduce alignment artifacts. A study evaluated the specificity of several aligners using 1,490 trios of human, mouse, and rat upstream non-coding sequences, using species-specific TEs (SSTEs) as negative controls since they should not align to orthologous regions [90].
Table 2: Specificity Performance with Species-Specific TEs
| Alignment Tool | Reported Specificity (Robustness to TE Insertions) |
|---|---|
| ReAlignerV | Higher specificity and robustness for sequences with >20% TE content [90] |
| BLASTZ | Lower specificity compared to ReAlignerV in TE-rich sequences [90] |
| LAGAN | Lower specificity compared to ReAlignerV in TE-rich sequences [90] |
| MAVID | Lower specificity compared to ReAlignerV in TE-rich sequences [90] |
| AVID | Lower specificity compared to ReAlignerV in TE-rich sequences [90] |
The study concluded that ReAlignerV (a tool based on similar principles) is successfully applicable to TE-rich sequences without pre-masking, increasing the chance of finding regulatory sequences within TEs [90].
Performance in Divergent Species and for TFBS Identification
Another key performance metric is the ability to correctly align regulatory regions across varying evolutionary distances. CONREAL was benchmarked against global aligners using a reference set of known functional sites [87].
Table 3: Performance Across Evolutionary Distance
| Tool | Performance with Closely Related Species (e.g., Human-Rodent) | Performance with Diverged Species (e.g., Human-Fugu) |
|---|---|---|
| CONREAL | Performs equally well, identifying conserved TFBSs [87] | Clear added value; identifies conserved TFBSs not found by other methods [87] [93] |
| LAGAN | Effective in aligning conserved regions [87] [92] | Performance decreases with increasing evolutionary distance [87] |
| AVID | Effective in aligning conserved regions [88] [87] | Performance decreases with increasing evolutionary distance [87] |
CONREAL's TFBS-anchored approach provides a significant advantage for divergent species where pure sequence-based alignment fails to correctly map short, degenerate binding sites [87]. LAGAN, while a global aligner, was specifically designed for improved accuracy with distant homologs compared to earlier tools, successfully aligning protein-coding exons between human and chicken or human and fugu [92].
Experimental Protocols for Tool Evaluation
The experimental data cited in this guide were generated through rigorous benchmarking protocols. The following workflow summarizes a typical evaluation process for alignment tools in the context of TFBS conservation:
Key Methodological Steps
- Reference Set Construction: The CONREAL evaluation used orthologous sequences from vertebrate organisms (human, rat, mouse, fugu, zebrafish) from the Ensembl database and built a reference set of experimentally verified regulatory sites from the TransFac database [87]. This provides a known standard against which to measure prediction accuracy.
- Specificity Testing with SSTEs: To evaluate false positives, researchers used Species-Specific TEs (SSTEs) as negative controls. Since SSTEs inserted after species divergence, a high-quality aligner should not align them to the orthologous counterpart, instead introducing a gap [90]. This directly tests an algorithm's robustness to non-functional insertions.
- Functional Validation: Confirming computational predictions with experimental evidence is crucial. One study tested the function of conserved and non-conserved predicted binding sites for yeast transcription factors Ume6 and Ndt80, demonstrating that sequence conservation is a reliable, but not exclusive, predictor of function [19].
Table 4: Key Resources for Alignment and TFBS Conservation Analysis
| Resource Name | Type | Primary Function in Analysis |
|---|---|---|
| TransFac Database | Database | Repository of curated transcription factors and their empirically determined Position Weight Matrices (PWMs), used for TFBS prediction [87]. |
| RepeatMasker | Software Tool | Identifies and masks low-complexity and repetitive elements in DNA sequences, often used as a pre-processing step to improve alignment specificity [90] [88]. |
| Match | Software Tool | A program that utilizes TransFac PWMs to search DNA sequences for potential TFBSs, providing annotation input for tools like ReAlignerV [90]. |
| Position Weight Matrix (PWM) | Data Model | A probabilistic model representing the nucleotide frequency at each position of a TFBS; used to scan genomes for potential binding sites [87] [19]. |
| Ensembl Database | Database | Provides access to annotated genome sequences for multiple species, essential for retrieving orthologous regions for comparative analysis [87]. |
The choice of an alignment strategy depends heavily on the biological question, the evolutionary distance between the species being compared, and the specific genomic region of interest.
- For closely related species (e.g., human-mouse) where the order of homologous features is conserved, global aligners like AVID and LAGAN are highly effective and efficient [88] [92] [89].
- For initial, high-speed local similarity searches in non-coding regions, BLASTZ remains a specialized and powerful tool [91].
- For the specific task of identifying conserved TFBSs, particularly when working with divergent species (e.g., human-fugu), CONREAL's strategy of using predicted binding sites as alignment anchors offers a clear advantage and can identify functional elements missed by other methods [87] [93].
- When studying genomic regions rich in transposable elements where the goal is to find regulatory innovations, tools like ReAlignerV that show higher robustness to TE insertions are recommended to avoid the loss of functional signals through repeat masking [90].
No single algorithm is optimal for all scenarios. Researchers should select a tool whose underlying assumptions and strengths are best aligned with their experimental goals, often employing a combination of these methods for comprehensive analysis.
Benchmarking and Functional Validation: From Prediction to Biological Relevance
Transcription factors (TFs) regulate gene expression by binding to specific DNA sequences, forming the basis of the gene regulatory code. Understanding TF-DNA interactions and TF-TF cooperativity is essential for unraveling the mechanisms controlling development, cell identity, and disease. This guide compares prominent experimental methods for validating these interactions, framing the discussion within the context of evaluating transcription factor binding site conservation across species. We objectively compare the performance, applications, and limitations of CAP-SELEX, reporter assays, and genetic interaction studies, providing researchers with the information needed to select appropriate methodologies for their specific investigations.
The following table summarizes the key characteristics, advantages, and limitations of each major method discussed in this guide.
| Method | Primary Application | Throughput | Key Strengths | Principal Limitations |
|---|---|---|---|---|
| CAP-SELEX [26] | Mapping TF-TF interactions & composite motifs | Very High (58,000+ pairs screened) | Identifies DNA-guided cooperativity; reveals spacing/orientation preferences | In vitro system may not fully recapitulate cellular environment |
| Reporter Assays (MPRA) [94] [95] | Functional validation of enhancer activity & TF specificity | High (86+ TFs in parallel) | Measures functional output; highly multiplexable; tunable design | Requires cloning; context may be artificial (plasmid-based) |
| Genetic Interactions (Knockout) [96] | In vivo validation of gene function in phenotypes | Medium (42 genes tested in study) | Provides direct physiological evidence; reveals GxE interactions | Low-throughput; may not mirror natural allelic variation |
Quantitative data from recent studies highlights the scale of these methods. A large-scale CAP-SELEX screen analyzed 58,754 TF-TF pairs, identifying 2,198 interacting pairs (1,329 with specific spacing/orientation preferences and 1,131 with novel composite motifs) [26]. Similarly, a systematic MPRA study optimized reporters for 86 TFs and identified a collection of 62 "prime" TF reporters with high sensitivity and specificity [94]. Genetic interaction studies, while lower in throughput, provide crucial in vivo validation; for example, a study of 42 candidate genes in Arabidopsis identified 16 genes with significant effects on adaptive traits like flowering time [96].
Detailed Experimental Protocols
CAP-SELEX for Mapping TF-TF Interactions
CAP-SELEX (Consecutive-Affinity-Purification Systematic Evolution of Ligands by Exponential Enrichment) is a high-throughput in vitro method designed to identify cooperative binding between transcription factor pairs on DNA [26].
Workflow Description: The protocol begins by expressing and purifying individual transcription factors. These TFs are then combined into pairs in a 384-well microplate format. Each TF-pair mixture is incubated with a complex library of random DNA sequences. TF-DNA complexes are subsequently isolated through consecutive affinity purification steps. After multiple rounds of selection (typically three cycles), the bound DNA is sequenced using high-throughput sequencing. Advanced computational algorithms, including mutual information analysis and k-mer enrichment comparison, are then applied to identify interacting TF pairs and their binding preferences [26].
Massively Parallel Reporter Assays (MPRAs)
MPRAs enable high-throughput functional testing of thousands of candidate regulatory sequences simultaneously to identify those with enhancer activity [95].
Workflow Description: The core process involves cloning a vast library of candidate DNA sequences into reporter vectors upstream of a minimal promoter and a reporter gene (e.g., GFP). This library is then delivered to cells (via transfection or electroporation). After giving time for expression, RNA is extracted and sequenced to quantify the abundance of each barcode, which reflects the transcriptional activity driven by each candidate sequence. The enrichment of specific barcodes in the RNA pool, compared to the input DNA library, identifies active regulatory elements [95]. A key advancement is Locus-Specific MPRA (LS-MPRA), which uses Bacterial Artificial Chromosomes (BACs) to generate complex, unbiased fragment libraries covering large genomic regions of interest [95].
Genetic Interaction Studies via Gene Knockouts
This approach tests the functional role of candidate genes, identified through genomic studies, by analyzing the phenotypic consequences of their disruption in a living organism [96].
Workflow Description: Researchers first select candidate genes based on prior evidence (e.g., Genotype-Environment Associations). For each candidate gene, a knockout line (e.g., using t-DNA insertions in Arabidopsis) is obtained or created. These mutant lines and wild-type controls are then grown under different environmental conditions (e.g., well-watered vs. drought). Key phenotypic traits (e.g., flowering time, fitness metrics) are measured and compared. A significant Genotype-by-Environment (GxE) interaction for fitness-related traits provides strong evidence that the gene contributes to local adaptation [96].
Research Reagent Solutions
The following table outlines essential reagents and their applications for implementing these experimental methods.
| Reagent / Tool | Primary Function | Application Context |
|---|---|---|
| TF Pairs Library [26] | Screening cooperative TF-TF-DNA interactions | CAP-SELEX |
| Reporter Vector Library [94] [95] | Multiplexed testing of regulatory element activity | MPRA (LS-MPRA & d-MPRA) |
| Bacterial Artificial Chromosomes (BACs) [95] | Source of large, contiguous genomic DNA for unbiased library generation | LS-MPRA |
| t-DNA Knockout Lines [96] | Disrupting gene function to test in vivo phenotypic effects | Genetic Interaction Studies |
| Barcode Sequences [95] | Tracking and quantifying individual library elements in a pool | MPRA |
| Minimal Promoter [95] | Providing a basal transcription start site for reporter constructs | MPRA |
Sensitivity and Specificity Comparisons
The sensitivity of methods to detect binding sites varies significantly. PADIT-seq, a recently developed technology, demonstrates exceptional sensitivity in identifying lower-affinity TF binding sites that are often missed by other in vitro methods like HT-SELEX [97]. In one study, PADIT-seq identified 46,279 active 10-mers for HOXD13 and 6,596 for EGR1, including many low-affinity sites. When compared to universal Protein Binding Microarrays (uPBMs), PADIT-seq showed strong concordance but extended detection to sites with uPBM E-scores as low as 0.3, which traditional analysis would typically disregard [97].
For predicting cell-type-specific regulatory activity, the Bag-of-Motifs (BOM) computational framework, which uses a minimalist representation of regulatory elements as unordered motif counts combined with gradient-boosted trees, has demonstrated remarkable performance. In benchmark tests, BOM achieved a mean area under the precision-recall curve (auPR) of 0.99, outperforming more complex deep-learning models like LS-GKM, DNABERT, and Enformer [17].
The choice of experimental method for validating transcription factor interactions depends heavily on the research question. CAP-SELEX excels in providing an unbiased, large-scale map of potential TF-TF cooperativity and the composite DNA motifs that facilitate these interactions [26]. Reporter assays (MPRAs) are powerful for functionally validating the transcriptional activity of regulatory sequences in a high-throughput manner [94] [95]. Finally, genetic interaction studies through gene knockouts provide the crucial link to in vivo function and phenotypic relevance, confirming the biological role of candidates identified by other methods [96].
For research focused on TF binding site conservation across species, an integrated approach is often most powerful. Initial broad discovery using sensitive in vitro methods like CAP-SELEX or PADIT-seq can be followed by functional validation in relevant cellular contexts using optimized MPRAs. Ultimately, key findings can be confirmed in vivo through genetic models, establishing the conservation and functional significance of regulatory mechanisms across evolutionary lineages.
Accurately predicting where transcription factors (TFs) bind to the genome is fundamental to understanding gene regulation. Position-specific scoring matrices (PSSMs), also called position weight matrices (PWMs), have long been the state-of-the-art method for representing TF binding preferences and computationally detecting putative transcription factor binding sites (TFBSs) [67]. However, the performance of these models in reliably identifying genuine in vivo binding sites remains a subject of systematic evaluation.
This guide objectively compares the performance of TF binding models from three major sources—JASPAR, HT-SELEX, and Protein Binding Microarrays (PBMs)—using Receiver Operating Characteristic (ROC) analysis against experimentally verified in vivo binding sites from the ENCODE project [67]. The findings provide a critical resource for researchers selecting appropriate models for regulatory genomics and interpreting the functional impact of non-coding genetic variants.
Experimental Design and Methodology
The large-scale comparison assessed 179 PSSMs linked to 82 different human TFs, sourced from three publicly available repositories [67]:
- JASPAR: A curated, open-access database of TF binding profiles. Nearly all 58 tested matrices (representing 56 TFs) were derived from in vivo ChIP-seq data [67].
- HT-SELEX: Models generated via High-Throughput Systematic Evolution of Ligands by Exponential Enrichment, an in vitro method that determines DNA binding specificity using large oligonucleotide libraries [67].
- PBM (hPDI): Models from the human Protein-DNA Interactome database, generated using Protein Binding Microarrays, another high-throughput in vitro technique [67].
Benchmarking Dataset Construction
To evaluate model performance, researchers constructed two primary datasets from ENCODE ChIP-seq data [67]:
- Positive Set: Experimentally confirmed "real" in vivo TFBSs. A "high-confidence" subset was also created, including only sites with strong ChIP-seq binding signals.
- Negative Set: Length-matched random downstream exonic sequences, which are statistically unlikely to harbor functional TFBSs.
Performance Assessment via ROC Analysis
The core analytical workflow involved scoring sequences from the positive and negative sets using each PSSM and performing ROC analysis. The Area Under the Curve (AUC) was used as the primary quantitative metric to assess each model's ability to discriminate between bound and unbound sequences [67].
The following diagram illustrates the complete experimental workflow:
Results & Performance Comparison
The study revealed considerable variation in the performance of models from different sources. The table below summarizes the key AUC-based performance metrics [67]:
| Model Source | % of Models with AUC ≥0.7 (All Data) | % of Models with AUC ≥0.7 (High-Confidence Data) | Average AUC (All Data) | Average AUC (High-Confidence Data) |
|---|---|---|---|---|
| JASPAR | 60% | Not Specified | 0.72 | 0.83 |
| HT-SELEX | 46% | 70% | Not Specified | 0.76 |
| PBM (hPDI) | 16% | 27% | 0.53 | 0.57 |
Head-to-Head Comparison of Shared TFs
For a direct comparison, researchers analyzed 28 TFs represented by models in both JASPAR and HT-SELEX. The results demonstrated that manually curated JASPAR matrices enabled slightly better discrimination between positive and negative sequences than HT-SELEX-derived models (average AUC of 0.74 vs. 0.70) [67]. This performance gap widened further when analyzing the high-confidence dataset, with JASPAR achieving an average AUC of 0.84 compared to 0.80 for HT-SELEX [67].
Advanced Modeling Approaches
While PSSMs are widely used, advanced computational frameworks can improve binding prediction accuracy:
- Support Vector Regression (SVR) Models: Machine learning models trained on high-resolution PBM data using sequence kernels can outperform traditional PSSMs and E-score methods for predicting probe intensity and in vivo occupancy from ChIP-seq experiments [98].
- Integrative Bayesian Models (CENTIPEDE): These methods combine motif information with cell-type-specific experimental data (e.g., DNase I hypersensitivity, histone modifications) and evolutionary conservation to accurately infer bound TF binding sites in a specific cellular context [99].
- Biophysical Models (STAP): This approach uses thermodynamic principles to model TF-DNA binding affinities, explicitly accounting for cooperative interactions between multiple TFs. It has shown greater predictive power than several state-of-the-art statistical methods [100].
The Scientist's Toolkit
The table below lists essential reagents and resources for performing similar benchmarking studies or TF binding predictions.
| Research Reagent / Resource | Function / Application |
|---|---|
| ENCODE ChIP-seq Data | Provides experimentally verified, genome-wide in vivo TF binding sites for benchmarking and validation [67]. |
| JASPAR Database | Source of curated, non-redundant TF binding profiles (PSSMs), primarily from ChIP-seq data [67]. |
| HT-SELEX Models | Source of in vitro derived TF binding models for factors where in vivo data may be limited [67]. |
| ROC Analysis | Statistical method for evaluating the diagnostic ability of a classifier (e.g., a PSSM) to distinguish between bound and unbound sequences [67]. |
| Position Weight Matrix (PWM) | The standard computational model representing the DNA binding preference of a transcription factor [67]. |
| ePOSSUM Web Application | An online tool that incorporates the study's findings to assess the impact of genetic variants on TF binding, providing reliability estimates [67]. |
This systematic comparison demonstrates that the source of a TF binding model significantly impacts its performance in predicting in vivo binding. JASPAR and HT-SELEX models generally outperform PBM-derived models, with JASPAR holding a slight edge in direct comparisons [67]. However, the overall performance (AUC <0.7 for many models) highlights the inherent challenge of predicting TF binding based on sequence motifs alone.
These findings are crucial for the broader thesis on TF binding site conservation. Accurate in silico models are a prerequisite for meaningful cross-species comparison. The demonstrated variability in model performance suggests that conservation analyses should prioritize the most reliable models to avoid misleading conclusions. Furthermore, the imperfect prediction accuracy underscores that sequence motif information is necessary but not sufficient, emphasizing the critical role of cell-type-specific chromatin context and cooperative TF interactions in determining functional binding outcomes [101] [99].
The non-coding regions of the genome harbor crucial regulatory sequences that control gene expression, with cis-regulatory modules (CRMs) representing genomic regions where multiple transcription factors (TFs) bind cooperatively to regulate target genes. Comparative genomic studies have revealed that while many CRMs evolve rapidly, a subset demonstrates significant evolutionary conservation, suggesting important functional roles [3]. In the context of human disease, conserved CRMs offer a valuable lens through which to identify functional regulatory variants, as these elements are often enriched near genes involved in critical biological pathways and have been implicated in disease pathogenesis through genome-wide association studies (GWAS) [21].
The liver serves as an exemplary model system for studying vertebrate gene regulation due to its relative cellular homogeneity and essential metabolic functions. Research has demonstrated that conserved CRMs in liver tissue are disproportionately associated with the regulation of genes involved in core hepatic pathways, including blood coagulation and lipid metabolism [3]. This guide systematically compares findings from key studies investigating conserved CRMs, with particular emphasis on their role in liver pathways and blood coagulation genes, providing researchers with experimental data, methodological insights, and practical resources for further investigation.
Comparative Analysis of CRM Conservation Across Studies
Table 1: Cross-Species Conservation of Transcription Factor Binding and CRMs
| Study & Organism | Transcription Factors Analyzed | Conservation Rate of CRM/TF Binding | Functional Associations of Conserved Elements |
|---|---|---|---|
| Ballester et al. (2014) [3] - Human, macaque, mouse, rat, dog | HNF4A, CEBPA, ONECUT1, FOXA1 | ~21-37% of TF binding events shared between human and other species; <50% of human CRMs conserved in orthologous regions | Liver pathways, blood coagulation cascade, lipid metabolism, GWAS variants for liver traits |
| GLK Study (2022) [36] - Tomato, tobacco, Arabidopsis, maize, rice | GOLDEN2-LIKE (GLK1, GLK2) | Most binding sites species-specific; conserved sites near photosynthetic genes | Photosynthetic genes dependent on GLK for expression |
| Pig Liver Epigenomics (2019) [102] - Pig, human, cattle | Core liver TRs identified by chromatin state | ~30% functionally conserved enhancers; ~54% consistent super-enhancer-associated genes | Metabolic processes, liver function |
| Common Bean Analysis (2025) [22] - Common bean, Vigna angularis, V. radiata, Glycine max | ERF, MYB, bHLH families (predicted) | Conservation assessed via promoter alignment of orthologs | Starch biosynthesis genes |
Table 2: Disease Associations of Conserved CRMs in Liver Tissue
| Disease/Condition | Genes with Conserved CRM Regulation | Type of Genetic Evidence | Potential Mechanism |
|---|---|---|---|
| Blood Coagulation Disorders | Multiple coagulation genes | Rare disease-causing mutations within CRMs shared across multiple species [3] | Disruption of combinatorial TF binding at conserved promoter elements |
| Type 2 Diabetes | PPARG2 | rs4684847 risk allele creates binding site for homeobox TF PRRX1 [103] | PRRX1 binding represses PPARG2 expression, affecting lipid metabolism and insulin sensitivity |
| Liver-Related Traits | Multiple liver function genes | GWAS variants enriched in CRMs found in >1 species [3] | Alteration of regulatory elements controlling tissue-specific gene expression |
Experimental Approaches for CRM Identification and Validation
Methodologies for Mapping CRMs Across Species
Cross-species identification of conserved CRMs relies on complementary experimental approaches that map TF binding and chromatin features genome-wide. Chromatin Immunoprecipitation followed by sequencing (ChIP-seq) represents the cornerstone method for determining in vivo TF binding locations. In the seminal liver CRM study, researchers performed ChIP-seq for four liver-essential TFs (HNF4A, CEBPA, ONECUT1, and FOXA1) in five mammalian species using antibodies raised against conserved epitopes [3]. This experimental design enabled direct comparison of combinatorial TF binding patterns across evolutionarily divergent species.
Additional methodologies provide orthogonal validation of CRM function. Histone modification profiling (H3K4me3 for promoters, H3K27ac for active enhancers and promoters) helps define chromatin states characteristic of active regulatory elements [102]. Assays for chromatin accessibility such as DNase I hypersensitivity sequencing and ATAC-seq identify open chromatin regions accessible for TF binding. Functional validation approaches include reporter gene assays to test enhancer activity and CRISPR-based genome editing to assess the functional consequences of disrupting specific CRM sequences.
Computational and Bioinformatics Strategies
Computational analyses are essential for identifying conserved CRMs from multi-species data. Orthologous region mapping establishes corresponding genomic regions across species, while motif enrichment analysis identifies statistically overrepresented DNA sequence patterns in bound regions. Machine learning approaches, such as k-mer based classifiers, have demonstrated high accuracy in predicting TF binding specificities across diverse species [36].
Comparative genomics pipelines leverage cross-species sequence alignment to detect evolutionary constrained elements. As demonstrated in the common bean study, promoter regions of orthologous genes can be systematically compared to identify conserved transcription factor binding sites (TFBS) using alignment tools like Minimap2 [22]. These computational approaches are particularly valuable for non-model organisms where extensive experimental data may be limited.
Signaling Pathways Involving Conserved CRMs in Liver Function
The regulatory logic of conserved CRMs in liver function can be visualized as a hierarchical network where combinatorial TF binding controls essential physiological pathways:
This diagram illustrates how combinatorial binding of liver master transcription factors at conserved CRMs regulates key hepatic pathways. Disease-associated genetic variants that disrupt these regulatory interfaces lead to altered gene expression and ultimately contribute to pathological states.
Research Reagent Solutions for CRM Studies
Table 3: Essential Research Reagents for Cross-Species CRM Analysis
| Reagent/Category | Specific Examples | Function/Application | Considerations |
|---|---|---|---|
| Antibodies | Anti-HNF4A, Anti-CEBPA, Anti-ONECUT1, Anti-FOXA1 [3] | Chromatin immunoprecipitation for TF binding mapping | Must recognize conserved epitopes across species; require species-specific validation |
| Histone Modification Antibodies | Anti-H3K4me3, Anti-H3K27ac [102] | Mapping active promoters and enhancers | Quality critical for signal-to-noise ratio in ChIP-seq |
| Motif Discovery Tools | MEME, HOMER, ChIPMunk, STREME, RCade [75] | Identify enriched DNA sequence patterns in bound regions | Performance varies by data type; cross-platform benchmarking recommended |
| Cross-Species Alignment Tools | LiftOver, Minimap2 [22] [102] | Map orthologous genomic regions between species | Mapping efficiency depends on evolutionary distance |
| Experimental Assay Kits | ChIP-seq kits, ATAC-seq kits, SELEX kits | Generate data on TF binding and chromatin accessibility | Platform choice affects resolution and specificity |
| Machine Learning Classifiers | k-mer grammar models [36] | Predict TF binding specificity from sequence features | Require training on high-quality experimental data |
Discussion and Research Implications
The comprehensive analysis of conserved CRMs across multiple species provides powerful insights into the functional genomic elements governing tissue-specific gene regulation and disease pathogenesis. Several key conclusions emerge from comparative studies: First, while TF binding sites generally exhibit rapid evolution, the subset that demonstrates conservation across species is disproportionately associated with essential biological functions and disease relevance [3] [21]. Second, conserved CRMs often regulate genes operating in coordinated pathways, as exemplified by the blood coagulation cascade in liver tissue [3]. Third, integrative analyses combining evolutionary conservation with empirical TF binding data enhance the identification of functional non-coding variants implicated in disease [103].
These findings have significant implications for drug development and therapeutic targeting. Understanding the regulatory architecture of disease genes may reveal new intervention points beyond protein-coding regions. Additionally, the demonstration that CRM disruption can affect entire functional pathways suggests potential strategies for modulating complex disease traits through master regulatory nodes. As single-cell multi-omics technologies advance and functional genomics resources expand across diverse species, researchers will gain unprecedented resolution into the evolutionary principles shaping gene regulatory networks in health and disease.
Future research directions should include expanding cross-species CRM analyses to additional tissue types and disease contexts, developing improved computational methods for predicting functional regulatory variants, and establishing high-throughput functional screening platforms to empirically validate CRM activity across cellular contexts and genetic backgrounds.
The conventional model of transcriptional regulation, centered on individual transcription factors (TFs) binding to specific DNA sequences, fails to explain the immense regulatory complexity of higher organisms. A single TF's DNA-binding specificity, represented by its core motif, is often shared among many related TFs, creating a "specificity paradox" where TFs with similar binding specificities execute distinct biological functions [26]. This paradox finds resolution in the emerging paradigm of transcription factor cooperativity—the ability of TFs to bind DNA cooperatively through specific protein-protein and protein-DNA interactions.
Cooperative binding enables a limited repertoire of TFs to generate an expanded regulatory lexicon, allowing for precise spatiotemporal control of gene expression during development, cellular differentiation, and environmental adaptation. This review comprehensively examines the mechanisms, experimental methodologies, and functional consequences of TF-TF interactions, highlighting how cooperative binding shapes regulatory complexity across biological systems and evolutionary timescales.
Core Mechanisms of Transcription Factor Cooperativity
DNA-Guided Cooperative Binding
DNA-guided cooperativity represents a widespread mechanism where the DNA molecule itself serves as a structural scaffold facilitating TF-TF interactions. Unlike pre-formed protein complexes, this mechanism involves TFs binding to adjacent sites on DNA, with the spatial arrangement dictating interaction specificity.
Structural Foundations: The geometric arrangement of binding sites imposes strict constraints on interaction possibilities. Systematic screening of over 58,000 TF-TF pairs revealed that interacting pairs typically bind with characteristic spacing and orientation preferences, with short distances (<5 bp) between characteristic 8-mer sequences being generally preferred [26]. These precise spatial arrangements create unique interfaces for TF-TF interactions that would not occur in solution.
DNA Shape Readout: Beyond specific base recognition, DNA shape features (including minor groove width, helix twist, and propeller twist) significantly contribute to cooperative binding. Statistical learning frameworks applied to CAP-SELEX data demonstrate that DNA shape features, particularly for Forkhead-Ets pairs, substantially improve predictions of cooperative binding compared to sequence-only models [104]. This shape-mediated cooperativity creates a biophysical basis for specific TF-TF interactions without requiring extensive protein-protein interaction surfaces.
Nucleosome-Mediated Positioning Effects
The packaging of DNA into nucleosomes significantly influences TF cooperativity by restricting accessibility and introducing structural constraints. Nucleosomes cover most of the genome and displace TFs from nucleosomal DNA, with the extent of inhibition varying dramatically between TFs [105]. However, this inhibition is not uniform—nucleosomes can also scaffold specific TF positioning:
- End Preference: Many TFs, particularly those with extensive DNA contact surfaces like bZIP and bHLH families, preferentially bind near nucleosome ends where DNA undergoes natural "breathing" and partial unwrapping [105].
- Periodic Positioning: Some TFs exhibit binding preferences at periodic positions along nucleosomal DNA corresponding to the solvent-exposed face of the DNA helix [105].
- Orientation Bias: The nucleosome breaks DNA's rotational symmetry, causing TFs like ETS and CREB bZIP factors to bind in specific orientations relative to nucleosome positioning [105].
Table 1: Classification of Transcription Factor Binding Preferences on Nucleosomal DNA
| Preference Type | Representative TF Families | Structural Basis | Genomic Manifestation |
|---|---|---|---|
| End Preference | bZIP, bHLH, C2H2 Zinc Fingers | Extensive DNA contact surface requiring accessibility | Binding at nucleosome entry/exit sites |
| Periodic Preference | Various | Alignment with solvent-exposed DNA face | Spaced binding at ~10 bp intervals |
| Dyad Preference | Specialized TFs | Recognition of single DNA gyre at dyad | Binding at nucleosome center |
| Cross-gyre Binding | T-box (Brachyury, TBX2) | Simultaneous contact with two DNA gyres | Motifs spaced ~80 bp apart |
Interface-Driven Molecular Interactions
At the molecular level, cooperative binding involves specific interfaces between TFs that can be classified into distinct mechanistic categories:
Direct Protein-Protein Contacts: Some TF pairs form stable interfaces through complementary surface features. For example, the TWIST1-homeodomain interactions in face and limb mesenchyme involve weak but specific TF-TF contacts that are guided by DNA sequence [106]. These interactions, while often weak individually, become significant in the context of DNA binding.
Composite Motif Formation: Cooperative binding can create entirely new DNA recognition specificities distinct from the individual TF binding preferences. Screening of TF-TF pairs identified 1,131 composite motifs that differed markedly from the motifs of individual TFs [26]. These novel specificities expand the regulatory vocabulary beyond what would be predicted from individual TF binding profiles.
Stabilization Through Neighboring Sites: Even without direct protein-protein contacts, binding of one TF can stabilize adjacent TF binding through nucleosome displacement or chromatin remodeling. This indirect cooperativity enables TFs to access sites that would otherwise be occluded by chromatin structure.
Experimental Approaches for Mapping TF-TF Interactions
High-Throughput In Vitro Methods
In vitro approaches provide controlled environments for precisely characterizing binding specificities and interaction parameters without confounding cellular factors.
CAP-SELEX (Consecutive Affinity-Purification Systematic Evolution of Ligands by Exponential Enrichment): This high-throughput method enables simultaneous identification of individual TF binding preferences, TF-TF interactions, and the DNA sequences bound by interacting complexes [26]. The adapted 384-well microplate format has enabled screening of over 58,000 TF-TF pairs, identifying 2,198 interacting pairs with specific spacing, orientation preferences, or composite motifs [26].
NCAP-SELEX (Nucleosome Consecutive Affinity-Purification SELEX): An extension of CAP-SELEX that incorporates nucleosomal DNA instead of free DNA, enabling systematic exploration of TF interactions with nucleosome-bound DNA [105]. This method has revealed how nucleosomes restrict TF access while enabling new binding modes not possible on free DNA.
Protein Binding Microarrays (PBMs): DNA microarrays containing double-stranded oligonucleotides allow high-throughput profiling of TF binding specificities. Recent advances include "universal" PBMs that represent all possible 10-mer sequences, enabling comprehensive binding characterization without prior knowledge of preferred sequences [107].
Table 2: Comparison of Major Experimental Methods for Studying TF-TF Interactions
| Method | Throughput | Data Type | Resolution | Key Applications | Limitations |
|---|---|---|---|---|---|
| CAP-SELEX | High (58,000+ pairs screened) | Binding specificity, cooperativity, composite motifs | Nucleotide resolution | Global TF-TF interactome mapping | In vitro context only |
| ChIP-seq | Medium | In vivo binding sites, genomic context | 100-500 bp | Genome-wide binding profiles in cellular contexts | Cannot distinguish direct/indirect interactions |
| HT-SELEX | High | Binding specificity, relative affinity | Nucleotide resolution | Individual TF motif discovery | Does not capture cooperativity |
| PBM | High | Binding specificity, relative KD | Nucleotide resolution | Comprehensive binding site characterization | Limited to in vitro context |
| MITOMI | Low | Absolute KD, kon, koff kinetics | Nucleotide resolution | Quantitative binding parameters | Low throughput |
In Vivo Validation Approaches
While in vitro methods provide detailed biochemical characterization, in vivo approaches establish the biological relevance of TF-TF interactions:
ChEC-seq (Chromatin Endonuclease Cleavage followed by sequencing): This method involves fusing TFs to micrococcal nuclease, enabling high-resolution mapping of TF binding locations in vivo through targeted DNA cleavage [56]. Applied to interspecies hybrids, ChEC-seq has revealed how sequence variations affect allele-specific TF binding.
Allele-Specific Binding Analysis: By examining TF binding in hybrid systems containing two related genomes (e.g., S. cerevisiae × S. paradoxus), researchers can directly associate sequence variations with differences in TF binding while controlling for trans-regulatory effects [56]. This approach has demonstrated that motif sequence variations, rather than chromatin accessibility differences, primarily explain differential TF binding between alleles.
Functional Validation: Cooperative binding predictions require validation through genetic and functional assays. For example, site-specific mutagenesis of interface residues in Forkhead-Ets pairs demonstrated decreased cooperativity, confirming the structural basis of interactions [104]. Similarly, TWIST1-homeodomain cooperativity was validated through CRISPR-mediated perturbation in embryonic mesenchyme [106].
Computational and Structural Approaches
Statistical Learning Frameworks: Machine learning approaches applied to SELEX data can identify DNA features that predict cooperative binding. These models incorporate mononucleotide sequences, dinucleotides, trinucleotides, and DNA-shape features to predict relative affinities of TF pairs for specific sequences [104].
Structural Biology Techniques: Nuclear magnetic resonance (NMR) spectroscopy and X-ray crystallography provide atomic-level insights into TF-TF-DNA interfaces. For instance, structural analysis of Forkhead-Ets pairs revealed local shape preferences at the Ets-DNA-Forkhead interface that explain cooperativity [104].
Figure 1: Experimental Workflow for Comprehensive TF-TF Interaction Analysis
Evolutionary Conservation and Divergence of TF Interactions
Deep Conservation of Binding Specificities
Despite extensive evolutionary divergence, the DNA-binding specificities of TFs exhibit remarkable conservation. Systematic comparison of Drosophila and human TFs revealed that orthologous TFs with similar protein sequences recognize highly similar DNA motifs, indicating strong evolutionary constraint on DNA-binding preferences [13]. This conservation persists despite poor conservation of protein-protein interactomes, suggesting that TF-DNA binding interfaces experience particularly strong purifying selection.
The conservation extends approximately 600 million years across bilaterian evolution, with even distantly related TFs from the same structural family maintaining similar binding specificities [13]. This deep conservation indicates that the fundamental "regulatory vocabulary" is largely shared across animal evolution, with changes in regulatory networks arising primarily through reorganization of existing elements rather than invention of new DNA-binding specificities.
Mechanisms of Regulatory Evolution
While core binding specificities remain conserved, regulatory networks evolve through several mechanisms:
Binding-Site Turnover: At the promoter level, compensatory changes maintain overall regulatory function while individual binding sites change location. This turnover involves loss of binding sites in one allele compensated by gain of adjacent sites in the orthologous allele [56]. Such turnover allows regulatory function to be preserved while sequence composition diverges.
Cis-Regulatory Divergence: Sequence variations in regulatory regions, particularly those affecting TF binding motifs, drive differences in TF binding between species. Analysis of allele-specific binding in yeast hybrids revealed that variations in motif sequences, rather than chromatin accessibility differences, primarily explain differential TF binding between orthologous alleles [56].
Cooperativity Evolution: While individual TF binding specificities remain conserved, cooperative partnerships can evolve rapidly. The small interaction surfaces required for DNA-facilitated cooperativity can evolve quickly, enabling the emergence of new regulatory connections without changes to core DNA-binding domains [26]. This evolutionary flexibility allows for the expansion of regulatory complexity while maintaining stable individual TF functions.
Functional Consequences of Cooperative TF Binding
Enhancer Specification and Cellular Identity
Cooperative TF binding plays a crucial role in defining cell-type-specific enhancers and establishing cellular identities. The selective cooperation between TWIST1 and homeodomain factors in face and limb mesenchyme defines mesenchymal regulatory regions through a long DNA motif called "Coordinator" [106]. This cooperativity drives enhancer accessibility and shared transcriptional programs that ultimately shape facial morphology and evolution.
The uneven distribution of cooperative sequences across different Forkhead-Ets pairs suggests an additional regulatory layer, where the same TFs can participate in distinct regulatory programs depending on their cooperative partnerships [104]. This context-dependent cooperation enables a limited set of TFs to generate enormous regulatory diversity across different cell types and developmental contexts.
Disease Associations and Clinical Implications
Cooperating TF pairs show strong associations with human diseases, particularly cancers. For example, the joint expression levels of FOXO1 and ETV6 in chronic lymphocytic leukemia patients significantly improve clinical outcome stratification and time-to-treatment predictions [104]. This suggests that cooperative TF interactions may serve as better biomarkers than individual TF expression levels.
Single-nucleotide polymorphisms (SNPs) associated with facial morphology are significantly enriched at Coordinator sites bound by TWIST1 and homeodomain factors [106], connecting specific cooperative interactions to human phenotypic variation. Similarly, many composite motifs identified through large-scale TF-TF interaction screens are enriched in cell-type-specific regulatory elements and disease-associated genomic regions [26].
Resolution of Specificity Paradoxes
Cooperative binding provides a mechanistic solution to long-standing specificity paradoxes in transcriptional regulation. The "hox specificity paradox," where anterior homeodomain proteins (HOX1-HOX8) bind identical TAATTA motifs despite having distinct functions, is resolved through selective cooperativity with different partner TFs [26]. Similarly, the disconnection between primary binding specificity and biological function observed across TF families can be explained by context-dependent cooperative partnerships.
Figure 2: Mechanism of DNA-Guided Transcription Factor Cooperativity
The Scientist's Toolkit: Essential Research Reagents and Methods
Table 3: Essential Research Reagents and Methods for Studying TF-TF Interactions
| Category | Specific Tools | Application | Key Features |
|---|---|---|---|
| High-Throughput Screening | CAP-SELEX | Global TF-TF interactome mapping | Identifies spacing, orientation, and composite motifs |
| NCAP-SELEX | Nucleosomal TF binding | Incorporates chromatin context | |
| Protein Binding Microarrays | Comprehensive binding specificity | All 10-mer sequence space coverage | |
| In Vivo Validation | ChEC-seq | High-resolution in vivo binding | MNase fusion for precise mapping |
| Allele-Specific Analysis | Cis-regulatory variation effects | Controls for trans effects | |
| CRISPR Perturbation | Functional validation | Tests necessity of interactions | |
| Computational Tools | Mutual Information Analysis | Interaction detection from sequencing data | Identifies spacing/orientation preferences |
| k-mer Enrichment Algorithms | Composite motif discovery | Detects novel binding specificities | |
| DNA Shape Prediction | Structural analysis of binding sites | Explains shape-mediated cooperativity | |
| Structural Biology | NMR Spectroscopy | Solution-state structure determination | Analyses DNA-protein interfaces |
| X-ray Crystallography | High-resolution complex structures | Atomic-level interaction details | |
| ITC (Isothermal Titration Calorimetry) | Binding thermodynamics | Quantifies interaction energetics |
The landscape of TF-TF interactions represents a critical expansion of our understanding of transcriptional regulation. Cooperative binding mechanisms resolve fundamental paradoxes in gene regulation by explaining how limited repertoires of TFs generate immense regulatory diversity. The experimental and computational frameworks now available enable systematic mapping of these interactions at unprecedented scale and resolution.
Future research directions will need to integrate multiple dimensions of complexity: the dynamic nature of TF interactions across cellular states, the integration of cooperative binding with chromatin architecture, and the application of mechanistic insights to understand disease pathogenesis. As these frameworks mature, we move closer to a predictive understanding of transcriptional regulation that can decipher the genomic code in all its complexity.
A profound shift is occurring in our understanding of evolutionary conservation. For decades, sequence conservation served as the primary indicator of functional importance in genomic elements. However, recent multi-tissue analyses reveal that cellular context dictates the functional impact of conserved elements with remarkable specificity. While approximately 90% of disease-associated genetic variants from genome-wide association studies (GWAS) reside in non-coding regions [108], these variants exert their effects through mechanisms that are precisely tailored to specific cell types rather than blanket functions across tissues. This paradigm explains why genetic variants can disrupt biological processes in one cellular environment while leaving others unaffected, fundamentally reshaping how we interpret the functional genome.
The integration of single-cell technologies with comparative genomics has been instrumental in uncovering this layered complexity. Where bulk tissue analyses averaged signals across heterogeneous cell populations, single-cell resolution exposes the intricate tapestry of cell-type-specific regulation. This article provides a systematic comparison of experimental approaches for identifying and validating cell-type-specific conserved elements, evaluates their performance across methodological frameworks, and delivers practical guidance for researchers navigating this rapidly evolving landscape. By examining the convergence of findings from diverse systems—from human brain to plant development—we illuminate conserved principles governing gene regulation across biological kingdoms.
Comparative Analysis of Conservation Mapping Approaches
Performance Benchmarking of Methodologies
Table 1: Comparison of Methods for Identifying Cell-Type-Specific Conserved Elements
| Method | Core Principle | Optimal Use Case | Species Range Demonstrated | Cell-Type Resolution | Technical Limitations |
|---|---|---|---|---|---|
| IPP (Interspecies Point Projection) [4] | Synteny-based projection independent of sequence similarity | Distantly related vertebrates (e.g., mouse-chicken) | Vertebrates | Tissue-level with complementary single-cell data | Requires multiple bridging species for optimal performance |
| scMultiMap [108] | Joint latent-variable modeling of multi-modal single-cell data | Enhancer-gene mapping in disease contexts | Human, mouse | Single-cell | Computational burden for extremely large datasets |
| DAP-Seq [8] | In vitro TF binding profiling with genomic DNA | Transcription factor binding site identification | Plants, fungi, bacteria | Single-cell integration possible | Lacks native chromatin context |
| deepTFBS [50] | Multi-task deep learning for cross-species prediction | TFBS prediction with limited training data | Plants (Arabidopsis, wheat) | Not cell-type-specific | Requires sufficient training data for accuracy |
| Conserved Motif Analysis [35] [109] | Comparative genomics of promoter regions | Identifying core regulatory programs | Plants (common bean, Arabidopsis) | Bulk tissue | Limited to promoter regions |
Quantitative Performance Metrics
Table 2: Empirical Performance Metrics of Conservation Detection Methods
| Method | Sensitivity Gain Over Traditional Approaches | Specificity/ Precision | Evolutionary Distance Capability | Experimental Validation Rate | Computational Efficiency |
|---|---|---|---|---|---|
| IPP [4] | 5x for enhancers (7.4% to 42% in mouse-chicken) | High (validated by chromatin signatures) | Very high (150+ million years) | In vivo reporter assays (mouse-chicken) | Moderate (requires multiple genome alignments) |
| scMultiMap [108] | Highest heritability enrichment in microglia | High (consistent with orthogonal methods) | Moderate (within mammals) | Consistency with Hi-C, PLAC-seq | High (1% of existing methods' compute time) |
| DAP-Seq [8] | Identifies 3,000+ binding maps across species | Moderate (filtered by evolutionary conservation) | High (150 million years plants) | ChIP-seq validation | High (scalable to multiple species) |
| Conserved Motif Analysis [35] | 6 conserved motifs per gene on average | High for core regulatory genes | Moderate (within legumes) | Correlation with gene expression | High |
Experimental Protocols for Conservation Analysis
IPP (Interspecies Point Projection) for Sequence-Diverged Enhancers
The IPP protocol enables identification of functionally conserved regulatory elements despite high sequence divergence [4]. This method operates on the principle that syntenic arrangement often persists even when individual sequences diverge beyond recognition by alignment-based methods.
Workflow Steps:
- Identification of anchor points: Generate pairwise alignments between source species (e.g., mouse) and multiple bridging species, plus direct alignments with target species (e.g., chicken)
- Projection interpolation: For each regulatory element in the source genome, calculate its relative position between flanking alignable regions
- Bridged alignment: Use multiple bridging species to minimize distance to anchor points, improving projection accuracy
- Confidence classification:
- Directly conserved (DC): <300bp from direct alignment
- Indirectly conserved (IC): >300bp from direct alignment but <2.5kb summed distance to anchor points via bridged alignments
- Non-conserved (NC): All other elements
- Functional validation: Test projected enhancers using in vivo reporter assays in model systems
Key Experimental Parameters:
- Minimum of 14 bridging species recommended for mouse-chicken comparisons
- Tissue-matched epigenetic data (ATAC-seq, H3K27ac ChIPmentation) required for both species
- High-quality genome assemblies essential for accurate synteny detection
scMultiMap for Cell-Type-Specific Enhancer-Gene Mapping
scMultiMap employs a statistical framework for inferring enhancer-gene associations from single-cell multimodal data [108]. The method addresses critical challenges of data sparsity, technical confounding, and cross-sample variation that plague single-cell analyses.
Mathematical Framework: The model simultaneously represents gene expression and chromatin accessibility through a joint latent-variable structure:
- Let (x{ij}) and (y{ij'}) represent observed counts of gene (j) and peak (j') in cell (i)
- Let (z{ij}) and (v{ij'}) represent underlying expression and accessibility levels
- Model specification: [ \begin{array}{rc} (z{i1},\ldots,z{ip},v{i1},\ldots,v{iq}) \sim F{p+q}(\boldsymbol{\mu}, \boldsymbol{\Sigma}), \ x{ij} | z{ij} \sim \text{Poisson}(si z{ij}), \ y{ij'} | v{ij'} \sim \text{Poisson}(ri v_{ij'}) \end{array} ]
- Where (si) and (ri) represent sequencing depths for RNA and ATAC respectively
- The covariance matrix (\boldsymbol{\Sigma}) captures biological variation and contains parameters of interest for peak-gene associations
Protocol Implementation:
- Data preprocessing: Quality control, normalization, and batch effect correction for paired scRNA-seq and scATAC-seq data
- Cell-type identification: Cluster cells based on integrated modalities and annotate using marker genes
- Model fitting: Apply moment-based estimation to derive correlation estimates between peak accessibility and gene expression
- Statistical testing: Calculate analytically derived p-values for peak-gene associations
- Heritability enrichment: Test enrichment of GWAS signals in cell-type-specific enhancers
Performance Advantages:
- 100x faster than Monte Carlo-based methods
- Appropriate type I error control even with sparse data
- High consistency with orthogonal methods (HiChIP, PLAC-seq)
Signaling Pathways and Regulatory Networks
Conserved Transcription Factor Networks Across Species
Analysis of transcription factor binding motifs reveals remarkable conservation across large evolutionary distances [109]. Studies of 686 Arabidopsis transcription factors identified 74 conserved motifs spanning 50 families, with nearly identical binding motifs maintained for 450 million years from Marchantia to angiosperms.
Key Findings on TF Family Conservation:
- High conservation families: 21 families show one core motif for all analyzed members
- Clade-specific conservation: 5 families show motif conservation along phylogenetic clades
- High diversity families: C2H2 zinc finger family shows extensive motif diversification
- Evolutionary pattern: Greater evolution in cis-regulatory elements than trans-regulatory factors
Plant-Specific Insights: In common bean, comparative genomics of promoter regions identified conserved transcription factor binding sites for 12,631 genes [35]. The ERF, MYB, and bHLH transcription factor families dominated conserved motifs, with implications for starch biosynthesis regulation. A significant relationship emerged between the number of conserved motifs and available experimental evidence of gene regulation, supporting the biological relevance of conserved binding sites.
Cell-Type-Specific Expression Evolution
The EVaDe (Expression Variance Decomposition) framework enables detection of adaptive evolution in comparative single-cell expression data [110]. This approach identifies genes exhibiting large between-taxon expression divergence with small within-cell-type expression noise, a pattern indicative of putative adaptive evolution.
Application in Primate Prefrontal Cortex:
- Human-specific key genes enrich for neurodevelopment-related functions
- Most genes exhibit neutral evolution patterns
- Specific neuron types harbor more key genes than other cell types
- Key genes significantly associate with rapidly evolving conserved non-coding elements
Cross-Species Validation: Analysis of naked mole-rat versus mouse comparison revealed that innate-immunity-related genes and cell types underwent putative expression adaptation in the naked mole-rat, demonstrating the method's utility beyond primate systems.
The Scientist's Toolkit: Essential Research Reagents
Table 3: Key Research Reagents for Cell-Type-Specific Conservation Studies
| Reagent/Resource | Primary Function | Example Application | Key Advantage | Access Information |
|---|---|---|---|---|
| DAP-Seq Binding Maps [8] | Genome-wide TF binding profiling | 3,000+ binding maps for 360 TFs across 10 plant species | Species-agnostic; works on plants, fungi, bacteria | Publicly available through JGI portal |
| Cattle Cell Atlas [111] | Multi-tissue single-cell reference | 1.7M+ cells from 59 bovine tissues | Enables livestock-to-human translational insights | https://ngdc.cncb.ac.cn/cattleca/ |
| scMultiMap Software [108] | Enhancer-gene mapping from multi-modal data | Alzheimer's disease microglia enhancer discovery | 100x faster than existing methods | Available upon publication |
| Plant TFDB Database [35] | Plant transcription factor binding motifs | 338 P. vulgaris TFBSs representing 40 families | Plant-specific binding models | Publicly available database |
| CellAge SnG Database [112] | Senescence gene annotations | Network analysis of SnGs across 50 human tissues | Curated from genetic manipulation experiments | Publicly available database |
Discussion: Convergence of Evidence Across Biological Systems
The integrated analysis of methodologies presented here reveals a consistent narrative: functional conservation often operates through mechanisms invisible to sequence-based analyses alone. The fivefold increase in detectable conserved enhancers using synteny-based approaches [4], the cell-type-specific heritability enrichment for Alzheimer's disease risk in microglia [108], and the deep conservation of transcription factor binding motifs across 450 million years of plant evolution [109] collectively underscore that regulatory conservation must be evaluated through cellular context.
These findings have immediate implications for drug development, particularly in prioritizing therapeutic targets. The identification of PABPC1 as a novel candidate causal gene for Alzheimer's disease specifically in astrocytes [113], rather than uniformly across brain cell types, illustrates how cell-type-specific conservation mapping can reveal previously overlooked therapeutic targets. Similarly, the classification of 28 Alzheimer's candidate genes into three drug tiers demonstrates the translational potential of these approaches [113].
Future methodological development should focus on integrating the complementary strengths of these approaches—combining scMultiMap's resolution with IPP's evolutionary depth, and DAP-seq's binding specificity with conserved motif analysis's predictive power. As single-cell multi-omic technologies become increasingly accessible, the research community stands poised to unravel the full complexity of how conserved genomic elements orchestrate cellular function across the diversity of life.
Conclusion
The analysis of transcription factor binding site conservation provides an essential framework for distinguishing functional regulatory elements from genomic background. The integration of comparative genomics with experimental validation reveals that conserved binding-site clusters, rather than individual motifs, most accurately predict functional significance. Recent advances in mapping TF-TF interactions have dramatically expanded our understanding of the human gene regulatory code, demonstrating how cooperative binding creates specificity beyond primary motif recognition. For biomedical research, these approaches enable systematic interpretation of non-coding variants identified through genome-wide association studies and provide rational strategies for prioritizing regulatory mutations in rare disease investigation. Future directions will require scaling these methods to additional tissue types, developing more sophisticated models of cooperative binding, and creating integrated platforms that bridge evolutionary conservation with clinical variant interpretation to accelerate therapeutic development.
References
- 1. Computational identification of developmental enhancers... [https://pubmed.ncbi.nlm.nih.gov/15345045/]
- 2. In-silico identification and comparison of transcription ... factor binding [https://journals.plos.org/plosone/article?id=10.1371/journal.pone.0290035]
- 3. Multi-species, multi-transcription factor binding highlights ... [https://pmc.ncbi.nlm.nih.gov/articles/PMC4359374/]
- 4. Conservation of regulatory elements with highly diverged ... [https://www.nature.com/articles/s41588-025-02202-5]
- 5. CollecTF: a database of experimentally validated transcription ... [https://pmc.ncbi.nlm.nih.gov/articles/PMC3965012/]
- 6. Tracing the Evolution of Lineage-Specific Transcription ... [https://pmc.ncbi.nlm.nih.gov/articles/PMC4140645/]
- 7. The evolution of Great Apes has shaped the functional ... [https://www.sciencedirect.com/science/article/pii/S1873506119300868]
- 8. DAP-seq Drives Robust Mapping of Gene Regulation [https://jgi.doe.gov/user-science/science-stories/dap-seq-drives-robust-mapping-gene-regulation]
- 9. The highly rugged yet navigable regulatory landscape of ... [https://www.nature.com/articles/s41467-024-54723-y]
- 10. DNA methylation patterns of transcription factor binding ... [https://genomebiology.biomedcentral.com/articles/10.1186/s13059-024-03218-6]
- 11. Tracing the Evolution of Lineage-Specific Transcription Factor ... [https://journals.plos.org/ploscompbiol/article?id=10.1371/journal.pcbi.1003771]
- 12. Evolutionary Potential of Cis-Regulatory Mutations to ... [https://pmc.ncbi.nlm.nih.gov/articles/PMC6370388/]
- 13. Peer review in Conservation of transcription factor binding ... [https://elifesciences.org/articles/04837/peer-reviews]
- 14. conservation and function of transcription factor binding-site ... [https://pmc.ncbi.nlm.nih.gov/articles/PMC522868/]
- 15. Analysis of variation at transcription factor binding sites in ... [https://genomebiology.biomedcentral.com/articles/10.1186/gb-2012-13-9-r49]
- 16. Article Cooperativity and Rapid Evolution of Cobound ... [https://www.sciencedirect.com/science/article/pii/S0092867413008416]
- 17. Motif-based models accurately predict cell type-specific ... [https://www.nature.com/articles/s41467-025-65362-2]
- 18. “Frustratingly easy†domain adaptation for cross-species ... [https://pmc.ncbi.nlm.nih.gov/articles/PMC12154900/]
- 19. Identification of functional transcription factor binding sites ... [https://pmc.ncbi.nlm.nih.gov/articles/PMC1088298/]
- 20. Conservation of transcription factor binding events predicts ... [https://pmc.ncbi.nlm.nih.gov/articles/PMC3167604/]
- 21. Multi-species, multi-transcription factor binding highlights ... [https://elifesciences.org/articles/02626]
- 22. Profiling conserved transcription factor binding motifs in ... [https://pmc.ncbi.nlm.nih.gov/articles/PMC11841308/]
- 23. The biological function of some human transcription factor ... [https://pmc.ncbi.nlm.nih.gov/articles/PMC2377430/]
- 24. conservation and function of transcription factor binding-site ... [https://genomebiology.biomedcentral.com/articles/10.1186/gb-2004-5-9-r61]
- 25. MONKEY: identifying conserved transcription-factor binding ... [https://genomebiology.biomedcentral.com/articles/10.1186/gb-2004-5-12-r98]
- 26. DNA-guided transcription factor interactions extend human ... [https://www.nature.com/articles/s41586-025-08844-z]
- 27. Genome-Wide Analysis of the ERF Gene Family in ... [https://pmc.ncbi.nlm.nih.gov/articles/PMC1361313/]
- 28. Genome-wide classification and expression analysis of MYB ... [https://pmc.ncbi.nlm.nih.gov/articles/PMC3542171/]
- 29. (PDF) Evolutionary and comparative analysis of MYB and bHLH plant... [https://www.academia.edu/79309878/Evolutionary_and_comparative_analysis_of_MYB_and_bHLH_plant_transcription_factors]
- 30. Genome-wide characterization and analysis of bHLH ... [https://www.sciencedirect.com/science/article/pii/S2211383517305877]
- 31. Conservation of transcription factor binding specificities ... [https://elifesciences.org/articles/04837]
- 32. Cooperation between bHLH transcription factors and ... [https://www.nature.com/articles/s41586-023-06282-3]
- 33. An evolutionarily conserved DNA architecture determines ... [https://pmc.ncbi.nlm.nih.gov/articles/PMC4378193/]
- 34. The R2R3- MYB Transcriptional Repressor TgMYB4 Negatively... [https://pmc.ncbi.nlm.nih.gov/articles/PMC10779166/]
- 35. Profiling conserved transcription factor binding motifs in Phaseolus... [https://bmcgenomics.biomedcentral.com/articles/10.1186/s12864-025-11309-2]
- 36. Limited conservation in cross-species comparison of GLK ... [https://www.nature.com/articles/s41467-022-35438-4]
- 37. Orthology inference at scale with FastOMA [https://www.nature.com/articles/s41592-024-02552-8]
- 38. FastOMA: a fast and accurate orthology inference tool [https://comparative-genomics.ch/2025/01/03/fastoma-a-fast-and-accurate-orthology-inference-tool/]
- 39. OrthoGrafter: Rapid Identification of Orthologs from ... [https://link.springer.com/article/10.1007/s00239-025-10279-z]
- 40. A systematic, large-scale comparison of transcription factor ... [https://bmcgenomics.biomedcentral.com/articles/10.1186/s12864-016-2729-8]
- 41. Five vertebrate ChIP-seq reveals the evolutionary dynamics of ... [https://pmc.ncbi.nlm.nih.gov/articles/PMC3008766/]
- 42. Positional distribution of transcription factor binding sites in the ... [https://journals.plos.org/plosone/article?id=10.1371/journal.pone.0329226]
- 43. Virtual ChIP-seq: predicting transcription factor binding by ... [https://genomebiology.biomedcentral.com/articles/10.1186/s13059-022-02690-2]
- 44. The DoGA consortium expression atlas of promoters and ... [https://www.nature.com/articles/s41467-024-52798-1]
- 45. Genome-wide association study of common bean ... [https://www.nature.com/articles/s41598-025-07965-9]
- 46. Natural rhizobial diversity helps to reveal genes and QTLs ... [https://pmc.ncbi.nlm.nih.gov/articles/PMC6604995/]
- 47. Genetic mapping of legume orthologs reveals high ... [https://pmc.ncbi.nlm.nih.gov/articles/PMC4256995/]
- 48. Leveraging barrel medic genome sequence for the ... [https://www.sciencedirect.com/science/article/pii/S0717345819300041]
- 49. Bridging Genes and Sensory Characteristics in Legumes [https://www.mdpi.com/2073-4395/15/8/1849]
- 50. deepTFBS: Improving within- and Cross-Species ... [https://pubmed.ncbi.nlm.nih.gov/40411397/]
- 51. DNase I hypersensitive site [https://en.wikipedia.org/wiki/DNase_I_hypersensitive_site]
- 52. DNase I Hypersensitive Site - an overview [https://www.sciencedirect.com/topics/biochemistry-genetics-and-molecular-biology/dnase-i-hypersensitive-site]
- 53. and biological spectrum of human DNase I hypersensitive ... [https://www.nature.com/articles/s41586-020-2559-3]
- 54. DNase I hypersensitivity mapping, genomic footprinting ... [https://www.sciencedirect.com/science/article/pii/S2214662815000122]
- 55. Long-range DNase I hypersensitivity mapping reveals the ... [https://pmc.ncbi.nlm.nih.gov/articles/PMC1240080/]
- 56. Evolution of transcription factor binding through sequence ... [https://pmc.ncbi.nlm.nih.gov/articles/PMC9248875/]
- 57. A survey on algorithms to characterize transcription factor ... [https://pmc.ncbi.nlm.nih.gov/articles/PMC10422928/]
- 58. Prediction of synergistic transcription factors by function ... [https://genomebiology.biomedcentral.com/articles/10.1186/gb-2007-8-12-r257]
- 59. Many transcription factor families have evolutionarily ... [https://pmc.ncbi.nlm.nih.gov/articles/PMC12142463/]
- 60. Conserved and species-specific transcription factor co-binding ... [https://pubmed.ncbi.nlm.nih.gov/29361190/]
- 61. Analysis of Genomic Sequence Motifs for Deciphering ... [https://www.frontiersin.org/journals/genetics/articles/10.3389/fgene.2016.00024/full]
- 62. Towards a theoretical understanding of false positives in DNA motif finding | BMC Bioinformatics | Full Text [https://bmcbioinformatics.biomedcentral.com/articles/10.1186/1471-2105-13-151]
- 63. Towards a theoretical understanding of false positives in DNA motif finding - PubMed [https://pubmed.ncbi.nlm.nih.gov/22738169/]
- 64. Insights gained from a comprehensive all-against-all ... [https://genomebiology.biomedcentral.com/articles/10.1186/s13059-020-01996-3]
- 65. FIMO: scanning for occurrences of a given motif - PMC [https://www.ncbi.nlm.nih.gov/pmc/articles/PMC3065696/]
- 66. Integrated analysis of motif activity and gene expression changes of transcription factors - PMC [https://www.ncbi.nlm.nih.gov/pmc/articles/PMC5793788/]
- 67. A systematic, large-scale comparison of transcription factor ... [https://pmc.ncbi.nlm.nih.gov/articles/PMC4875604/]
- 68. The evaluation of transcription factor binding site prediction ... [https://pmc.ncbi.nlm.nih.gov/articles/PMC11613939/]
- 69. JASPAR - A database of transcription factor binding profiles [https://jaspar.elixir.no/]
- 70. JASPAR TFBS extraction [https://jaspar.elixir.no/tfbs_extraction/]
- 71. High-throughput sequencing SELEX for the determination ... [https://pmc.ncbi.nlm.nih.gov/articles/PMC9243297/]
- 72. DNA-Binding Specificities of Human Transcription Factors [https://www.sciencedirect.com/science/article/pii/S0092867412014961]
- 73. Protein Binding Microarrays (PBMs) for the Rapid, High ... [https://pmc.ncbi.nlm.nih.gov/articles/PMC2690637/]
- 74. A comparative analysis of transcription factor binding models ... [https://pmc.ncbi.nlm.nih.gov/articles/PMC4005680/]
- 75. Cross-platform motif discovery and benchmarking to ... [https://www.nature.com/articles/s42003-025-08909-9]
- 76. TFBS - Home - Institute for Systems Biology [https://tfbsdb.systemsbiology.net/optimalPromoter]
- 77. Classifying Promoters by Interpreting the Hidden ... [https://pmc.ncbi.nlm.nih.gov/articles/PMC6848157/]
- 78. Benchmarking Bacterial Promoter Prediction Tools [https://pmc.ncbi.nlm.nih.gov/articles/PMC7449607/]
- 79. SEQSIM: A novel bioinformatics tool for comparisons of ... [https://bmcbioinformatics.biomedcentral.com/articles/10.1186/s12859-025-06160-x]
- 80. Comparative Promoter Analysis and its Application in ... [https://www.sciencedirect.com/science/article/abs/pii/S0022283603000536#!]
- 81. Large-Scale Turnover of Functional Transcription Factor ... [https://journals.plos.org/ploscompbiol/article?id=10.1371/journal.pcbi.0020130]
- 82. Frequent gain and loss of functional transcription factor ... [https://pubmed.ncbi.nlm.nih.gov/17530920/]
- 83. Decoupling of evolutionary changes in transcription factor ... [https://pmc.ncbi.nlm.nih.gov/articles/PMC4315291/]
- 84. of regulatory elements with highly... | Nature Genetics Conservation [https://www.nature.com/articles/s41588-025-02202-5?error=cookies_not_supported&code=a57b3011-4163-43ab-b38a-88dd86edc1ae]
- 85. Evolutionary rates and patterns for human transcription ... factor [https://pmc.ncbi.nlm.nih.gov/articles/PMC2397414/]
- 86. A survey of DNA motif finding algorithms - BMC Bioinformatics [https://bmcbioinformatics.biomedcentral.com/articles/10.1186/1471-2105-8-S7-S21]
- 87. CONREAL: Conserved Regulatory Elements Anchored ... [https://pmc.ncbi.nlm.nih.gov/articles/PMC314294/]
- 88. AVID: A Global Alignment Program - PMC [https://pmc.ncbi.nlm.nih.gov/articles/PMC430967/]
- 89. Lagan instructions [https://genome.lbl.gov/vista/lagan/instructions.shtml]
- 90. ReAlignerV: Web-based genomic alignment tool with high ... [https://pmc.ncbi.nlm.nih.gov/articles/PMC2267439/]
- 91. Grid-Enabled BLASTZ: Application to Comparative Genomics [https://link.springer.com/article/10.1007/s11265-007-0065-6]
- 92. LAGAN and Multi-LAGAN: Efficient Tools for Large-Scale ... [https://pmc.ncbi.nlm.nih.gov/articles/PMC430158/]
- 93. CONREAL: Conserved Regulatory Elements Anchored ... [https://pubmed.ncbi.nlm.nih.gov/14672977/]
- 94. Article Optimized reporters for multiplexed detection of ... [https://www.sciencedirect.com/science/article/pii/S2405471224003120]
- 95. Massively parallel reporter assay for mapping gene ... [https://elifesciences.org/reviewed-preprints/107565]
- 96. Experimental Validation of Genomeâ€Environment ... [https://pmc.ncbi.nlm.nih.gov/articles/PMC12573728/]
- 97. Multiple overlapping binding sites determine transcription ... [https://pmc.ncbi.nlm.nih.gov/articles/PMC12447533/]
- 98. High Resolution Models of Transcription Factor-DNA Affinities ... [https://journals.plos.org/ploscompbiol/article?id=10.1371/journal.pcbi.1000916]
- 99. Accurate inference of transcription factor binding from DNA ... [https://pmc.ncbi.nlm.nih.gov/articles/PMC3044858/]
- 100. A Biophysical Model for Analysis of Transcription Factor ... [https://journals.plos.org/plosone/article?id=10.1371/journal.pone.0008155]
- 101. Identifying transcription factors with cell-type specific DNA ... [https://bmcgenomics.biomedcentral.com/articles/10.1186/s12864-024-10859-1]
- 102. Identification and Conservation Analysis of Cis-Regulatory ... [https://pmc.ncbi.nlm.nih.gov/articles/PMC6562536/]
- 103. Leveraging Cross-Species Transcription Factor Binding ... [https://www.sciencedirect.com/science/article/pii/S0092867413015353]
- 104. Mechanistic insights into transcription factor cooperativity ... [https://www.nature.com/articles/s41467-019-13888-7]
- 105. The interaction landscape between transcription factors and ... [https://pmc.ncbi.nlm.nih.gov/articles/PMC6173309/]
- 106. DNA-guided transcription factor cooperativity shapes face ... [https://www.sciencedirect.com/science/article/pii/S0092867423014381]
- 107. Experimental strategies for studying transcription factor– ... [https://pmc.ncbi.nlm.nih.gov/articles/PMC3080775/]
- 108. scMultiMap: Cell-type-specific mapping of enhancers and ... [https://www.nature.com/articles/s41467-025-59306-z]
- 109. Many transcription factor families have evolutionarily ... [https://pubmed.ncbi.nlm.nih.gov/40408265/]
- 110. Method Unveiling cell-type-specific mode of evolution in ... [https://www.sciencedirect.com/science/article/pii/S1673852725001316]
- 111. A multi-tissue single-cell expression atlas in cattle [https://www.nature.com/articles/s41588-025-02329-5]
- 112. The landscape of human tissue and cell type specific ... [https://pmc.ncbi.nlm.nih.gov/articles/PMC8744330/]
- 113. Multi-omics analysis for identifying cell-type-specific and bulk ... [https://pmc.ncbi.nlm.nih.gov/articles/PMC12257706/]